PhD Thesis, 2007 - University College Cork
PhD Thesis, 2007 - University College Cork
PhD Thesis, 2007 - University College Cork

Create successful ePaper yourself
Turn your PDF publications into a flip-book with our unique Google optimized e-Paper software.
Chapter 6<br />
water and energy budgets<br />
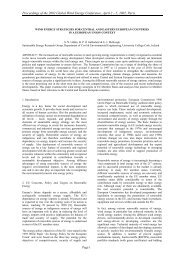
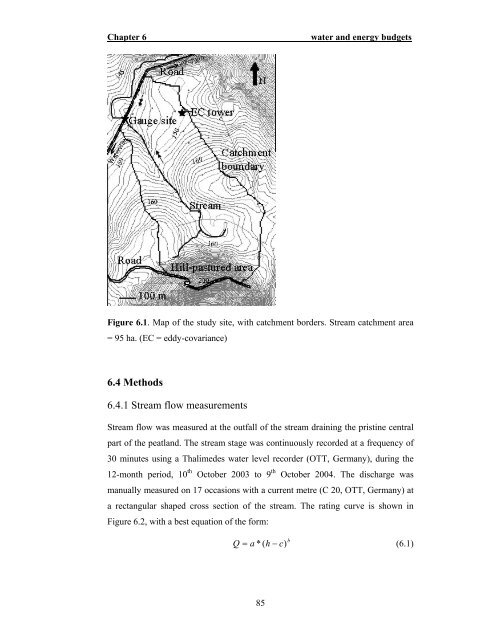
Figure 6.1. Map of the study site, with catchment borders. Stream catchment area<br />
= 95 ha. (EC = eddy-covariance)<br />
6.4 Methods<br />
6.4.1 Stream flow measurements<br />
Stream flow was measured at the outfall of the stream draining the pristine central<br />
part of the peatland. The stream stage was continuously recorded at a frequency of<br />
30 minutes using a Thalimedes water level recorder (OTT, Germany), during the<br />
12-month period, 10 th October 2003 to 9 th October 2004. The discharge was<br />
manually measured on 17 occasions with a current metre (C 20, OTT, Germany) at<br />
a rectangular shaped cross section of the stream. The rating curve is shown in<br />
Figure 6.2, with a best equation of the form:<br />
Q )<br />
b<br />
= a * ( h − c<br />
(6.1)<br />
85