PhD Thesis, 2007 - University College Cork
PhD Thesis, 2007 - University College Cork
PhD Thesis, 2007 - University College Cork

You also want an ePaper? Increase the reach of your titles
YUMPU automatically turns print PDFs into web optimized ePapers that Google loves.
Chapter 4<br />
Vegetation survey<br />
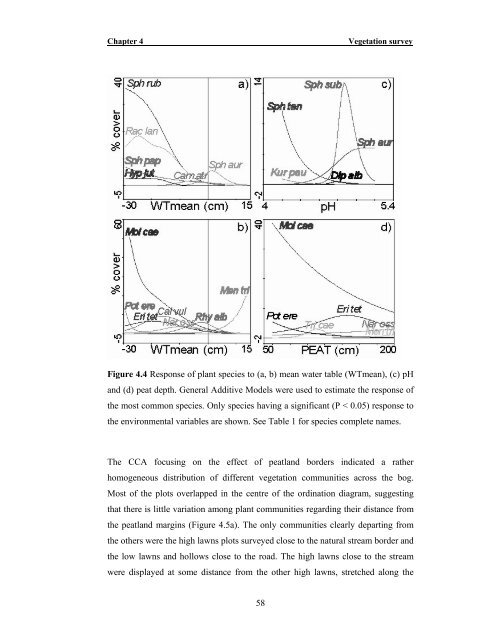
Figure 4.4 Response of plant species to (a, b) mean water table (WTmean), (c) pH<br />
and (d) peat depth. General Additive Models were used to estimate the response of<br />
the most common species. Only species having a significant (P < 0.05) response to<br />
the environmental variables are shown. See Table 1 for species complete names.<br />
The CCA focusing on the effect of peatland borders indicated a rather<br />
homogeneous distribution of different vegetation communities across the bog.<br />
Most of the plots overlapped in the centre of the ordination diagram, suggesting<br />
that there is little variation among plant communities regarding their distance from<br />
the peatland margins (Figure 4.5a). The only communities clearly departing from<br />
the others were the high lawns plots surveyed close to the natural stream border and<br />
the low lawns and hollows close to the road. The high lawns close to the stream<br />
were displayed at some distance from the other high lawns, stretched along the<br />
58