- Page 1 and 2: Department of Civil and Environment
- Page 3 and 4: Declaration I declare that this the
- Page 5 and 6: A comparison between the four years
- Page 7 and 8: Table of contents DECLARATION I ABS
- Page 9 and 10: 4.3.2 Vegetation survey 43 4.3.3 En
- Page 11 and 12: 8 RECOMMENDATIONS FOR FUTURE RESEAR
- Page 13 and 14: Chapter 1 Introduction blanket bogs
- Page 15 and 16: Chapter 1 Introduction general disc
- Page 17 and 18: Chapter 2 Literature review 2.2 The
- Page 19 and 20: Chapter 2 Literature review The mai
- Page 21 and 22: Chapter 2 Literature review Joiner
- Page 23 and 24: Chapter 2 Literature review warming
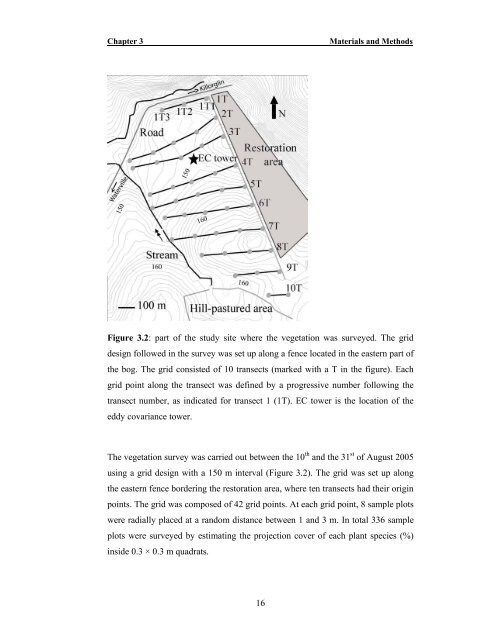
- Page 25: Chapter 3 Materials and Methods 3 M
- Page 29 and 30: Chapter 3 Materials and Methods Man
- Page 31 and 32: Chapter 3 Materials and Methods rep
- Page 33 and 34: Chapter 3 Materials and Methods 3.3
- Page 35 and 36: Chapter 3 Materials and Methods dro
- Page 37 and 38: Chapter 3 Materials and Methods whe
- Page 39 and 40: Chapter 3 Materials and Methods var
- Page 41 and 42: Chapter 3 Materials and Methods Err
- Page 43 and 44: Chapter 3 Materials and Methods 3.4
- Page 45 and 46: Chapter 3 Materials and Methods Tab
- Page 47 and 48: Chapter 3 Materials and Methods 3.4
- Page 49 and 50: Chapter 3 Materials and Methods Gap
- Page 51 and 52: Chapter 4 Vegetation survey 4.1 Sum
- Page 53 and 54: Chapter 4 Vegetation survey respons
- Page 55 and 56: Chapter 4 Vegetation survey borderi
- Page 57 and 58: Chapter 4 Vegetation survey were re
- Page 59 and 60: Chapter 4 Vegetation survey Table 4
- Page 61 and 62: Chapter 4 Vegetation survey Code Al
- Page 63 and 64: Chapter 4 Vegetation survey frequen
- Page 65 and 66: Chapter 4 Vegetation survey bryophy
- Page 67 and 68: Chapter 4 Vegetation survey Figure
- Page 69 and 70: Chapter 4 Vegetation survey Figure
- Page 71 and 72: Chapter 4 Vegetation survey Figure
- Page 73 and 74: Chapter 4 Vegetation survey 4.5 Dis
- Page 75 and 76: Chapter 4 Vegetation survey 4.5.3 T
- Page 77 and 78:
Chapter 4 Vegetation survey the pre
- Page 79 and 80:
Chapter 5 CO 2 fluxes An Atlantic B
- Page 81 and 82:
Chapter 5 CO 2 fluxes others were f
- Page 83 and 84:
Chapter 5 CO 2 fluxes malfunction o
- Page 85 and 86:
Chapter 5 CO 2 fluxes 5.5 Results T
- Page 87 and 88:
Chapter 5 CO 2 fluxes The cumulativ
- Page 89 and 90:
Chapter 5 CO 2 fluxes CO 2 flux of
- Page 91 and 92:
Chapter 6 water and energy budgets
- Page 93 and 94:
Chapter 6 water and energy budgets
- Page 95 and 96:
Chapter 6 water and energy budgets
- Page 97 and 98:
Chapter 6 water and energy budgets
- Page 99 and 100:
Chapter 6 water and energy budgets
- Page 101 and 102:
Chapter 6 water and energy budgets
- Page 103 and 104:
Table 6.1. Annual and growing seaso
- Page 105 and 106:
Chapter 6 Water and energy budgets
- Page 107 and 108:
Chapter 6 Water and energy budgets
- Page 109 and 110:
a) Chapter 6 Water and energy budge
- Page 111 and 112:
Chapter 6 Water and energy budgets
- Page 113 and 114:
Chapter 6 Water and energy budgets
- Page 115 and 116:
Chapter 6 Water and energy budgets
- Page 117 and 118:
Chapter 6 Water and energy budgets
- Page 119 and 120:
Chapter 6 Water and energy budgets
- Page 121 and 122:
Chapter 6 Water and energy budgets
- Page 123 and 124:
Chapter 6 Water and energy budgets
- Page 125 and 126:
Chapter 6 Water and energy budgets
- Page 127 and 128:
Chapter 7 General discussion 7 Gene
- Page 129 and 130:
Chapter 7 General discussion genera
- Page 131 and 132:
Chapter 8 Recommendations for futur
- Page 133 and 134:
References Aurela, M., Laurila, T.
- Page 135 and 136:
References Campbell, D. R. & Rochef
- Page 137 and 138:
References Friborg, T., Soegaard, H
- Page 139 and 140:
References Horst, T. W. & Weil, J.
- Page 141 and 142:
References Lafleur, P. M., Hember,
- Page 143 and 144:
References Malmer, N. 1986. Vegetat
- Page 145 and 146:
References Økland, R. H., Økland,
- Page 147 and 148:
References Shimoyama, K., Hiyama, T
- Page 149 and 150:
References Tahvanainen, T. & Tuomal
- Page 151 and 152:
References Vourlitis, G. L. & Oeche
- Page 154 and 155:
Appendix 1 Four-year CO 2 fluxes Da
- Page 156 and 157:
Appendix 1 Four-year CO 2 fluxes 5
- Page 158 and 159:
Appendix 1 Four-year CO 2 fluxes Da