PhD Thesis, 2007 - University College Cork
PhD Thesis, 2007 - University College Cork
PhD Thesis, 2007 - University College Cork

You also want an ePaper? Increase the reach of your titles
YUMPU automatically turns print PDFs into web optimized ePapers that Google loves.
Chapter 4<br />
Vegetation survey<br />
Weighted<br />
average of<br />
all<br />
microforms<br />
Hummocks<br />
(n = 20)<br />
High lawns<br />
(n = 42)<br />
Low lawns<br />
(n = 15)<br />
Hollows<br />
(n = 9)<br />
pH 4.53 (0.13) 4.54 a (0.14) 4.51 a (0.12) 4.59 ab (0.15) 4.75 b (0.25)<br />
Kcorr (µS cm -1 ) 46.7 (5.3) 46.0 a (4.5) 46.8 a (5.3) 46.5 a (6.4) 46.5 a (4.8)<br />
Na + (mg l -1 ) 6.70 (1.20) 6.38 a (0.92) 6.78 a (1.35) 6.33 a (0.45) 6.31 a (0.52)<br />
Ca + (mg l -1 ) 0.76 (0.43) 0.93 a (0.56) 0.74 a (0.41) 0.76 a (0.49) 0.66 a (0.37)<br />
Cl - (mg l -1 l) 8.89 (1.20) 8.64 a (1.25) 8.94 a (1.22) 8.81 a (1.21) 8.69 a (0.69)<br />
SO 2- 4 (mg l -1 ) 1.93 (0.50) 1.86 ab (0.47) 2.00 a (0.50) 1.60 b (0.54) 1.48 b (0.49)<br />
NH + 4 (mg N l -1 )<br />
0.042 0.039 a 0.044 a 0.027 a 0.023 a<br />
(0.047) (0.033) (0.053) (0.017) (0.012)<br />
TON (mg N l -1 )<br />
0.019 0.011 a 0.022 a 0.005 a 0.006 a<br />
(0.060) (0.022) (0.072) (0.005) (0.006)<br />
Colour (Hazen) 109 (68) 83 a (45) 113 a (72) 88 a (49) 123 a (76)<br />
WThigh (cm) -3.6 (4.2) -10.7 a (6.1) -4.0 b (4.1) 1.1 c (1.1) 11.9 d (7.8)<br />
WTlow (cm) -18.7 (6.9) -22.9 a (7.0) -20.2 a (7.0) -6.5 b (5.4) -3.2 b (7.0)<br />
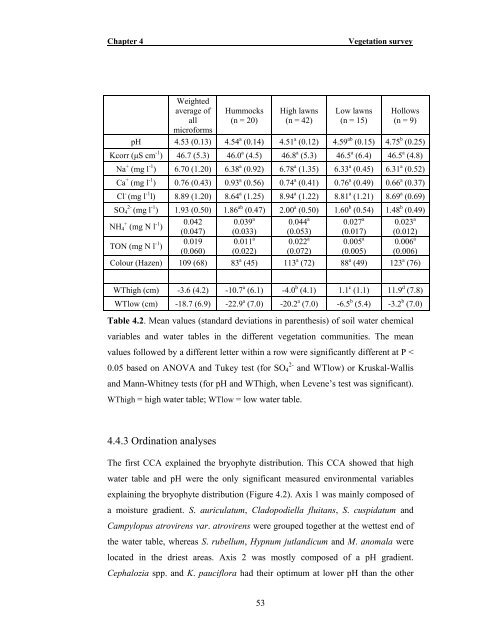
Table 4.2. Mean values (standard deviations in parenthesis) of soil water chemical<br />
variables and water tables in the different vegetation communities. The mean<br />
values followed by a different letter within a row were significantly different at P <<br />
0.05 based on ANOVA and Tukey test (for SO 2- 4 and WTlow) or Kruskal-Wallis<br />
and Mann-Whitney tests (for pH and WThigh, when Levene’s test was significant).<br />
WThigh = high water table; WTlow = low water table.<br />
4.4.3 Ordination analyses<br />
The first CCA explained the bryophyte distribution. This CCA showed that high<br />
water table and pH were the only significant measured environmental variables<br />
explaining the bryophyte distribution (Figure 4.2). Axis 1 was mainly composed of<br />
a moisture gradient. S. auriculatum, Cladopodiella fluitans, S. cuspidatum and<br />
Campylopus atrovirens var. atrovirens were grouped together at the wettest end of<br />
the water table, whereas S. rubellum, Hypnum jutlandicum and M. anomala were<br />
located in the driest areas. Axis 2 was mostly composed of a pH gradient.<br />
Cephalozia spp. and K. pauciflora had their optimum at lower pH than the other<br />
53