Estimating Distributions of Counterfactuals with an Application ... - UCL
Estimating Distributions of Counterfactuals with an Application ... - UCL
Estimating Distributions of Counterfactuals with an Application ... - UCL

Create successful ePaper yourself
Turn your PDF publications into a flip-book with our unique Google optimized e-Paper software.
EFFECTS OF UNCERTAINTY ON COLLEGE CHOICE 401<br />
0.9<br />
1<br />
High School*<br />
College**<br />
0.8<br />
0.7<br />
Density(Returns)<br />
0.6<br />
0.5<br />
0.4<br />
0.3<br />
0.2<br />
0.1<br />
0<br />
-0.5 0 0.5 1 1.5 2 2.5<br />
Returns<br />
*f((PV c /PV h )-1|Choice=High School)<br />
**f((PV c<br />
/PV h<br />
)-1|Choice=College)<br />
PV<br />
1<br />
h = Σ a (1+0.03) a Y h,a<br />
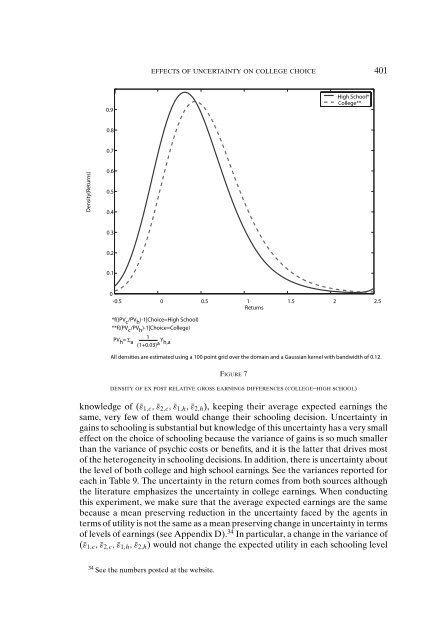
All densities are estimated using a 100 point grid over the domain <strong>an</strong>d a Gaussi<strong>an</strong> kernel <strong>with</strong> b<strong>an</strong>dwidth <strong>of</strong> 0.12.<br />
FIGURE 7<br />
DENSITY OF EX POST RELATIVE GROSS EARNINGS DIFFERENCES (COLLEGE–HIGH SCHOOL)<br />
knowledge <strong>of</strong> (¯ε 1,c , ¯ε 2,c , ¯ε 1,h , ¯ε 2,h ), keeping their average expected earnings the<br />
same, very few <strong>of</strong> them would ch<strong>an</strong>ge their schooling decision. Uncertainty in<br />
gains to schooling is subst<strong>an</strong>tial but knowledge <strong>of</strong> this uncertainty has a very small<br />
effect on the choice <strong>of</strong> schooling because the vari<strong>an</strong>ce <strong>of</strong> gains is so much smaller<br />
th<strong>an</strong> the vari<strong>an</strong>ce <strong>of</strong> psychic costs or benefits, <strong>an</strong>d it is the latter that drives most<br />
<strong>of</strong> the heterogeneity in schooling decisions. In addition, there is uncertainty about<br />
the level <strong>of</strong> both college <strong>an</strong>d high school earnings. See the vari<strong>an</strong>ces reported for<br />
each in Table 9. The uncertainty in the return comes from both sources although<br />
the literature emphasizes the uncertainty in college earnings. When conducting<br />
this experiment, we make sure that the average expected earnings are the same<br />
because a me<strong>an</strong> preserving reduction in the uncertainty faced by the agents in<br />
terms <strong>of</strong> utility is not the same as a me<strong>an</strong> preserving ch<strong>an</strong>ge in uncertainty in terms<br />
<strong>of</strong> levels <strong>of</strong> earnings (see Appendix D). 34 In particular, a ch<strong>an</strong>ge in the vari<strong>an</strong>ce <strong>of</strong><br />
(¯ε 1,c , ¯ε 2,c , ¯ε 1,h , ¯ε 2,h ) would not ch<strong>an</strong>ge the expected utility in each schooling level<br />
34 See the numbers posted at the website.