Sustainable Transportation and Grounds in UIC - University of ...
Sustainable Transportation and Grounds in UIC - University of ...
Sustainable Transportation and Grounds in UIC - University of ...
Create successful ePaper yourself
Turn your PDF publications into a flip-book with our unique Google optimized e-Paper software.
Report to <strong>UIC</strong> Chancellor’s Committee on Susta<strong>in</strong>ability <strong>and</strong> Energy<br />
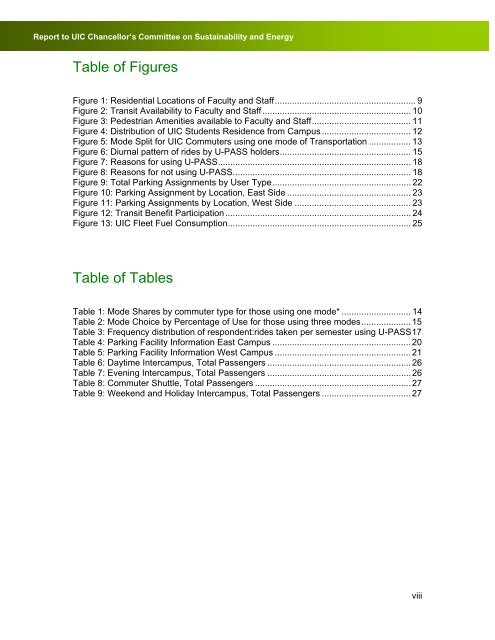
Table <strong>of</strong> Figures<br />
Figure 1: Residential Locations <strong>of</strong> Faculty <strong>and</strong> Staff ......................................................... 9<br />
Figure 2: Transit Availability to Faculty <strong>and</strong> Staff ............................................................ 10<br />
Figure 3: Pedestrian Amenities available to Faculty <strong>and</strong> Staff ........................................ 11<br />
Figure 4: Distribution <strong>of</strong> <strong>UIC</strong> Students Residence from Campus .................................... 12<br />
Figure 5: Mode Split for <strong>UIC</strong> Commuters us<strong>in</strong>g one mode <strong>of</strong> <strong>Transportation</strong> ................. 13<br />
Figure 6: Diurnal pattern <strong>of</strong> rides by U-PASS holders ..................................................... 15<br />
Figure 7: Reasons for us<strong>in</strong>g U-PASS .............................................................................. 18<br />
Figure 8: Reasons for not us<strong>in</strong>g U-PASS ........................................................................ 18<br />
Figure 9: Total Park<strong>in</strong>g Assignments by User Type ........................................................ 22<br />
Figure 10: Park<strong>in</strong>g Assignment by Location, East Side .................................................. 23<br />
Figure 11: Park<strong>in</strong>g Assignments by Location, West Side ............................................... 23<br />
Figure 12: Transit Benefit Participation ........................................................................... 24<br />
Figure 13: <strong>UIC</strong> Fleet Fuel Consumption .......................................................................... 25<br />
Table <strong>of</strong> Tables<br />
Table 1: Mode Shares by commuter type for those us<strong>in</strong>g one mode* ............................ 14<br />
Table 2: Mode Choice by Percentage <strong>of</strong> Use for those us<strong>in</strong>g three modes .................... 15<br />
Table 3: Frequency distribution <strong>of</strong> respondent:rides taken per semester us<strong>in</strong>g U-PASS 17<br />
Table 4: Park<strong>in</strong>g Facility Information East Campus ........................................................ 20<br />
Table 5: Park<strong>in</strong>g Facility Information West Campus ....................................................... 21<br />
Table 6: Daytime Intercampus, Total Passengers .......................................................... 26<br />
Table 7: Even<strong>in</strong>g Intercampus, Total Passengers .......................................................... 26<br />
Table 8: Commuter Shuttle, Total Passengers ............................................................... 27<br />
Table 9: Weekend <strong>and</strong> Holiday Intercampus, Total Passengers .................................... 27<br />
viii


