A Model of Regulated Open Access Resource Use
A Model of Regulated Open Access Resource Use
A Model of Regulated Open Access Resource Use

Create successful ePaper yourself
Turn your PDF publications into a flip-book with our unique Google optimized e-Paper software.
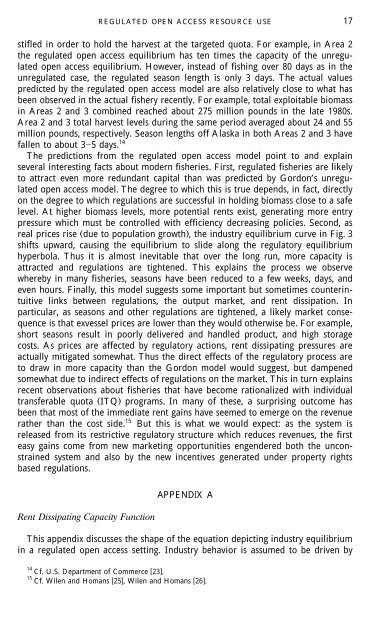
REGULATED OPEN ACCESS RESOURCE USE 17<br />
stifled in order to hold the harvest at the targeted quota. For example, in Area 2<br />
the regulated open access equilibrium has ten times the capacity <strong>of</strong> the unregulated<br />
open access equilibrium. However, instead <strong>of</strong> fishing over 80 days as in the<br />
unregulated case, the regulated season length is only 3 days. The actual values<br />
predicted by the regulated open access model are also relatively close to what has<br />
been observed in the actual fishery recently. For example, total exploitable biomass<br />
in Areas 2 and 3 combined reached about 275 million pounds in the late 1980s.<br />
Area 2 and 3 total harvest levels during the same period averaged about 24 and 55<br />
million pounds, respectively. Season lengths <strong>of</strong>f Alaska in both Areas 2 and 3 have<br />
fallen to about 35 days. 14<br />
The predictions from the regulated open access model point to and explain<br />
several interesting facts about modern fisheries. First, regulated fisheries are likely<br />
to attract even more redundant capital than was predicted by Gordon’s unregulated<br />
open access model. The degree to which this is true depends, in fact, directly<br />
on the degree to which regulations are successful in holding biomass close to a safe<br />
level. At higher biomass levels, more potential rents exist, generating more entry<br />
pressure which must be controlled with efficiency decreasing policies. Second, as<br />
real prices rise Ž due to population growth ., the industry equilibrium curve in Fig. 3<br />
shifts upward, causing the equilibrium to slide along the regulatory equilibrium<br />
hyperbola. Thus it is almost inevitable that over the long run, more capacity is<br />
attracted and regulations are tightened. This explains the process we observe<br />
whereby in many fisheries, seasons have been reduced to a few weeks, days, and<br />
even hours. Finally, this model suggests some important but sometimes counterintuitive<br />
links between regulations, the output market, and rent dissipation. In<br />
particular, as seasons and other regulations are tightened, a likely market consequence<br />
is that exvessel prices are lower than they would otherwise be. For example,<br />
short seasons result in poorly delivered and handled product, and high storage<br />
costs. As prices are affected by regulatory actions, rent dissipating pressures are<br />
actually mitigated somewhat. Thus the direct effects <strong>of</strong> the regulatory process are<br />
to draw in more capacity than the Gordon model would suggest, but dampened<br />
somewhat due to indirect effects <strong>of</strong> regulations on the market. This in turn explains<br />
recent observations about fisheries that have become rationalized with individual<br />
transferable quota Ž ITQ.<br />
programs. In many <strong>of</strong> these, a surprising outcome has<br />
been that most <strong>of</strong> the immediate rent gains have seemed to emerge on the revenue<br />
rather than the cost side. 15 But this is what we would expect: as the system is<br />
released from its restrictive regulatory structure which reduces revenues, the first<br />
easy gains come from new marketing opportunities engendered both the unconstrained<br />
system and also by the new incentives generated under property rights<br />
based regulations.<br />
Rent Dissipating Capacity Function<br />
APPENDIX A<br />
This appendix discusses the shape <strong>of</strong> the equation depicting industry equilibrium<br />
in a regulated open access setting. Industry behavior is assumed to be driven by<br />
14<br />
Cf. U.S. Department <strong>of</strong> Commerce 23 .<br />
15<br />
Cf. Wilen and Homans 25 , Wilen and Homans 26 .