A Model of Regulated Open Access Resource Use
A Model of Regulated Open Access Resource Use
A Model of Regulated Open Access Resource Use

Create successful ePaper yourself
Turn your PDF publications into a flip-book with our unique Google optimized e-Paper software.
8<br />
HOMANS AND WILEN<br />
equilibrium depicts the industry’s ‘‘choice’’ <strong>of</strong> a rent dissipating capacity, given the<br />
season length, and regulatory behavior is depicted as a choice <strong>of</strong> season length,<br />
given fishing capacity, the initial biomass, and the quota target established in the<br />
first stage.<br />
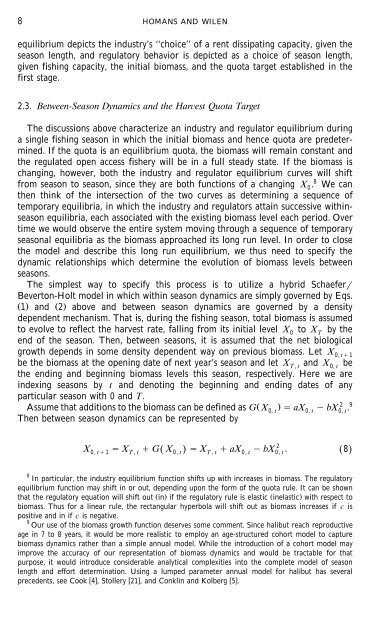
2.3. Between-Season Dynamics and the Harest Quota Target<br />
The discussions above characterize an industry and regulator equilibrium during<br />
a single fishing season in which the initial biomass and hence quota are predetermined.<br />
If the quota is an equilibrium quota, the biomass will remain constant and<br />
the regulated open access fishery will be in a full steady state. If the biomass is<br />
changing, however, both the industry and regulator equilibrium curves will shift<br />
from season to season, since they are both functions <strong>of</strong> a changing X 0. 8 We can<br />
then think <strong>of</strong> the intersection <strong>of</strong> the two curves as determining a sequence <strong>of</strong><br />
temporary equilibria, in which the industry and regulators attain successive withinseason<br />
equilibria, each associated with the existing biomass level each period. Over<br />
time we would observe the entire system moving through a sequence <strong>of</strong> temporary<br />
seasonal equilibria as the biomass approached its long run level. In order to close<br />
the model and describe this long run equilibrium, we thus need to specify the<br />
dynamic relationships which determine the evolution <strong>of</strong> biomass levels between<br />
seasons.<br />
The simplest way to specify this process is to utilize a hybrid Schaefer<br />
Beverton-Holt model in which within season dynamics are simply governed by Eqs.<br />
Ž. 1 and Ž. 2 above and between season dynamics are governed by a density<br />
dependent mechanism. That is, during the fishing season, total biomass is assumed<br />
to evolve to reflect the harvest rate, falling from its initial level X0 to XT<br />
by the<br />
end <strong>of</strong> the season. Then, between seasons, it is assumed that the net biological<br />
growth depends in some density dependent way on previous biomass. Let X 0, t1<br />
be the biomass at the opening date <strong>of</strong> next year’s season and let XT , t and X0, t be<br />
the ending and beginning biomass levels this season, respectively. Here we are<br />
indexing seasons by t and denoting the beginning and ending dates <strong>of</strong> any<br />
particular season with 0 and T.<br />
Ž .<br />
2 9<br />
Assume that additions to the biomass can be defined as G X0, t aX0, t bX 0, t.<br />
Then between season dynamics can be represented by<br />
X0, t1 XT, t GŽ X0, t. XT, taX0, t bX0, 2 t. Ž 8.<br />
8 In particular, the industry equilibrium function shifts up with increases in biomass. The regulatory<br />
equilibrium function may shift in or out, depending upon the form <strong>of</strong> the quota rule. It can be shown<br />
that the regulatory equation will shift out Ž in. if the regulatory rule is elastic Ž inelastic.<br />
with respect to<br />
biomass. Thus for a linear rule, the rectangular hyperbola will shift out as biomass increases if c is<br />
positive and in if c is negative.<br />
9 Our use <strong>of</strong> the biomass growth function deserves some comment. Since halibut reach reproductive<br />
age in 7 to 8 years, it would be more realistic to employ an age-structured cohort model to capture<br />
biomass dynamics rather than a simple annual model. While the introduction <strong>of</strong> a cohort model may<br />
improve the accuracy <strong>of</strong> our representation <strong>of</strong> biomass dynamics and would be tractable for that<br />
purpose, it would introduce considerable analytical complexities into the complete model <strong>of</strong> season<br />
length and effort determination. Using a lumped parameter annual model for halibut has several<br />
precedents, see Cook 4 , Stollery 21 , and Conklin and Kolberg 5 .