Get my PhD Thesis
Get my PhD Thesis
Get my PhD Thesis

You also want an ePaper? Increase the reach of your titles
YUMPU automatically turns print PDFs into web optimized ePapers that Google loves.
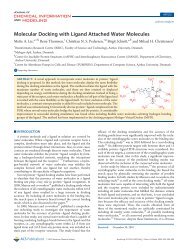
074103-14 Thøgersen et al. J. Chem. Phys. 123, 074103 2005<br />
TABLE V. The density of each iteration compared to the optimized one.<br />
Iteration D conv −D n S<br />
2<br />
a orb min conv,n<br />
2 66.952 673 0.0965<br />
3 65.174 713 0.0955<br />
4 56.502 973 0.0927<br />
5 51.210 143 0.1017<br />
6 48.482 773 0.1411<br />
7 42.682 641 0.1394<br />
8 35.617 332 0.1992<br />
9 26.551 913 0.3183<br />
10 18.298 431 0.4094<br />
11 14.152 342 0.4983<br />
12 9.767 169 0.6927<br />
13 6.184 621 0.6859<br />
14 3.844 299 0.9187<br />
15 2.240 436 0.9194<br />
16 1.018 810 0.9771<br />
17 0.200 374 0.9952<br />
18 0.064 181 0.9984<br />
19 0.043 906 0.9967<br />
20 0.011 531 0.9996<br />
21 0.001 092 0.9999<br />
22 0.000 309 0.9999<br />
23 0.000 053 0.9999<br />
24 0.000 009 0.9999<br />
25 0.000 000 0.9999<br />
2<br />
density matrix in the TRRH D n+1 −D¯ n S RH<br />
and TRDSM<br />
2<br />
D¯ n−D n S DSM<br />
steps. Remarkably, the TRDSM step consistently<br />
reduces the energy more than the TRRH step. Indeed,<br />
after iteration 15, each TRRH step increases rather<br />
than decreases the energy. Apparently, in the local region, the<br />
role of the TRRH step is reduced to that of improving that<br />
variational space of the subsequent TRDSM step. From the<br />
table, we also see that the largest changes in the density<br />
matrix are generated by the TRDSM step rather than by the<br />
TRRH step.<br />
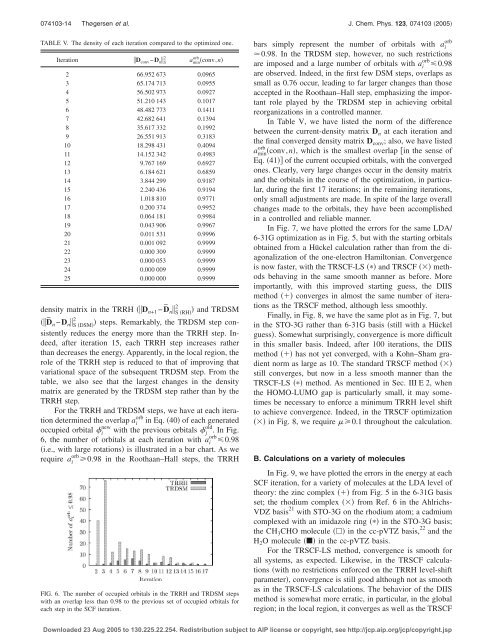
For the TRRH and TRDSM steps, we have at each iteration<br />
determined the overlap a orb i in Eq. 40 of each generated<br />
occupied orbital new i with the previous orbitals old j . In Fig.<br />
6, the number of orbitals at each iteration with a orb i 0.98<br />
i.e., with large rotations is illustrated in a bar chart. As we<br />
require a orb i 0.98 in the Roothaan–Hall steps, the TRRH<br />
FIG. 6. The number of occupied orbitals in the TRRH and TRDSM steps<br />
with an overlap less than 0.98 to the previous set of occupied orbitals for<br />
each step in the SCF iteration.<br />
orb<br />
bars simply represent the number of orbitals with a i<br />
0.98. In the TRDSM step, however, no such restrictions<br />
are imposed and a large number of orbitals with a orb i 0.98<br />
are observed. Indeed, in the first few DSM steps, overlaps as<br />
small as 0.76 occur, leading to far larger changes than those<br />
accepted in the Roothaan–Hall step, emphasizing the important<br />
role played by the TRDSM step in achieving orbital<br />
reorganizations in a controlled manner.<br />
In Table V, we have listed the norm of the difference<br />
between the current-density matrix D n at each iteration and<br />
the final converged density matrix D conv ; also, we have listed<br />
a orb min conv,n, which is the smallest overlap in the sense of<br />
Eq. 41 of the current occupied orbitals, with the converged<br />
ones. Clearly, very large changes occur in the density matrix<br />
and the orbitals in the course of the optimization, in particular,<br />
during the first 17 iterations; in the remaining iterations,<br />
only small adjustments are made. In spite of the large overall<br />
changes made to the orbitals, they have been accomplished<br />
in a controlled and reliable manner.<br />
In Fig. 7, we have plotted the errors for the same LDA/<br />
6-31G optimization as in Fig. 5, but with the starting orbitals<br />
obtained from a Hückel calculation rather than from the diagonalization<br />
of the one-electron Hamiltonian. Convergence<br />
is now faster, with the TRSCF-LS and TRSCF methods<br />
behaving in the same smooth manner as before. More<br />
importantly, with this improved starting guess, the DIIS<br />
method converges in almost the same number of iterations<br />
as the TRSCF method, although less smoothly.<br />
Finally, in Fig. 8, we have the same plot as in Fig. 7, but<br />
in the STO-3G rather than 6-31G basis still with a Hückel<br />
guess. Somewhat surprisingly, convergence is more difficult<br />
in this smaller basis. Indeed, after 100 iterations, the DIIS<br />
method has not yet converged, with a Kohn–Sham gradient<br />
norm as large as 10. The standard TRSCF method <br />
still converges, but now in a less smooth manner than the<br />
TRSCF-LS method. As mentioned in Sec. III E 2, when<br />
the HOMO-LUMO gap is particularly small, it may sometimes<br />
be necessary to enforce a minimum TRRH level shift<br />
to achieve convergence. Indeed, in the TRSCF optimization<br />
in Fig. 8, we require 0.1 throughout the calculation.<br />
B. Calculations on a variety of molecules<br />
In Fig. 9, we have plotted the errors in the energy at each<br />
SCF iteration, for a variety of molecules at the LDA level of<br />
theory: the zinc complex from Fig. 5 in the 6-31G basis<br />
set; the rhodium complex from Ref. 6 in the Ahlrichs-<br />
VDZ basis 21 with STO-3G on the rhodium atom; a cadmium<br />
complexed with an imidazole ring in the STO-3G basis;<br />
the CH 3 CHO molecule in the cc-pVTZ basis, 22 and the<br />
H 2 O molecule in the cc-pVTZ basis.<br />
For the TRSCF-LS method, convergence is smooth for<br />
all systems, as expected. Likewise, in the TRSCF calculations<br />
with no restrictions enforced on the TRRH level-shift<br />
parameter, convergence is still good although not as smooth<br />
as in the TRSCF-LS calculations. The behavior of the DIIS<br />
method is somewhat more erratic, in particular, in the global<br />
region; in the local region, it converges as well as the TRSCF<br />
Downloaded 23 Aug 2005 to 130.225.22.254. Redistribution subject to AIP license or copyright, see http://jcp.aip.org/jcp/copyright.jsp