Arrow Bowen GAs Project - Arrow Energy
Arrow Bowen GAs Project - Arrow Energy
Arrow Bowen GAs Project - Arrow Energy
Create successful ePaper yourself
Turn your PDF publications into a flip-book with our unique Google optimized e-Paper software.
CSG contains only trace quantities of sulfur and carbon<br />
monoxide (CO) which are not expected to be generated<br />
at concentrations that may be harmful to human health,<br />
therefore emissions of sulfur dioxide (SO 2 ) and CO were<br />
excluded from modelling.<br />
At the local level, NO 2 , volatile organic compounds (VOCs) and<br />
particulate matter are the key indicators of air quality impacts.<br />
These compounds were modelled at the local level assuming<br />
typical maximum emission rates and continuous power<br />
generation or flaring as a worst-case scenario. There were no<br />
significant impacts from VOCs or particulate matter, and the<br />
maximum predicted one-hour concentrations of NO 2 (inclusive<br />
of background concentrations) met the EPP (Air) objectives<br />
within close proximity of wellhead generators and production<br />
facilities. The EPP (Air) objectives were met between 1,100 m<br />
and 1,400 m of production facility emission sources, e.g., the<br />
exhaust stacks. Box 4 lists the key mitigation measures for<br />
protecting air quality.<br />
Box 4. Protecting Air Quality<br />
<strong>Arrow</strong> is committed to protecting the qualities of the<br />
air environment conducive to protecting the health and<br />
biodiversity of ecosystems; human health and wellbeing;<br />
and the aesthetics of the environment.<br />
The following key mitigation measures aim to ensure that<br />
the qualities of the air environment are maintained and<br />
relevant regulatory objectives are met:<br />
• Design facilities to meet relevant EPP (Air) objectives at<br />
sensitive receptors and conduct site-specific air quality<br />
modelling once site locations are known to ensure<br />
objectives are met.<br />
• Prevent venting and flaring of gas as far as practicable and<br />
where safe to do so, in accordance with the P&G Act.<br />
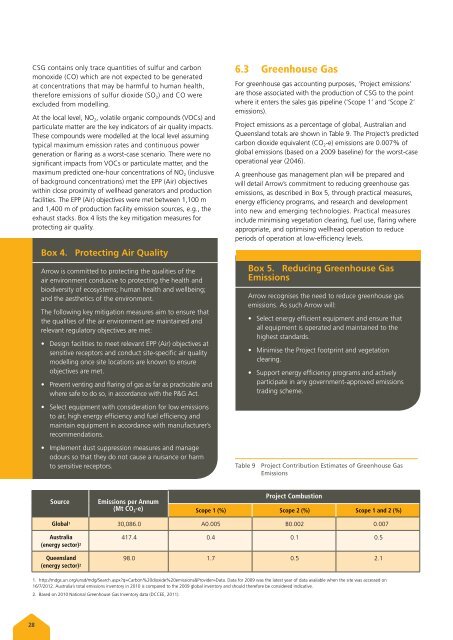
6.3 Greenhouse Gas<br />
For greenhouse gas accounting purposes, ‘<strong>Project</strong> emissions’<br />
are those associated with the production of CSG to the point<br />
where it enters the sales gas pipeline (‘Scope 1’ and ‘Scope 2’<br />
emissions).<br />
<strong>Project</strong> emissions as a percentage of global, Australian and<br />
Queensland totals are shown in Table 9. The <strong>Project</strong>’s predicted<br />
carbon dioxide equivalent (CO 2 -e) emissions are 0.007% of<br />
global emissions (based on a 2009 baseline) for the worst-case<br />
operational year (2046).<br />
A greenhouse gas management plan will be prepared and<br />
will detail <strong>Arrow</strong>’s commitment to reducing greenhouse gas<br />
emissions, as described in Box 5, through practical measures,<br />
energy efficiency programs, and research and development<br />
into new and emerging technologies. Practical measures<br />
include minimising vegetation clearing, fuel use, flaring where<br />
appropriate, and optimising wellhead operation to reduce<br />
periods of operation at low-efficiency levels.<br />
Box 5. Reducing Greenhouse Gas<br />
Emissions<br />
<strong>Arrow</strong> recognises the need to reduce greenhouse gas<br />
emissions. As such <strong>Arrow</strong> will:<br />
• Select energy efficient equipment and ensure that<br />
all equipment is operated and maintained to the<br />
highest standards.<br />
• Minimise the <strong>Project</strong> footprint and vegetation<br />
clearing.<br />
• Support energy efficiency programs and actively<br />
participate in any government-approved emissions<br />
trading scheme.<br />
• Select equipment with consideration for low emissions<br />
to air, high energy efficiency and fuel efficiency and<br />
maintain equipment in accordance with manufacturer’s<br />
recommendations.<br />
• Implement dust suppression measures and manage<br />
odours so that they do not cause a nuisance or harm<br />
to sensitive receptors.<br />
Table 9 <strong>Project</strong> Contribution Estimates of Greenhouse Gas<br />
Emissions<br />
Source<br />
Emissions per Annum<br />
(Mt CO 2 -e)<br />
<strong>Project</strong> Combustion<br />
Scope 1 (%) Scope 2 (%) Scope 1 and 2 (%)<br />
Global 1 30,086.0 A0.005 B0.002 0.007<br />
Australia<br />
417.4 0.4 0.1 0.5<br />
(energy sector) 2<br />
Queensland<br />
98.0 1.7 0.5 2.1<br />
(energy sector) 2<br />
1. http://mdgs.un.org/unsd/mdg/Search.aspx?q=Carbon%20dioxide%20emissions&Provider=Data. Data for 2009 was the latest year of data available when the site was accessed on<br />
16/7/2012. Australia’s total emissions inventory in 2010 is compared to the 2009 global inventory and should therefore be considered indicative.<br />
2. Based on 2010 National Greenhouse Gas Inventory data (DCCEE, 2011).<br />
28


