Annual Report 2004 - HL Display
Annual Report 2004 - HL Display
Annual Report 2004 - HL Display

You also want an ePaper? Increase the reach of your titles
YUMPU automatically turns print PDFs into web optimized ePapers that Google loves.
33<br />
Group Parent Company<br />
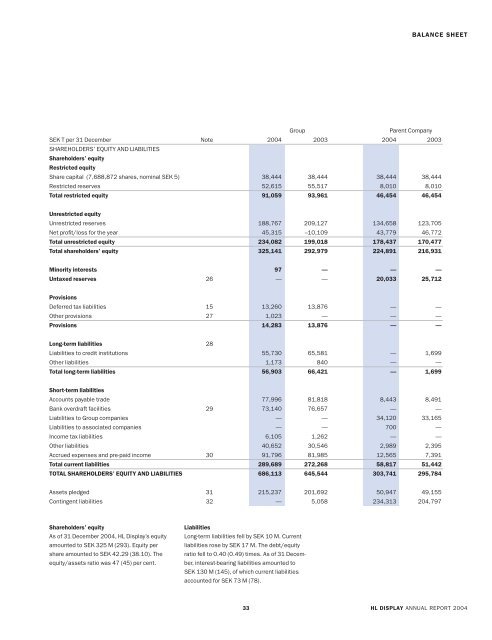
BALANCE SHEET<br />
SEK T per 31 December Note <strong>2004</strong> 2003 <strong>2004</strong> 2003<br />
SHAREHOLDERS’ EQUITY AND LIABILITIES<br />
Shareholders’ equity<br />
Restricted equity<br />
Share capital (7,688,872 shares, nominal SEK 5) 38,444 38,444 38,444 38,444<br />
Restricted reserves 52,615 55,517 8,010 8,010<br />
Total restricted equity 91,059 93,961 46,454 46,454<br />
Unrestricted equity<br />
Unrestricted reserves 188,767 209,127 134,658 123,705<br />
Net profit/loss for the year 45,315 –10,109 43,779 46,772<br />
Total unrestricted equity 234,082 199,018 178,437 170,477<br />
Total shareholders’ equity 325,141 292,979 224,891 216,931<br />
Minority interests 97 — — —<br />
Untaxed reserves 26 — — 20,033 25,712<br />
Provisions<br />
Deferred tax liabilities 15 13,260 13,876 — —<br />
Other provisions 27 1,023 — — —<br />
Provisions 14,283 13,876 — —<br />
Long-term liabilities 28<br />
Liabilities to credit institutions 55,730 65,581 — 1,699<br />
Other liabilities 1,173 840 — —<br />
Total long-term liabilities 56,903 66,421 — 1,699<br />
Short-term liabilities<br />
Accounts payable trade 77,996 81,818 8,443 8,491<br />
Bank overdraft facilities 29 73,140 76,657 — —<br />
Liabilities to Group companies — — 34,120 33,165<br />
Liabilities to associated companies — — 700 —<br />
Income tax liabilities 6,105 1,262 — —<br />
Other liabilities 40,652 30,546 2,989 2,395<br />
Accrued expenses and pre-paid income 30 91,796 81,985 12,565 7,391<br />
Total current liabilities 289,689 272,268 58,817 51,442<br />
TOTAL SHAREHOLDERS’ EQUITY AND LIABILITIES 686,113 645,544 303,741 295,784<br />
Assets pledged 31 215,237 201,692 50,947 49,155<br />
Contingent liabilities 32 — 5,058 234,313 204,797<br />
Shareholders’ equity<br />
As of 31 December <strong>2004</strong>, <strong>HL</strong> <strong>Display</strong>’s equity<br />
amounted to SEK 325 M (293). Equity per<br />
share amounted to SEK 42.29 (38.10). The<br />
equity/assets ratio was 47 (45) per cent.<br />
Liabilities<br />
Long-term liabilities fell by SEK 10 M. Current<br />
liabilities rose by SEK 17 M. The debt/equity<br />
ratio fell to 0.40 (0.49) times. As of 31 December,<br />
interest-bearing liabilities amounted to<br />
SEK 130 M (145), of which current liabilities<br />
accounted for SEK 73 M (78).<br />
<strong>HL</strong> DISPLAY ANNUAL REPORT <strong>2004</strong>