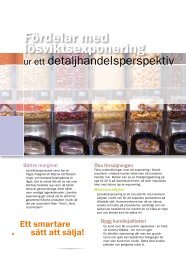
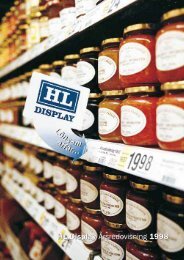
Annual Report 2004 - HL Display
Annual Report 2004 - HL Display
Annual Report 2004 - HL Display

Create successful ePaper yourself
Turn your PDF publications into a flip-book with our unique Google optimized e-Paper software.
Cash flow statement<br />
35<br />
CASH FLOW STATEMENT<br />
Group Parent Company<br />
SEK T Note <strong>2004</strong> 2003 <strong>2004</strong> 2003<br />
OPERATING ACTIVITIES<br />
Operating profit/loss 80,334 –3,888 –33,860 –31,169<br />
Depreciation 46,460 47,556 1,437 2,197<br />
Other items not effecting the cash flow 4,112 20,010 — 10<br />
Dividends and Group contribution received — — 90,579 83,058<br />
Interest received 2,339 3,130 5,710 6,136<br />
Interest paid –8,487 – 6,839 –1,073 –1,224<br />
Income tax paid –11,195 – 24,151 — –10,655<br />
Cash flow before change in working capital 113,563 35,818 62,793 48,353<br />
Increase (–) / decrease (+) inventories 12,655 – 14,343 — —<br />
Increase (–) / decrease (+) in accounts receivables –43,789 – 310 — 4<br />
Increase (–) / decrease (+) in other short-term receivables –4,498 564 –5,732 –8,193<br />
Increase (+) / decrease (–) accounts payable –3,822 13,480 –48 1,539<br />
Increase (+) / decrease (–) other current operating liabilities 20,833 9,261 –32,800 7,199<br />
Total cash flow from operating activities 94,942 44,470 24,213 48,902<br />
INVESTING ACTIVITIES<br />
Net investments in intangible fixed assets –558 – 1,404 –163 –314<br />
Net investments in tangible fixed assets –44,804 – 39,282 –181 –406<br />
Investments in Group companies — — –792 –7,944<br />
Investments in other financial assets –14 – 526 — —<br />
Cash flow from investment activities –45,376 – 41,212 –1,136 –8,664<br />
FINANCING ACTIVITIES<br />
New share issue 732 – 46 — –425<br />
Loans raised 5,089 9,484 — —<br />
Amortisation –23,798 – 3,149 –1,699 –29,615<br />
Dividend paid –12,687 – 12,687 –12,687 –12,687<br />
Cash flow from financing activities –30,664 – 6,398 –14,386 –42,727<br />
THE YEAR’S CASH FLOW 18,902 –3,140 8,691 –2,489<br />
Liquid assets at the beginning of the year 94,840 100,388 47,711 50,200<br />
Exchange rate difference on liquid assets –1,729 –2,408 — —<br />
Liquid assets at the end of the year 37 112,013 94,840 56,402 47,711<br />
Comments on the consolidated cash flow analysis<br />
For definitions, see page 49<br />
Cash flow from operating activities improved cash flow to the order of SEK 64 M. Cash flow<br />
to SEK 95 M (44), mainly due to the higher from investing activities fell to SEK –45 M (–41),<br />
operating profit. Other items not having an due to an increase in investments. Neverthe-<br />
effect on liquidity include write-downs/scrapless investments fell short of depreciation for<br />
ping of fixed assets to the order of SEK 1 M net. the year. Investments relate mainly to tangible<br />
A low level of income tax as a result of lower fixed assets, such as production equipment<br />
taxable profits in 2003 than in <strong>2004</strong> has had including tools for new products. New share<br />
a positive effect on cash flow. Tied-up working issue <strong>2004</strong> concerns minority capital contribu-<br />
capital fell and this had a positive effect on the tion in the Chinese subsidiary. Operating cash<br />
flow amounted to SEK 8.70 (4.12) per share.<br />
Cash flow from financing activities amounted to<br />
SEK –31 M (–6). The interest bearing net debt<br />
fell to SEK 18 M (50). The cash flow analysis<br />
was drawn up according to the indirect method.<br />
The cash flow reported only includes transactions<br />
that involved receipts or payments.<br />
<strong>HL</strong> DISPLAY ANNUAL REPORT <strong>2004</strong>