Vol.1 part 4-5 - Department of Invertebrate Zoology
Vol.1 part 4-5 - Department of Invertebrate Zoology
Vol.1 part 4-5 - Department of Invertebrate Zoology

Create successful ePaper yourself
Turn your PDF publications into a flip-book with our unique Google optimized e-Paper software.
III . RESULTS<br />
A. Sediments<br />
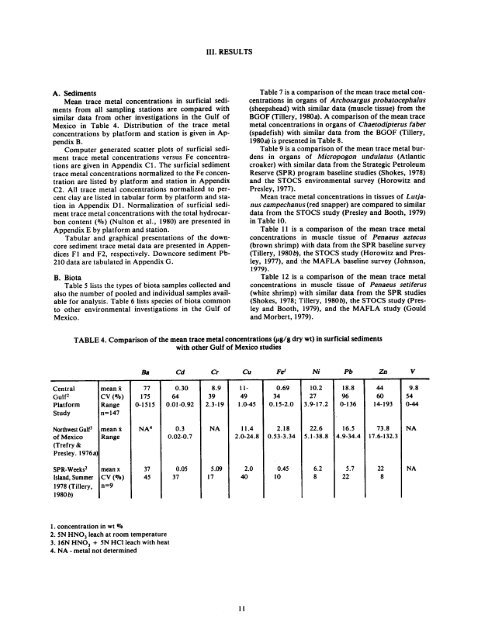
Mean trace metal concentrations in surficial sediments<br />
from all sampling stations are compared with<br />
similar data from other investigations in the Gulf <strong>of</strong><br />
Mexico in Table 4 . Distribution <strong>of</strong> the trace metal<br />
concentrations by platform and station is given in Appendix<br />
B .<br />
Computer generated scatter plots <strong>of</strong> surficial sediment<br />
trace metal concentrations versus Fe concentrations<br />
are given in Appendix C1 . The surficial sediment<br />
trace metal concentrations normalized to the Fe concentration<br />
are listed by platform and station in Appendix<br />
C2 . All trace metal concentrations normalized to percent<br />
clay are listed in tabular form by platform and station<br />
in Appendix D1 . Normalization <strong>of</strong> surficial sediment<br />
trace metal concentrations with the total hydrocarbon<br />
content (%) (Nulton et al ., 1980) are presented in<br />
Appendix E by platform and station .<br />
Tabular and graphical presentations <strong>of</strong> the downcore<br />
sediment trace metal data are presented in Appendices<br />
F1 and F2, respectively . Downcore sediment Pb-<br />
210 data are tabulated in Appendix G .<br />
B. Biota<br />
Table 5 lists the types <strong>of</strong> biota samples collected and<br />
also the number <strong>of</strong> pooled and individual samples available<br />
for analysis . Table 6 lists species <strong>of</strong> biota common<br />
to other environmental investigations in the Gulf <strong>of</strong><br />
Mexico .<br />
Table 7 is a comparison <strong>of</strong> the mean trace metal concentrations<br />
in organs <strong>of</strong> Archosargus pro6atocephalus<br />
(sheepshead) with similar data (muscle tissue) from the<br />
BGOF (Tillery, 1980a) . A comparison <strong>of</strong> the mean trace<br />
metal concentrations in organs <strong>of</strong> Chaetodipterus faber<br />
(spadefish) with similar data from the BGOF (Tillery,<br />
1980a) is presented in Table 8 .<br />
Table 9 is a comparison <strong>of</strong> the mean trace metal burdens<br />
in organs <strong>of</strong> Micropogon undulatus (Atlantic<br />
croaker) with similar data from the Strategic Petroleum<br />
Reserve (SPR) program baseline studies (Shokes, 1978)<br />
and the STOCS environmental survey (Horowitz and<br />
Presley, 1977) .<br />
Mean trace metal concentrations in tissues <strong>of</strong> Lutjanus<br />
campechanus (red snapper) are compared to similar<br />
data from the S'TOCS study (Presley and Booth, 1979)<br />
in Table 10 .<br />
Table 11 is a comparison <strong>of</strong> the mean trace metal<br />
concentrations in muscle tissue <strong>of</strong> Penaeus aztecus<br />
(brown shrimp) with data from the SPR baseline survey<br />
(Tillery, 19806), the STOCS study (Horowitz and Presley,<br />
1977), and the MAFLA baseline survey (Johnson,<br />
1979) .<br />
Table 12 is a comparison <strong>of</strong> the mean trace metal<br />
concentrations in muscle tissue <strong>of</strong> Penaeus setiferus<br />
(white shrimp) with similar data from the SPR studies<br />
(Shokes, 1978 ; Tillery, 19806), the STOCS study (Presley<br />
and Booth, 1979), and the MAFLA study (could<br />
and Morbert, 1979) .<br />
TABLE 4 .<br />
Comparison <strong>of</strong> the mean trace metal concentrations (ug/g dry wt) in surficial sediments<br />
with other Gulf <strong>of</strong> Mexico studies<br />
Ba Cd Cr Cu Fe' Ni Pb Zn V<br />
Central mean z 77 0.30 8.9 11- 0.69 10 .2 18 .8 44 9.8<br />
Gulf2 CV (070) 175 64 39 49 34 27 96 60 54<br />
Platform Range 0-1515 0 .01-0 .92 2 .3-19 1 .0-45 0 .15-2 .0 3 .9-17 .2 0-136 14-193 0-44<br />
Study n=147<br />
Northwest Gulf3 mean z NA ° 0 .3 NA 11 .4 2 .18 22 .6 16 .5 73 .8 NA<br />
<strong>of</strong> Mexico Range 0.02-0.7 2.0.24.8 0.53-3.34 5 .1-38.8 4.9-34.4 17 .6-132 .3<br />
(Trefry &<br />
Presley . 1976a)<br />
SPR-Weeks2 mean x 37 0 .05 5 .09 2 .0 0.45 6 .2 5 .7 22 NA<br />
Island, Summer CV (016) 45 37 17 40 10 8 22 8<br />
1978 (Tillery, n=9<br />
19806)<br />
1 . concentration in wt %<br />
2. SN HNO3 leach at room temperature<br />
3 . 16N HNO3 + SN HCI leach with heat<br />
4 . NA - metal not determined<br />
I1