Vol.1 part 4-5 - Department of Invertebrate Zoology
Vol.1 part 4-5 - Department of Invertebrate Zoology
Vol.1 part 4-5 - Department of Invertebrate Zoology

Create successful ePaper yourself
Turn your PDF publications into a flip-book with our unique Google optimized e-Paper software.
The test for independence is calculated as<br />
xz =E (0U - E4) 2/E4<br />
u<br />
where OU is the observed number <strong>of</strong> items in row i, column<br />
j . The test statistic follows an approximate chisquare<br />
distribution with degrees <strong>of</strong> freedom equal to the<br />
number <strong>of</strong> rows less one times the number <strong>of</strong> columns<br />
less one .<br />
For the factor <strong>of</strong> age, a x2 <strong>of</strong> 2 .98 with 4 degrees<br />
<strong>of</strong> freedom was calculated . The tabled value at the<br />
5-percent level is 9 .49 for 4 degrees <strong>of</strong> freedom, and the<br />
results are clearly not significant . The conclusion is,<br />
then, that no relationship can be assigned between platform<br />
age and pollution level .<br />
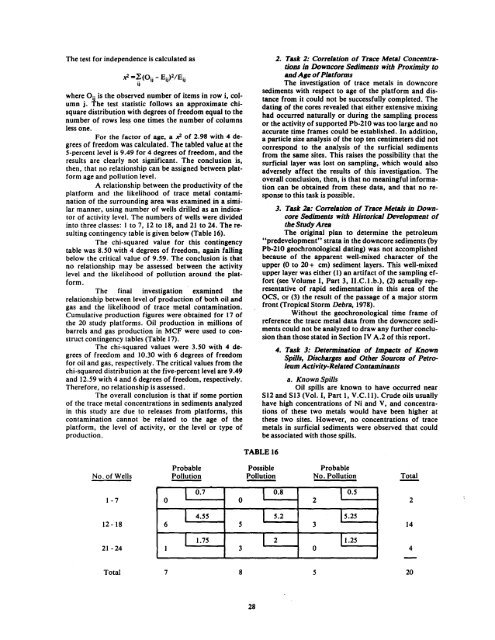
A relationship between the productivity <strong>of</strong> the<br />
platform and the likelihood <strong>of</strong> trace metal contamination<br />
<strong>of</strong> the surrounding area was examined in a similar<br />
manner, using number <strong>of</strong> wells drilled as an indicator<br />
<strong>of</strong> activity level . The numbers <strong>of</strong> wells were divided<br />
into three classes : 1 to 7, 12 to 18, and 21 to 24 . The resulting<br />
contingency table is given below (Table 16) .<br />
The chi-squared value for this contingency<br />
table was 8 .50 with 4 degrees <strong>of</strong> freedom, again falling<br />
below the critical value <strong>of</strong> 9 .59 . The conclusion is that<br />
no relationship may be assessed between the activity<br />
level and the likelihood <strong>of</strong> pollution around the platform<br />
.<br />
The final investigation examined the<br />
relationship between level <strong>of</strong> production <strong>of</strong> both oil and<br />
gas and the likelihood <strong>of</strong> trace metal contamination .<br />
Cumulative production figures were obtained for 17 <strong>of</strong><br />
the 20 study platforms . Oil production in millions <strong>of</strong><br />
barrels and gas production in MCF were used to construct<br />
contingency tables (Table 17) .<br />
The chi-squared values were 3 .50 with 4 degrees<br />
<strong>of</strong> freedom and 10 .30 with 6 degrees <strong>of</strong> freedom<br />
for oil and gas, respectively . The critical values from the<br />
chi-squared distribution at the five-percent level are 9 .49<br />
and 12.59 with 4 and 6 degrees <strong>of</strong> freedom, respectively .<br />
Therefore, no relationship is assessed .<br />
The overall conclusion is that if some portion<br />
<strong>of</strong> the trace metal concentrations in sediments analyzed<br />
in this study are due to releases from platforms, this<br />
contamination cannot be related to the age <strong>of</strong> the<br />
platform, the level <strong>of</strong> activity, or the level or type <strong>of</strong><br />
production .<br />
2 . Task 2 : Correlation <strong>of</strong> Trace Metal Concentradons<br />
is Downcore Sediments with Proximity to<br />
and Age <strong>of</strong> Platforms<br />
The investigation <strong>of</strong> trace metals in downcore<br />
sediments with respect to age <strong>of</strong> the platform and distance<br />
from it could not be successfully completed . The<br />
dating <strong>of</strong> the cores revealed that either extensive mixing<br />
had occurred naturally or during the sampling process<br />
or the activity <strong>of</strong> supported Pb-210 was too large and no<br />
accurate time frames could be established . In addition,<br />
a <strong>part</strong>icle size analysis <strong>of</strong> the top ten centimeters did not<br />
correspond to the analysis <strong>of</strong> the surficial sediments<br />
from the same sites . This raises the possibility that the<br />
surficial layer was lost on sampling, which would also<br />
adversely affect the results <strong>of</strong> this investigation . The<br />
overall conclusion, then, is that no meaningful information<br />
can be obtained from these data, and that no response<br />
to this task is possible .<br />
3. Task 2a : Correlation <strong>of</strong> Trace Metals in Downcore<br />
Sediments with Historical Development <strong>of</strong><br />
the Study Area<br />
The original plan to determine the petroleum<br />
"predevelopment" strata in the downcore sediments (by<br />
Pb-210 geochronological dating) was not accomplished<br />
because <strong>of</strong> the apparent well-mixed character <strong>of</strong> the<br />
upper (0 to 20+ cm) sediment layers . This well-mixed<br />
upper layer was either (1) an artifact <strong>of</strong> the sampling effort<br />
(see Volume I, Part 3, II .C .I .b .), (2) actually representative<br />
<strong>of</strong> rapid sedimentation in this area <strong>of</strong> the<br />
OCS, or (3) the result <strong>of</strong> the passage <strong>of</strong> a major storm<br />
front (Tropical Storm Debra, 1978) .<br />
Without the geochronological time frame <strong>of</strong><br />
reference the trace metal data from the downcore sediments<br />
could not be analyzed to draw any further conclusion<br />
than those stated in Section IV A .2 <strong>of</strong> this report .<br />
4. Task 3: Determination <strong>of</strong> Impacts <strong>of</strong> Known<br />
Spills, Discharges and Other Sources <strong>of</strong> Petroleum<br />
Activity-Related Contaminants<br />
a. Known Spills<br />
Oil spills are known to have occurred near<br />
S12 and S13 (Vol . I, Part 1, V.C .11) . Crude oils usually<br />
have high concentrations <strong>of</strong> Ni and V, and concentrations<br />
<strong>of</strong> these two metals would have been higher at<br />
these two sites . However, no concentrations <strong>of</strong> trace<br />
metals in surficial sediments were observed that could<br />
be associated with those spills .<br />
TABLE 16<br />
No . <strong>of</strong> Wells<br />
Probable<br />
Pollution<br />
Possible<br />
Probable<br />
Pollution No . Pollution<br />
Total<br />
1-7<br />
0<br />
0.7<br />
0<br />
0.8<br />
2<br />
0.5<br />
12-18<br />
21 - 24<br />
4 .55 5 .2 5 .25<br />
6 S 3<br />
1 .75 2 1 .25<br />
1 3 0<br />
14<br />
Total<br />
20<br />
28