Vol.1 part 4-5 - Department of Invertebrate Zoology
Vol.1 part 4-5 - Department of Invertebrate Zoology
Vol.1 part 4-5 - Department of Invertebrate Zoology

Create successful ePaper yourself
Turn your PDF publications into a flip-book with our unique Google optimized e-Paper software.
1981 - 13<br />
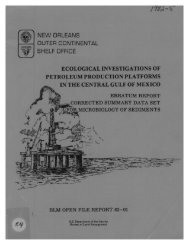
ECOLOGICAL INVESTIGATIONS OF<br />
PETROLEUM PRODUCTION PLATFORMS<br />
IN THE CENTRAL GULF OF MEXICO<br />
VOLUME-1-POLLUTANT FATE AND EFFECTS STUDIES<br />
Part 4-Trace Metals Studies in Sediment and Fauna<br />
Part 5-Microdiqlogy and Microbiological Processes<br />
\> Editor :<br />
C1 A . Bedinger, Jr .<br />
Igram Manager<br />
s<br />
t<br />
L+-~ ~\ ~ Editorial Assistant :<br />
--Laura Z .<br />
Kirby<br />
r l ` ~ - -=<br />
- - ~<br />
- - ---<br />
_ --<br />
-- _. - 1 -'-~-~---<br />
-_ --<br />
--- - -<br />
---- -<br />
SOUTHWEST RESEARCH INSTITUTE<br />
SAN ANTONIO<br />
HOUSTON
DISCLAIMER<br />
"This report has been reviewed by the Bureau <strong>of</strong> Land Management and approved for publication . Approval does<br />
not signify that the contents necessarily reflect the view and policies <strong>of</strong> the Bureau, nor does mention <strong>of</strong> trade names or<br />
commercial products constitute endorsement or recommendation for use ."<br />
This report is not available from the sponsor. A limited number <strong>of</strong> printed copies are available from Southwest Research Institute,<br />
2200 W . Loop South, Suite 690, Houston, Texas 77027, Attention : Dr . C.A . Hedinger, Jr. Photoatatic copies will be available from the<br />
National Technical Information Service .
ECOLOGICAL INVESTIGATIONS OF PETROLEUM<br />
PRODUCTION PLATFORMS IN THE<br />
CENTRAL GULF OF MEXICO<br />
Submitted to : ~ '<br />
Bureau <strong>of</strong> Land Management, New Or ,<br />
Attention : Frances Sullivan<br />
Hale Boggs Federal Buildin<br />
~.ursi~ .. ..a" '~b ir.. ..1 I.. . . ..~<br />
a nspCS-~~<br />
500 Camp Street, Suite 841<br />
New Orleans, Louisiana 7013~,,~ ~i<br />
'-<br />
--<br />
SwRI Project 01-5245<br />
In fulfillment <strong>of</strong> Contract<br />
AA551-CT8-17<br />
by :<br />
Southwest Research Institute<br />
6220 Culebra Road<br />
P.O . Drawer 28510<br />
San Antonio, Texas 78284<br />
1981
GUIDE TO USERS<br />
This report is in six separate bindings :<br />
1 VOLUME I -POLLUTANT FATE AND EFFECTS STUDIES<br />
Part 1 -Background, Program Organization and Study Plan<br />
Part 2 -Sediment Physical Characterization<br />
Part 3 -Organic Chemical Analyses<br />
2 VOLUME I -POLLUTANT FATE AND EFFECTS STUDIES<br />
Part 4 -Trace Metals Studies in Sediment and Fauna<br />
Part 5 -Microbiology and Microbiological Processes<br />
3 VOLUME I -POLLUTANT FATE AND EFFECTS STUDIES<br />
Part 6 -Benthic Biology<br />
Part 7 -Normal Histology and Histopathology <strong>of</strong> Benthic <strong>Invertebrate</strong>s<br />
and Demersal and Platform-Associated Pelagic Fishes<br />
4 VOLUME I -POLLUTANT FATE AND EFFECTS STUDIES<br />
Part 8 -Summary Data Set<br />
5 VOLUME II -THE ARTIFICIAL REEF STUDIES<br />
6 VOLUME III-EXECUTIVE SUMMARY<br />
CONTENTS OF THIS BINDING<br />
VOLUME I<br />
-POLLUTANT FATE AND EFFECT STUDIES<br />
Part 4 -Trace Metals Studies in Sediment and Fauna 1<br />
Part 5 -Microbiology and Microbiological Processes 123<br />
W
VOLUME I-POLLUTANT FATE AND EFFECTS STUDIES<br />
Part 4-Trace Metals Studies in Sediment and Fauna<br />
by<br />
John B . Tillery<br />
Principal Investigator<br />
Trace Metals<br />
Herbert L . Windon<br />
Consultant<br />
Trace Metals<br />
Richard E . Thomas<br />
Data Synthesis<br />
Trace Metals<br />
Southwest Research Institute<br />
De<strong>part</strong>ment <strong>of</strong> Environmental Sciences<br />
Division <strong>of</strong> Chemistry and<br />
Chemical Engineering<br />
P . O . Drawer 28510<br />
San Antonio, Texas 78284<br />
Skidaway Institute <strong>of</strong> Oceanography<br />
Savannah, Georgia<br />
Editor : C. A. Bedinger, Jr .<br />
Editorial Assistant : Laura Z . Kirby
TABLE OF CONTENTS<br />
I .<br />
II .<br />
Ill.<br />
IV .<br />
Page<br />
INTRODUCTION . . . . . . . . . . . . . . . . . . . . . . . . . . . . . . . . . . . . . . . . . . . . . . . . . . . . . . . . . . . . . . . . . . . . . . . . . . . . . . . . . . . . . . . . . . . . . . . . . . . . . . . . . . . . . . . 1<br />
A . Objectives <strong>of</strong> the Study . . . . . . . . . . . . . . . . . . . . . . . . . . . . . . . . . . . . . . . . . . . . . . . . . . . . . . . . . . . . . . . . . . . . . . . . . . . . . . . . . . . . . . . . . . . . . . . . . . 1<br />
B. Literature Review . . . . . . . . . . . . . . . . . . . . . . . . . . . . . . . . . . . . . . . . . . . . . . . . . . . . . . . . . . . . . . . . . . . . . . . . . . . . . . . . . . . . . . . . . . . . . . . . . . . . . . . . . 1<br />
C. Study Area and Sampling Sites . . . . . . . . . . . . . . . . . . . . . . . . . . . . . . . . . . . . . . . . . . . . . . . . . . . . . . . . . . . . . . . . . . . . . . . . . . . . . . . . . . . . . . . . 2<br />
MATERIALS AND METHODS . . . . . . . . . . . . . . . . . . . . . . . . . . . . . . . . . . . . . . . . . . . . . . . . . . . . . . . . . . . . . . . . . . . . . . . . . . . . . . . . . . . . . . . . . . . . . S<br />
A. Sample Collection and Preparation . . . . . . . . . . . . . . . . . . . . . . . . . . . . . . . . . . . . . . . . . . . . . . . . . . . . . . . . . . . . . . . . . . . . . . . . . . . . . . . . . . S<br />
1 . Sediments . . . . . . . . . . . . . . . . . . . . . . . . . . . . . . . . . . . . . . . . . . . . . . . . . . . . . . . . . . . . . . . . . . . . . . . . . . . . . . . . . . . . . . . . . . . . . . . . . . . . . . . . . . S<br />
a . Surficial Sediments. . . . . . . . . . . . . . . . . . . . . . . . . . . . . . . . . . . . . . . . . . . . . . . . . . . . . . . . . . . . . . . . . . . . . . . . . . . . . . . . . . . S<br />
(1) Partial Digestion . . . . . . . . . . . . . . . . . . . . . . . . . . . . . . . . . . . . . . . . . . . . . . . . . . . . . . . . . . . . . . . . . . . . . . .. . . . . . . . . S<br />
(2) Tote! Digestion . . . . . . . . . . . . . . . . . . . . . . . . . . . . . . . . . . . . . . . . . . . . . . . . . . . . . . . . . . . . . . . . . . . . . . . . . . . . . . . . . . . . S<br />
b. Downcore Sediments . . . . . . . . . . . . . . . . . . . . . . . . . . . . . . . . . . . . . . . . . . . . . . . . . . . . . . . . . . . . . . . . . . . . . . . . . . . . . . . . . . . . S<br />
(1) Trace Metal Analysis . . . . . . . . . . . . . . . . . . . . . . . . . . . . . . . . . . . . . . . . . . . . . . . . . . . . . . . . . . . . . . . . . . . . . . . . . . . . S<br />
(2) Downcore Dating . . . . . . . . . . . . . . . . . . . . . . . . . . . . . . . . . . . . . . . . . . . . . . . . . . . . . . . . . . . . . . . . . . . . . . . . . . . . . . . . . S<br />
2. 9iota . . . . . . . . . . . . . . . . . . . . . . . . . . . . . . . . . . . . . . . . . . . . . . . . . . . . . . . . . . . . . . . . . . . . . . . . . . . . . . . . . . . . . . . . . . . . . . . . . . . . . . . . . . . . . . . . . 6<br />
a. Collection . . . . . . . . . . . . . . . . . . . . . . . . . . . . . . . . . . . . . . . . . . . . . . . . . . . . . . . . . . . . . . . . . . . . . . . . . . . . . . . . . . . . . . . . . . . . . . . . . . 6<br />
b. Initial Preparation and Digestion. . . . . . . . . . . . . . . . . . . . . . . . . . . . . . . . . . . . . . . . . . . . . . . . . . . . . . . . . . . . . . . . . . . . . 6<br />
(i) Pelagic Fish . . . . . . . . . . . . . . . . . . . . . . . . . . . . . . . . . . . . . . . . . . . . . . . . . . . . . . . . . . . . . . . . . . . . . . . . . . . . . . . . . . . . . . . . 6<br />
(2) Macrcepifsuna and Demersal Fish . . . . . . . . . . . . . . . . . . . . . . . . . . . . . . . . . . . . . . . . . .. . . . . . . . . . . . . . . . . 6<br />
c . Preparation for Neutron Activation Analysis . . . . . . . . . . . . . . . . . . . . . . . . . . . . . . . . . . . . . . . . . . . . . . . . . . . . . . 7<br />
(1) Barium . . . . . . . . . . . . . . . . . . . . . . . . . . . . . . . . . . . . . . . . . . . . . . . . . . . . . . . . . . . . . . . . . . . . . . . . . . . . . . . . . . . . . . . . . . . . . . 7<br />
(2) Vanadium . . . . . . . . . . . . . . . . . . . . . . . . . . . . . . . . . . . . . . . . . . . . . . . . . . . . . . . . . . . . . . . . . . . . . . . . . . . . . . . . . . . . . . . . . . 7<br />
(3) Hydrated Antimony Pentoxide (HAP) Column Preparation . . . . . . . . . . . . . . . . . . . . . . . . . . . 7<br />
B . Insuumeatation . . . . . . . . . . . . . . . . . . . . . . . . . . . . . . . . . . . . . . . . . . . . . . . . . . . . . . . . . . . . . . . . . . . . . . . . . . . . . . . . . . . . . . . . . . . . . . . . . . . . . . . . . . . 7<br />
1. Atomic Absorption Spectrophotametry. . . . . . . . . . . . . . . . . . . . . . . . . . . . . . . . . . . . . . . . . . . . . . . . . . . . . . . . . . . . . . . . . . . . . 7<br />
2. Neutron Activation Malysta. . . . . . . . . . . . . . . . . . . . . . . . . .. . . . . . . . . . . . . . . . . . . . . . . . . . . . . . . . . . . . . . . . . . . . . . . . . . . . . . . . . 7<br />
3. Lead-210. . . . . . . . . . . . . . . . . . . . . . . . . . . . . . . . . . . . . . . . . . . . . . . . . . . . . . . . . . . . . . . . . . . . . . . . . . . . . . . . . . . . . . . . . . . . . . . . . . . . . . . . . . . . 7<br />
C. Sample Analyses and Quality Control . . . . . . . . . . . . . . . . . . . . . . . . . . . . . . . . . . . . . . . . . . . . . . . . . . . . . . . . . . . . . . . . . . . . . . . . . . . . . . . 7<br />
1 . Sediments . . . . . . . . . . . . . . . . . . . . . . . . . . . . . . . . . . . . . . . . . . . . . . . . . . . . . . . . . . . . . . . . . . . . . . . . . . . . . . . . . . . . . . . . . . . . . . . . . . . . . . . . . . 7<br />
2. Biota. . . . . . . . . . . . . . . . . . . . . . . . . . . . . . . . . . . . . . . . . . . . . . . . . . . . . . . . . . . . . . . . . . . . . . . . . . . . . . . . . . . . . . . . . . . . . . . . . . . . . . . . . . . . . . . . . 9<br />
RESULTS. . . . . . . . . . . . . . . . . . . . . . . . . . . . . . . . . . . . . . . . . . . . . . . . . . . . . . . . . . . . . . . . . . . . . . . . . . . . . . . . . . . . . . . . . . . . . . . . . . . . . . . . . . . . . . . . . . . . . . . . . . 11<br />
A. Sediments . . . . . . . . . . . . . . . . . . . . . . . . . . . . . . . . . . . . . . . . . . . . . . . . . . . . . . . . . . . . . . . . . . . . . . . . . . . . . . . . . . . . . . . . . . . . . . . . . . . . . . . . . . . . . . . . . . 11<br />
B. Biota . . . . . . . . . . . . . . . . . . . . . . . . . . . . . . . . . . . . . . . . . . . . . . . . . . . . . . . . . . . . . . . . . . . . . . . . . . . . . . . . . . . . . . . . . . . . . . . . . . . . . . . . . . . . . . . . . . . . . . . . . i l<br />
DISCUSSION . . . . . . . . . . . . . . . . . . . . . . . . . . . . . . . . . . . . . . . . . . . . . . . . . . . . . . . . . . . . . . . . . . . . . . . . . . . . . . . . . . . . . . . . . . . . . . . . . . . . . . . . . . . . . . . . . . . . . 21<br />
A. Sediments . . . . . . . . . . . . . . . . . . . . . . . . . . . . . . . . . . . . . . . . . . . . . . . . . . . . . . . . . . . . . . . . . . . . . . . . . . . . . . . . . . . . . . . . . . . . . . . . . . . . . . . .. . . . . . . . . . 21<br />
1 . Surficial Sediments. . . . . . . . . . . . . . . . . . . . . . . . . . . . . . . . . . . . . . . . . . . . . . . . . . . . . . . . . . . . . . . . . . . . . . . . . . . . . . . . . . . . . . . . . . . . . . . 21<br />
a. Physical Influence <strong>of</strong> Platforms on Sediment Metal Concentrations . . . . . . . . . . . . . . . . . . . . . . . . . 21<br />
b. Percent Clay Fraction Transformation . . . . . . . . . . . . . . . . . . . . . . . . . . . . . . . . . . . . . . . . . . . . . . . . . . . . . . . . . . . . . . 21<br />
c. Leachable Iron Transformation . . . . . . . . . . . . . . . . . . . . . . . . . . . . . . . . . . . . . . . . . . . . . . . . . . . . . . . . . . . . . . . . . . . . . . . 21<br />
(1) Barium/Iron Ratios. . . . . . . . . . . . . . . . . . . . . . . . . . . . . . . . . . . . . . . . . . . . . . . . . . . . . . . . . . . . . . . . . . . . . . . . . . . . . . 22<br />
(2) Cadmium/Iron Ratios. . . . . . . . . . . . . . . . . . . . . . . . . . . . . . . . . . . . . . . . . . . . . . . . . . . . . . . . . . . . . . . . . . . . . . . . . . . 22<br />
(3) Chromium/Iron Ratios . . . . . . . . . . . . . . . . . . . . . . . . . . . . . . . . . . . . . . . . . . . . . . . . . . . . . . . . . . . . . . . . . . . . . . . . . 22<br />
(4) Copper/Iron Ratios. . . . . . . . . . . . . . . . . . . . . . . . . . . . . . . . . . . . . . . . . . . . . . . . . . . . . . . . . . . . . . . . . . . . . . . . . . . . . . 22<br />
(S) Lead/Iron Ratios . . . . . . . . . . . . . . . . . . . . . . . . . . . . . . . . . . . . . . . . . . . . . . . . . . . . . . . . . . . . . . . . . . . . . . . . . . . . . . . . . 22<br />
(6) Nickel/Iron Retios . . . . . . . . . . . . . . . . . . . . . . . . . . . . . . . . . . . . . . . . . . . . . . . . . . . . . . . . . . . . . . . . . . . . . . . . . . . . . . . 22<br />
(7) Vanadium/Iron Ratios . . . . . . . . . . . . . . . . . . . . . . . . . . . . . . . . . . . . . . . . . . . . . . . . . . . . . . . . . . . . . . . . . . . . . . . . . . 22<br />
(8) Zinc/Iron Ratios. . . . . . . . . . . . . . . . . . . . . . . . . . . . . . . . . . . . . . . . . . . . . . . . . . . . . . . . . . . . . . . . . . . . . . . . . . . . . . . . . . 22<br />
2. Downcore Sediments . . . . . . . . . . . . . . . . . . . . . . . . . . . . . . . . . . . . . . . . . . . . . . . . . . . . . . . . . . . . . . . . . . . . . . . . . . . . . . . . . . . . . . . . . . . . 23<br />
a. Geochronological Dating 6yl,esd-210Method. . . . . . . . . . . . . . . . . . . . . . . . . . . . . . . . . . . . . . . . . : . . . . . . . . . . 23<br />
b. Trace Metals Analyses. . . . . . . . . . . . . . . . . . . . . . . . . . . . . . . . . . . . . . . . . . . . . . . . . . . . . . . . . . . . . . . . . . . . . . . . . . . . . . . . . . . 23<br />
B. Biota. . . . . . . . . . . . . . . . . . . . . . . . . . . . . . . . . . . . . . . . . . . . . . . . . . . . . . . . . . . . . . . . . . . . . . . . . . . . . . . . . . . . . . . . . . . . . . . . . . . . . . . . . . . . . . . . . . . . . . . . . 23<br />
1 . Archosargus probataxp6alus . . . . . . . . . . . . . . . . . . . . . . . . . . . . . . . . . . . . . . . . . . . . . . . . . . . . . . . . . . . . . . . . . . . . . . . . . . . . . . . . . ?.i<br />
2. C6aetodipterus fs6er . . . . . . . . . . . . . . . . . . . . . . . . . . . . . . . . . . . . . . . . . . . . . . . . . . . . . . . . . . . . . . . . . . . . . . . . . . . . . . . . . . . . . . . . . . . . 24<br />
3. Micropogon undulatus . . . . . . . . . . . . . . . . . . . . . . . . . . . . . . . . . . . . . . . . . . . . . . . . . . . . . . . . . . . . . . . . . . . . . . . . . . . . . . . . . . . . . . . . . . 24<br />
4. Lutjanus campxhaaus . . . . . . . . . . . . . . . . . . . . . . . . . . . . . . . . . . . . . . . . . . . . . . . . . . . . . . . . . . . . . . . . . . . . . . . . . . . . . . . . . . . . . . . . . . 24<br />
S. Peuaeus aztecus and Penseus xtiferus. . . . . . . . . . . . . . . . . . . . . . . . . . . . . . . . . . . . . . . . . . . . . . . . . . . . . . . . . . . . . . . . . . . . . . . 25<br />
C. Evaluation <strong>of</strong> Species for Monitories <strong>of</strong> Trace Metal Pollution . . . . .. . . . . . . . . . . . . . . . . . . . . . . . . . . . . . . . . . . . . . . . . . 25<br />
D. Data Synt6esis. . . . . . . . . . . . . . . . . . . . . . . . . . . . . . . . . . . . . . . . . . . . . . . . . . . . . . . . . . . . . . . . . . . . . . . . . . . . . . . . . . . . . . . . . . . . . . . . . . . . . . . . . . . . . 25<br />
1 . Task 1: Correlation <strong>of</strong> Trace Metal Concentrations in Sediments and Biological Samples with<br />
Proximity to and Age <strong>of</strong> Platforms . . . . . . . . . . . . . . . . . . . . . . . . . . . . . . . . . . . . . . . . . . . . . . . . . . . . . . . . . . . . . . . . . . . . . . . . . . . 25<br />
2. Task 2: Correlation <strong>of</strong> Trace Metal Concentrations in Duwnoane Sed1hrents with Proximity to<br />
and Age <strong>of</strong> Platforms . . . . . . . . . . . . . . . . . . . . . . . . . . . . . . . . . . . . . . . . . . . . . . . . . . . . . . . . . . . . . . . . . . . . . . . . . . . . . . . . . . . . . . . . . . . . 28<br />
iii
TABLE OF CONTENTS (cont'd)<br />
3. Task Za : Correlation <strong>of</strong> Trace Metals in Downcore Sediments with Historical Development <strong>of</strong><br />
the Study Area . . . . . . . . . . . . . . . . . . . . . . . . . . . . . . . . . . . . . . . . . . . . . . . . . . . . . . . . . . . . . . . . . . . . . . . . . . . . . . . . . . . . . . . . . . . . . . . . . . . . 28<br />
4. Test 3: Determination <strong>of</strong> Impacts <strong>of</strong> Known Spills, Discharges and Other Sources <strong>of</strong> Petroleum<br />
Activity-Related Contaminants . . . . . . . . . . . . . . . . . . . . . . . . . . . . . . . . . . . . . . . . . . . . . . . . . . . . . . . . . . . . . . . . . . . . . . . . 28<br />
a . Known Spit/s. . . . . . . . . . . . . . . . . . . . . . . . . . . . . . . . . . . . . . . . . . . . . . . . . . . . . . . . . . . . . . . . . . . . . . . . . . . . . . . . . . . . . . . . . . . . . . . 28<br />
b. Discharges. . . . . . . . . . . . . . . . . . . . . . . . . . . . . . . . . . . . . . . . . . . . . . . . . . . . . . . . . . . . . . . . . . . . . . . . . . . . . . . . . . . . . . . . . . . . . . . . . . 29<br />
c. Other Sources <strong>of</strong> Trace Metal Contaminants. . . . . . . . . . . . . . . . . . . . . . . . . . . . . . . . . . . . . . , ., .,....., 29<br />
S. Task 4: Impact <strong>of</strong> Seafood Containing Elevated Trace Metal Concentration . . . . . . . . . . . . . . . . . . . . . . . 29<br />
E. Recommendations for Further Studies . . . . . . . . . . . . . . . . . . . . . . . . . . . . . . . . . . . . . . . . . . . . . . . . . . . . . . . . . . . . . . . . . . . . . . . . . . . . . . 30<br />
V. CONCLUSIONS . . . . . . . . . . . . . . . . . . . . . . . . . . . . . . . . . . . . . . . . . . . . . . . . . . . . . . . . . . . . . . . . . . . . . . . . . . . . . . . . . . . . . . . . . . . . . . . . . . . . . . . . . . . . . . . . . 31<br />
VI . ACKNOWLEDCSEMEN'I'5. . . . . . . . . . . . . . . . . . . . . . . . . . . . . . . . . . . . . . . . . . . . . . . . . . . . . . . . . . . . . . . . . . . . . . . . . . . . . . . . . . . . . . . . . . . . . . . . . . . . 33<br />
VII. LITERATURE CITED . . . . . . . . . . . . . . . . . . . . . . . . . . . . . . . . . . . . . . . . . . . . . . . . . . . . . . . . . . . . . . . . . . . . . . . . . . . . . . . . . . . . . . . . . . . . . . . . . . . . . . . . . 35<br />
VIII . PERSONAL COMMUNICATIONS . . . . . . . . . . . . . . . . . . . . . . . . . . . . . . . . . . . . . . . . . . . . . . . . . . . . . . . . . . . . . . . . . . . . . . . . . . . . . . . . . . . . . . . . 37<br />
APPENDICES<br />
APPENDIX A-Abbreviations used in this work . . . . . . . . . . . . . . . . . . . . . . . . . . . . . . . . . . . . . . . . . . . . . . . . . . . . . . . . . . . . . . . . . . . . . . . . . . . . . . . . 41<br />
APPENDIX B-Metal Concentrations in Surficial Sediments by Platform and Station in pg/g Dry Weight . . . . . . . 45<br />
APPENDIX Cl-Graph <strong>of</strong> Metal Concentration vs. Fe Concentration for SN HNO3 Leach <strong>of</strong> Surficial<br />
Sediments . . . . . . . . . . . . . . . . . . . . . . . . . . . . . . . . . . . . . . . . . . . . . . . . . . . . . . . . . . . . . . . . . . . . . . . . . . . . . . . . . . . . . . . . . . . . . . . . . . . . . . . . . . 59<br />
APPENDIX C2-Metal Concentrations vs Fe Concentrations from SN HN03 Leach <strong>of</strong> Surficisl Sediments by<br />
Platform and Station . . . . . . . . . . . . . . . . . . . . . . . . . . . . . . . . . . . . . . ., . . . . . . . . . . . . . . . . . . . . . . . . . . . . . . . . . . . . . . . . . . . . . . . . . . . . 69<br />
APPENDIX D-Metal Concentrations vs Percent Clay Content <strong>of</strong> Surficial Sediments . . . . . . . . . . . . . . . . . . . . . . . . . . . . . . . . 79<br />
APPENDIX E-Metal Concentration vs Hydrocarbon Concentration in Surflcial Sediments by Platform and<br />
Station . . . . . . . . . . . . . . . . . . . . . . . . . . . . . . . . . . . . . . . . . . . . . . . . . . . . . . . . . . . . . . . . . . . . . . . . . . . . . . . . . . . . . . . . . . . . . . . . . . . . . . . . . . . . . . . . 91<br />
APPENDIX Fl-Concentration <strong>of</strong> Trace Metals in Downcore Sediments. . . . . . . . . . . . . . . . . . . . . . . . . . . . . . . . . . . . . . . . . . . . . . . . . . 103<br />
APPENDIX F2-Concentration <strong>of</strong> Trace Metals in Downcore Sediments. . . . . . . . . . . . . . . . . . . . . . . . . . . . . . . . . . . . . . . . . . . . . . . . . . 107<br />
APPENDIX G-Downcore Sediment Pb-210 Data from Control Site 22 . . . . . . . . . . . . . . . : . . . . . . . . . . . . . . . . . . . . . . . . . . . . . ., . . . . 119<br />
Page<br />
iv
LIST OF FIGURES<br />
Figure<br />
Page<br />
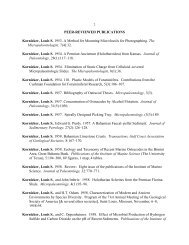
1 . Maps <strong>of</strong> the study area-(Top)Location <strong>of</strong> study area (Bottom) Study area showing sampling sites . . . . . . . . . . 3<br />
LIST OF TABLES<br />
Table<br />
Page<br />
1 . Instrument parameters-AAS . . . . . . . . . . . . . . . . . . . . . . . . . . . . . . . . . . . . . . . . . . . . . . . . . . . . . . . . . . . . . . . . . . . . . . . . . . . . . . . . . . . . . . . . . . . . . . . . . 8<br />
2 . Trace concentrations and percent recovery in NBS SRM 1645 River Sediment (fig/g dry wt) . . . . . . . . . . . . . . . . . . . . 9<br />
3 . Trace concentrations and percent recovery in NBS SRM 1577 Bovine Liver (mg/g dry wt). . . . . . . . . . . . . . . . . . . . . . 9<br />
4 . Comparison <strong>of</strong> the mean trace metal concentrations (Ng/g dry wt) in surficial sediments with other Gulf <strong>of</strong><br />
Mexico studies . . . . . . . . . . . . . . . . . . . . . . . . . . . . . . . . . . . . . . . . . . . . . . . . . . . . . . . . . . . . . . . . . . . . . . . . . . . . . . . . . . . . . . . . . . . . . . . . . . . . . . . . . . . . . . . . . . . . . 11<br />
S . Biota samples collected for trace metal analysis . . . . . . . . . . . . . . . . . . . . . . . . . . . . . . . . . . . . . . . . . . . . . . . . . . . . . . . . . . . . . . . . . . . . . . . . . . . 12<br />
6. Biota samples common to other Gulf <strong>of</strong> Mexico marine environmental studies . . . . . . . . . . . . . . . . . . . . . . . . . . . . . . . . . . . . 13<br />
7 . Comparison <strong>of</strong> trace metal concentrations (pg/g dry wt) in Archosargus probatocephalus (sheepshead)<br />
organs with other Gulf <strong>of</strong> Mexico studies . . . . . . . . . . . . . . . . . . . . . . . . . . . . . . . . . . . . . . . . . . . . . . . . . . . . . . . . . . . . . . . . . . . .'. . . . . . . . . . . . . . . 14<br />
8. Comparison <strong>of</strong> average trace metal concentrations (fig/g dry wt) in Chaetodipterus faber (spadefish)<br />
organs with other Gulf <strong>of</strong> Mexico studies . . . . . . . . . . . . . . . . . . . . . . . . . . . . . . . . . . . . . . . . . ., . . . . . . . . . . . . . . . . . . . . . . . . . . . . . . . . . . . . . . . . IS<br />
9. Comparison <strong>of</strong> average trace metal concentrations (jAg/g dry wt) in Micropogoa undulates (Croaker)<br />
organs with other Gulf <strong>of</strong> Mexico studies . . . . . . . . . . . . . . . . . . . . . . . . . . . . . . . . . . . . . . . . . . . . . . . . . . . . . . . . . . . . . . . . . . . . . . . . . . . . . . . . . . . 16<br />
10. Comparison <strong>of</strong> average trace metal concentrations (fig/g dry wt) in Lufjanus campechanus (Red Snapper)<br />
organs with other Gulf <strong>of</strong> Mexico studies . . . . . . . . . . . . . . . . . . . . . . . . . . . . . . . . . . . . . . . . . . . . . . . . . . . . . . . . . . . . . . . . . . . . . . . . . . . . . . . . . . . 17<br />
11 . Comparison <strong>of</strong> average trace metal concentrations (ug/g dry wt) in Penaeus aztecus (brown shrimp)<br />
organs with other Gulf <strong>of</strong> Mexico studies . . . . . . . . . . . . . . . . . . . . . . . . . . . . . . . . . . . . . . . . . . . . . . . . . . . . . . . . . . . . . . . . . . . . . . . . . . . . . . . . . . . 18<br />
12. Comparison <strong>of</strong> average trace metal concentrations (ug/g dry wt) in Penaeus sedferus (white shrimp)<br />
organs with other Gulf <strong>of</strong> Mexico studies . . . . . . . . . . . . . . . . . . . . . . . . . . . . . . . . . . . . . . . . . . . . . . . . . . . . . . . . . . . . . . . . . . . . . . . . . . . . . . . . . . . 19<br />
13 . Number <strong>of</strong> individuals which must be analyzed to detect a given percentage difference in Penaeus aztxus<br />
muscle tissue . . . . . . . . . . . . . . . . . . . . . . . . . . . . . . . . . . . . . . . . . . . . . . . . . . . . . . . . . . . . . . . . . . . . . . . . . . . . . . . . . . . . . . . . . . . . . . . . . . . . . . . . . . . . . . . . . . . . . . . 26<br />
14 . Number <strong>of</strong> individuals which must be analyzed to detect a given percentage difference in Micropogon<br />
undulates muscle tissue . . . . . . . . . . . . . . . . . . . . . . . . . . . . . . . . . . . . . . . . . . . . . . . . . . . . . . . . . . . . . . . . . . . . . . . . . . . . . . . . . . . . . . . . . . . . . . . . . . . . . . . . . 26<br />
IS . Chart . . . . . . . . . . . . . . . . . . . . . . . . . . . . . . . . . . . . . . . . . . . . . . . . . . . . . . . . . . . . . . . . . . . . . . . . . . . . . . . . . . . . . . . . . . . . . . . . . . . . . . . . . . . . . . . . . . . . . . . . . . . . . . . . 27<br />
16 . Chart . . . . . . . . . . . . . . . . . . . . . . . . . . . . . . . . . . . . . . . . . . . . . . . . . . . . . . . . . . . . . . . . . . . . . . . . . . . . . . . . . . . . . . . . . . . . . . . . . . . . . . . . . . . . . . . . . . . . . . . . . . . . . . . . 28<br />
17 . Chart . . . . . . . . . . . . . . . . . . . . . . . . . . . . . . . . . . . . . . . . . . . . . . . . . . . . . . . . . . . . . . . . . . . . . . . . . . . . . . . . . . . . . . . . . . . . . . . . . . . . . . . . . . . . . . . . . . . . . . . . . . . . . . . . 29
ABSTRACT<br />
In 1978 and 1979, a multidisciplinary study <strong>of</strong> the effects <strong>of</strong> <strong>of</strong>fshore petroleum production platforms on the marine<br />
environment was funded through the Bureau <strong>of</strong> Land Management and done by Southwest Research Institute . Twenty<br />
platforms in the Gulf <strong>of</strong> Mexico <strong>of</strong>fshore Louisiana and west <strong>of</strong> the Mississippi River delta were studied . Four Primary<br />
Platforms and four Control Sites were visited in each <strong>of</strong> three seasons; May 1978 (Cruise I), August-September 1978<br />
(Cruise II), and January 1979 (Cruise III), and 16 Secondary Platforms were sampled during Cruise II . Trace metal<br />
research examined surficial sediments, downcore sediments and selected biological samples collected up to 2000 m<br />
from these platforms . Concentrations <strong>of</strong> Cd, Cr, Cu, Fe, Ni, Pb, and Zn were determined in these samples by atomic<br />
absorption spectrophotometry ; Ba and V were determined by neutron activation analysis .<br />
Surficial sediment trace metal concentrations did not show strong evidence <strong>of</strong> contamination from the platforms .<br />
However, at 100 m <strong>of</strong> some platforms there were elevated concentrations <strong>of</strong> metals (Ba, Cr, Cu, Pb, and Zn) that were<br />
not related to natural geochemical processes. These elevated concentrations <strong>of</strong> metals were not correlated with the age<br />
<strong>of</strong> the platforms, the quantity <strong>of</strong> petroleum production, or the number <strong>of</strong> wells on the platforms. Sediment flow from<br />
the Mississippi River is thought to "mask" any trace metal sediment concentrations around the platforms.<br />
Unsuccessful attempts to determine the chronological age <strong>of</strong> downcore sediments by Pb-210 dating techniques are<br />
thought to be due to one or more <strong>of</strong> the following:<br />
(1) excessive levels <strong>of</strong> Ra-226 supported Pb-210<br />
(2) high sedimentation rates<br />
(3) sediment reworking<br />
(4) the possibility <strong>of</strong> sediment mixing during sample collection (piston coring) .<br />
Downcore sediment trace metal concentrations were relatively constant with depth . However, concentrations <strong>of</strong> Ba,<br />
Cd, and Zn showed an increase with depth .<br />
Concentrations <strong>of</strong> Cr, Cu, Fe, and Ni in sheepshead (Archosargus probatocephalus), spadefish (Chaetodipterus<br />
fa6er), and red snapper (Lu(janus campechanus) associated with the platform structures suggest a relationship with<br />
surficial sediment concentrations . No evidence <strong>of</strong> bioaccumulation was observed .<br />
vii
I . INTRODUCTION<br />
A. Objectives <strong>of</strong> the Study<br />
The Outer Continental Shelf (OCS) Environmental<br />
Studies Program <strong>of</strong> the Bureau <strong>of</strong> Land Management<br />
(BLM) was initiated in 1973 . The program was designed<br />
to provide information with which BLM and other governmental<br />
agencies could better assess the environmental<br />
impact <strong>of</strong> petroleum production on the OCS .<br />
The present study was a <strong>part</strong> <strong>of</strong> this program, and<br />
had the following overall objectives :<br />
(1) to establish the long-term fate and effects <strong>of</strong> pollutants<br />
associated with or derived from <strong>of</strong>fshore<br />
exploration and production platforms<br />
(2) to identify indicators <strong>of</strong> pollution which can be<br />
used in future monitoring or assessment studies<br />
(3) to provide information on the "artificial reef" effect<br />
<strong>of</strong> platform structures<br />
(4) to make specific recommendations to BLM for<br />
the design <strong>of</strong> future research efforts .<br />
The objectives <strong>of</strong> the trace metal portion <strong>of</strong> this<br />
study were :<br />
(1) to determine the concentrations <strong>of</strong> nine selected<br />
trace metals (Ba, Cd, Cr, Cu, Fe, Ni, Pb, V, Zn)<br />
in surficial and downcore sediments and biota<br />
samples collected in the vicinity <strong>of</strong> petroleum production<br />
structures and control sites<br />
(2) to determine if variations in concentrations can be<br />
related to petroleum production structures or activities<br />
(3) to determine if trace element concentrations in<br />
biota inhabiting the area around platform structures<br />
reflect bioaccumulation<br />
(4) to identify organisms that may be useful as possible<br />
indicators <strong>of</strong> metal pollution in the marine environment<br />
(5) to provide recommendations for future trace<br />
metal studies .<br />
B . Literature Review<br />
A number <strong>of</strong> studies have examined trace metal concentrations<br />
in sediments and biota <strong>of</strong> the Gulf <strong>of</strong> Mexico,<br />
but until recently none have addressed the specific<br />
objectives listed above . Of the recent studies with similar<br />
objectives, several have been <strong>part</strong> <strong>of</strong> the BLM OCS<br />
program but none have focused on the present study<br />
area .<br />
Trace metals studies on sediments <strong>of</strong> the Gulf <strong>of</strong><br />
Mexico OCS done prior to the more recent BLM OCS<br />
studies are described in Young (1954) ; Potter et al .<br />
(1963) ; Tiech et al . (1973) ; Holmes (1973) ; and Trefry<br />
and Presley (1976a, 19766) . With the exception <strong>of</strong> the<br />
work <strong>of</strong> Trefry and Presley these studies have primarily<br />
described the distribution <strong>of</strong> trace metals in surficial<br />
sediments and have not attempted to correlate distributions<br />
with anthropogenic inputs . Trefry and Presley<br />
(19'76a) more specifically addressed anthropogenic inputs<br />
and effects <strong>of</strong> dredging on trace metal redistribution<br />
.<br />
Trefry and Presley (19766) did the only investigation<br />
<strong>of</strong> sediment trace metals near the present study site .<br />
These authors found that the trace metal concentrations<br />
varied considerably from site to site due to variation in<br />
grain size and organic matter . However, when metal<br />
concentrations were normalized to iron the trace element<br />
composition was shown to represent a regional<br />
level <strong>of</strong> concentration based on sediment holding capacity<br />
. Deviations from these regionally constant ratios<br />
were interpreted as being the result <strong>of</strong> recent anthropogenic<br />
inputs . From analyses <strong>of</strong> nearshore and shelf sediments<br />
near the Mississippi River delta, Trefry and Presley<br />
(19766) concluded that over the past 25 to 30 years<br />
there has been a 60% increase in the Pb flux and a 100%<br />
increase in the Cd flux to the OCS sediments from the<br />
Mississippi River . Other metals (Co, Cr, Cu, Mn, Ni,<br />
and Zn) studied did not show a significantly increased<br />
influx to this region .<br />
Accumulations rates <strong>of</strong> sediments on the Louisiana<br />
shelf near the Mississippi River delta were determined<br />
by Shokes (1976) using Pb-210 dating techniques .<br />
Shokes concluded that sediments on the delta's contiguous<br />
continental slope accumulate at a rate less than 0 .1<br />
g/cm2 per year, whereas at the river mouth the rate is<br />
about 1 .5 g/cm2 per year . The sedimentation rates in the<br />
nearshore areas <strong>of</strong> the delta were too high (>2 g/cm2 per<br />
year) to be measured by the Pb-210 technique . The nearshore<br />
sedimentation rates are controlled by the terrigenous<br />
sediment fluxes while those farther <strong>of</strong>fshore (deep<br />
water) are apparently controlled by pelagic contributions<br />
(Shokes, 1976) .<br />
Several more recent studies, although not done on<br />
the Louisiana OCS, expanded understanding <strong>of</strong> trace<br />
metal concentrations and distributions in other Gulf <strong>of</strong><br />
Mexico OCS areas . As stated above, some <strong>of</strong> these were<br />
initiated as a <strong>part</strong> <strong>of</strong> the BLM OCS program and addressed<br />
some <strong>of</strong> the objectives <strong>of</strong> the present study .<br />
Investigations on the Mississippi, Alabama and Florida<br />
(MAFLA) outer continental shelf sponsored by<br />
BLM from 1977 to 1978 (Dames and Moore, 1979) provided<br />
information on the baseline concentrations <strong>of</strong> Al,<br />
Ba, Ca, Cd, Cr, Cu, Fe, Ni, Pb, V and Zn in sediments,<br />
suspended <strong>part</strong>iculate matter, epibenthos and demersal<br />
fish . At the time <strong>of</strong> these studies there were no significant<br />
anthropogenic inputs to this study area and no petroleum<br />
related activities . This study can, therefore, be<br />
used as a benchmark for comparison <strong>of</strong> trace metal concentrations<br />
from this area with those <strong>of</strong> other regions<br />
such as the Central Gulf OCS where petroleum production<br />
development is extensive .<br />
The BLM sponsored South Texas OCS study<br />
(STOCS) (Berryhill, 1979 ; Presley and Booth, 1979),<br />
conducted from 1974 to 1978, covered the continental<br />
shelf between San Antonio Bay to the north and the Rio<br />
Grande River on the south . Sediments and biota were<br />
analyzed for ten trace metals (Al, Ca, Cd, Cr, Cu, Fe,<br />
Ni, Pb, V, and ln) . Zooplankton, fish muscle, gill and<br />
liver tissue, and shrimp muscle and hepatopancreas tissue<br />
were analyzed . No significant differences in the annual<br />
mean trace metal concentrations <strong>of</strong> these samples<br />
were observed . There were significant differences in certain<br />
trace metal concentrations at different sampling<br />
stations but no consistent trends were noted . Sediments<br />
had elevated concentrations <strong>of</strong> Ba where exploratory
wells had been drilled and also showed elevated concentrations<br />
<strong>of</strong> Cd, Cr, Mn, Ni, V and Zn in areas <strong>of</strong> known<br />
gas seeps . Lead concentrations were lower in <strong>of</strong>fshore<br />
zooplankton samples but Cd concentrations were<br />
higher .<br />
The "Rig Monitoring Study" (White, Turgon, and<br />
Blizzard, 1977), a <strong>part</strong> <strong>of</strong> the MAFLA program, examined<br />
an <strong>of</strong>fshore drilling site prior to, during, and after<br />
drilling operations . Sediments and biota were analyzed<br />
for Ba, Cd, Cr, Cu, Fe, Ni, Pb, and V . Increased Ba<br />
concentrations were observed in bottom sediments both<br />
during and after drilling operations . Increases in Fe concentrations<br />
in epifauna were also observed but did not<br />
appear to be related to drilling activities ; resuspension<br />
<strong>of</strong> sediments due to the passage <strong>of</strong> a storm was a more<br />
probable causative factor .<br />
A study on the impact <strong>of</strong> oil production on marine<br />
ecology in Timbalier Bay, Louisiana and adjacent <strong>of</strong>fshore<br />
areas, entitled the Offshore Ecology Investigation<br />
(OEI), was done by the Gulf Universities Research Consortium<br />
(GURC) (Montalvo and Brady, 1974a, b; Williams<br />
and Jones, 1974 ; and Ward, Bender and Reish,<br />
1979) . Sediment and water samples were analyzed over a<br />
two-year period (1972-74) for 17 trace metals . Only Ba<br />
concentration in sediments were found to be unusually<br />
high, apparently related to the dumping <strong>of</strong> drilling muds<br />
containing barite . Arsenic, Cd, Hg, Pb and Zn concentrations<br />
in water samples from Timbalier Bay were<br />
higher than those <strong>of</strong> water sampled in the <strong>of</strong>fshore oil<br />
field . Concentrations <strong>of</strong> Cd, Pb and Zn in <strong>of</strong>fshore waters<br />
decreased with distance from the production platforms<br />
. Near bottom and surface water samples had<br />
higher Pb and Zn concentrations than mid-depth samples<br />
. A major conclusion <strong>of</strong> the study was that any effect<br />
the oil drilling operations had on the marine environment<br />
<strong>of</strong> Timbalier Bay and adjacent OCS was overshadowed<br />
by the sediment input from the Mississippi<br />
River .<br />
A four-year environmental study <strong>of</strong> the Buccaneer<br />
Gas/Oil Field (BGOF), funded through the National<br />
Oceanic and Atmospheric Administration by the Environmental<br />
Protection Agency, is presently being completed<br />
. This study is investigating the effect an active<br />
production platform has on the marine environment .<br />
The study site is located approximately 50 km SSE <strong>of</strong><br />
Galveston, Texas . Results from the second year (1977-<br />
78) <strong>of</strong> the study (Anderson and Schwarzer, 1979) indicate<br />
there are decreasing trace metal gradients in surficial<br />
sediments away from the platform structures . Elevated<br />
concentrations <strong>of</strong> Ba, Pb, Sr, and Zn were observed<br />
in surficial sediments within 180 m <strong>of</strong> the<br />
structures . Sediment cores had significantly higher concentrations<br />
<strong>of</strong> Ba, Hg, Pb, Sr, and Zn in the surficial<br />
layers as compared to the subsurface layers, indicating a<br />
recent increase in trace metal input to the sediments .<br />
Suspected sources <strong>of</strong> the trace metal concentrations are<br />
platform structures, corrosion, metal debris on the bottom,<br />
used drilling muds, and production water .<br />
Cluster analysis <strong>of</strong> sediment trace metal data from<br />
the first and second years <strong>of</strong> the BGOF study (Wheeler<br />
et al ., 1980) was performed using three different populations<br />
<strong>of</strong> control samples . There are limitations to this<br />
method <strong>of</strong> evaluating the data, but the authors' conclusions<br />
are that Ba, Cd, Co, Pb, and Sr are possible contaminants<br />
. The suggested sources included drilling muds<br />
(Ba), production water (Sr), corrosion <strong>of</strong> platform sacrificial<br />
electrodes or metallic debris on the sea floor (Cd,<br />
Co, Pb) and gasoline engines <strong>of</strong> recreational boats (Pb) .<br />
Sediment data from the third year <strong>of</strong> this study confirms<br />
earlier observations <strong>of</strong> metal concentration gradients<br />
decreasing away from the platforms (Tillery,<br />
1980a) . These gradients do not appear to be related to<br />
the hydrous iron fraction, grain size, or percent CaC03<br />
in the sediments . These results suggest that the metals<br />
(Ba, Cd, Cr, Cu, Mn, Pb, Sr, and Zn) are coming from<br />
the structures, activities on the platforms, or post-drilling<br />
operations .<br />
C. Study Area and Sampling Sites<br />
Louisiana <strong>of</strong>fshore oil fields occur in the region to<br />
the east and west <strong>of</strong> the Mississippi River delta . The<br />
present study area and locations <strong>of</strong> the petroleum production<br />
platforms and control sites visited are shown in<br />
Fig . 1 . Primary Platforms (P1-P4) were sampled for<br />
surficial sediments along a north-south and east-west<br />
transaxis at 100, 500, 1000, and 2000 m in three seasons :<br />
May, August/September, and January . Secondary Production<br />
Platforms (SS-S20) were sampled along a north<br />
axis at the same distance intervals as the Primary Platforms<br />
in August/September only . Control Sites (C21-<br />
C24) were located in lease-blocks where no prior petroleum<br />
exploration or production activities had taken<br />
place but which had physical characteristics and influences<br />
similar to the areas where Primary and Secondary<br />
Platforms were located . They were sampled each season<br />
.<br />
Fish and epifaunal samples were also collected at<br />
Primary, Secondary, and Control Sites . Diving, angling<br />
and trawling were all used in the collection <strong>of</strong> these samples<br />
. Demersal fish and macroepifauna were taken by<br />
trawls in the N500 to N2000 area except when lack <strong>of</strong><br />
sufficient organisms necessitated collection <strong>of</strong> platform<br />
species . Pelagic fish were taken at the platforms .<br />
All samples were analyzed for Ba, Cd, Cr, Cu, Fe,<br />
Ni, Pb, V, and Zn . Selected downcore sediments were<br />
analyzed for Pb-210 to obtain the chronological age and<br />
history <strong>of</strong> the sediments in the study area .
105' 100° 95° 90° 85° 80° 75`<br />
35°<br />
30° San Antonio Houston New , Or leans<br />
i<br />
Corpus Christi ~ O<br />
STUDY AREA<br />
Ft . Myars<br />
25 ./<br />
MEXICO<br />
~ n vana<br />
CVeq<br />
v<br />
YUCATAN<br />
SCALE<br />
I<br />
0 100 200<br />
Nautical Miles<br />
I 1 ~U 1 1 I<br />
Marsh I . r ~<br />
. I .<br />
30' q' a yf f,<br />
s r, 0<br />
B yaid y a ~ ~ ~<br />
0 0^ 0 ~ ~<br />
Pt Au Far ~S d~'<br />
a V U<br />
~ l 8<br />
C<br />
l 1<br />
"f/<br />
ti~ p y ~<br />
~ 21 5<br />
n<br />
(~ l~y<br />
Ca~io<br />
Terebonne<br />
. d Btry N z '<br />
zs°<br />
Timbalier Bay 12" ,<br />
.<br />
19 . .. _, X22<br />
24<br />
10<br />
18 20<br />
- F<br />
.` 11<br />
9 . . . F<br />
14<br />
-__________<br />
~- . .<br />
4<br />
3<br />
.l, _ . .<br />
6<br />
30' 16 23<br />
17<br />
--'<br />
'<br />
15 ---------------..<br />
----<br />
r<br />
0 PRIMARY SITES<br />
SECONDARY SITES<br />
;--92 'k 0 CONTROL SITES<br />
SCALE (kilometers)<br />
0 10 20 30 40<br />
FIG. 1 . Maps <strong>of</strong> the study area-(Top) Location <strong>of</strong> study area (Bottom) Study area showing sampling sites .<br />
3
II . MATERIALS AND METHODS<br />
A. Sample Collection and Preparation<br />
1 . Sediments<br />
a. Surficial Sediments<br />
Surficial sediment samples for trace metals<br />
analysis were collected with a stainless steel Smith-Mc-<br />
Intyre grab (Kahlsico Model 214WA250) . Subsamples<br />
were taken from the top S cm in an area away from the<br />
sides <strong>of</strong> the metallic sampler using a LexanO coring device<br />
(5 X 5 cm) . The subsample cores were placed in acidwashed<br />
polyethylene jars, labeled and kept frozen until<br />
preparation for analysis .<br />
Partial digestion was done on all sediment<br />
samples . On 25% <strong>of</strong> the sediment samples, a total digestion<br />
was also done .<br />
(1) Partial Digestion<br />
Sediment subsamples were removed from<br />
the freezer and allowed to thaw completely and equilibrate<br />
with room temperature. An acid-cleaned glass rod<br />
was used to thoroughly mix the wet sediment . Approximately<br />
60-80 g <strong>of</strong> the wet sediment was weighed into a<br />
fared polyethylene beaker and <strong>part</strong>icles 3 mm or larger<br />
in any dimension were removed using Teflon-coated<br />
forceps . The beaker was then covered with a thin sheet<br />
<strong>of</strong> tissue paper and placed in a drying oven (60 C) until<br />
the sediment reached a constant dry weight . The sample<br />
was reweighed to determine water loss then ground in a<br />
mortar and pestle and stored in an acid-cleaned polyethylene<br />
bottle .<br />
A 5-g aliquot <strong>of</strong> the dried sediment was<br />
weighed into a 250-m1 polyethylene, screw-cap, Erlenmeyer<br />
flask, and 25 ml <strong>of</strong> SN HN03 (redistilled) was<br />
added to the sample. The flask was sealed and placed on<br />
a mechanical shaker at low speed for 2 hrs . The sample<br />
was quantitatively transferred to a 50-m1 polyethylene<br />
centrifuge tube using three distilled water rinsings <strong>of</strong> the<br />
Erlenmeyer flask . The sample was then centrifuged at<br />
2500-3000 RPM for 20 min in order to separate suspended<br />
silica material from the leachate, thereby preventing<br />
an interference in the flame and flameless<br />
atomic absorption spectrophotometric (AAS) determination<br />
<strong>of</strong> the analyte metals . The leachate was quantitatively<br />
transferred to a 50-m1 polyethylene volumetric<br />
flask and brought to volume with distilled water . This<br />
leachate was used for metals analysis .<br />
(2) Total Digestion<br />
A 10-g subsample <strong>of</strong> the dried sediment<br />
(as prepared above for <strong>part</strong>ial digestion) was sieved<br />
through a 150 pin (100 mesh) stainless steel screen (ATM<br />
Corporation, Milwaukee, Wisconsin) using an ATM<br />
Sonic Sifter . Contamination <strong>of</strong> Cr, Fe, and Ni from the<br />
stainless steel screens was minimized by using new<br />
screens, washing and drying them thoroughly after each<br />
use, and by daily inspection for corrosion . A 5-g subsample<br />
<strong>of</strong> the preground, presieved sample was weighed<br />
into a 250-m1 Teflon beaker . Twenty-five ml <strong>of</strong> concentrated<br />
HCI was added to the sample and the beaker was<br />
covered with a Teflon watchglass . The sample was<br />
placed on a hot plate (90-100 C) for one hour to digest .<br />
Following the HCl digestion, the sample was allowed to<br />
cool on a clean bench and 15 ml <strong>of</strong> concentrated HN03<br />
was added . The beaker was then returned to the hot<br />
plate for another 45 min <strong>of</strong> heating (90-100 C) . The<br />
beaker was removed and allowed to cool before 25 ml <strong>of</strong><br />
48% HF was added to break down the crystalline lattice<br />
<strong>of</strong> the sediment . The sample was returned to the hot<br />
plate for a third time and heated for 2 hrs . After this<br />
final digestion, the sample was cooled and quantitatively<br />
transferred to a 50-m1 polyethylene volumetric<br />
flask . The beaker was rinsed three times with distilled<br />
water and the flask brought to volume with distilled<br />
water . Aliquots <strong>of</strong> this digest were repeatedly evaporated<br />
with HNO, to remove chlorine which would interfere<br />
with the neutron activation analysis (NAA) determination<br />
<strong>of</strong> V .<br />
b. Downcore Sediments<br />
Downcore sediments were collected using a<br />
1-m x 0.05-m piston coring device (Kahlisco Model<br />
217WA260) . Cores for trace metal analyses and Pb-210<br />
analyses were collected in polyethylene core liners .<br />
Cores were capped on both ends with PVC caps and frozen<br />
in a vertical position until prepared for analysis .<br />
(1) Trace Metal Analysis<br />
For trace metal analysis, the polyethylene<br />
core liner was split using a surgical saw with a stainless<br />
steel blade . The frozen core was split in half along its<br />
long axis with a stainless steel knife . Each half <strong>of</strong> the<br />
core was subdivided at 1 .0-cm intervals . Composite<br />
samples were made by combining ten adjacent 1 .0-cm<br />
cuts throughout the total length <strong>of</strong> the core . The composite<br />
samples were thoroughly homogenized with a<br />
Teflon spatula, placed into acid-washed polyethylene<br />
jars, labeled and later processed by the methodology described<br />
above for surf icial sediment .<br />
(2) Downcore Dating<br />
Downcore sediment samples for Pb-210<br />
analysis were prepared the same way as for trace metal<br />
analysis, but 0.5-cm cuts were used and no composites<br />
were made . Several grams <strong>of</strong> sediment from each 0.5-cm<br />
layer were dried for 3 hrs at 400 C to destroy the organic<br />
matter which could interfere with the extraction <strong>of</strong> lead<br />
for determination <strong>of</strong> Pb-210 . The organic content <strong>of</strong> the<br />
sediment was determined by the weight loss <strong>of</strong> the sediment<br />
. The residue was leached with 6N HCl by heating<br />
to near boiling for one hour then filtered . The leachate<br />
was evaporated to dryness and the residue was dissolved<br />
in 1 .5 N HCl . The hydrated silica was removed by centrifugation<br />
<strong>of</strong> the solution .<br />
Ten to 30 mg <strong>of</strong> stable lead in the form <strong>of</strong><br />
Pb-210-free nitrate solution was added to each dissolved<br />
sediment sample as a carrier . The solution was then<br />
passed through an anion exchange column (AG1-X1<br />
100-200 mesh resin) . The Pb-210 was precipitated as the<br />
sulfate by the addition <strong>of</strong> a saturated solution <strong>of</strong> sodium<br />
sulfate . The precipitate was dried at 100 C to a constant<br />
weight and mounted on a planchet for counting .
Lead-210 was determined by measuring<br />
the growth <strong>of</strong> the bismuth-210 (Bi-210) daughter (Beta<br />
<strong>of</strong> 1 .2 Mev) . The Bi-210 activity was determined utilizing<br />
a gas proportional anti-coincidence counting system<br />
. The system has a background <strong>of</strong> approximately 0 .5<br />
cpm and a counting efficiency <strong>of</strong> 30% for Bi-210 beta<br />
<strong>part</strong>icles . Final assays were made 20 to 40 days after the<br />
isolation <strong>of</strong> Pb-210 (i .e . to allow sufficient Bi-210<br />
growth) from the sediment samples .<br />
2. Biota<br />
a. Collection<br />
Fish and epifaunal samples were collected by<br />
diving, angling, and trawling . The proposed method <strong>of</strong><br />
obtaining pelagic fish attracted to the platforms was by<br />
angling, with emphasis on snappers and grouper . However,<br />
after little angling success on Cruise I, this was<br />
modified to include diving on a special "fishing"expedition,<br />
Cruise II-B . When "pelagic" fish were not angled,<br />
divers speared fish at platforms to meet the contract requirements<br />
for "pelagic" fish . Divers also collected attached<br />
bivalved mollusks to meet "epifauna" requirements<br />
when these were not met by trawling for epifauna<br />
and demersal fish .<br />
Equipment (fishhooks, spears, tongs, etc .)<br />
was <strong>of</strong> stainless steel whenever possible and rigorously<br />
cleaned plastic ; i .e ., acid-washed ice chest for temporary<br />
storage and uncoated nylon trawls and dive bags .<br />
Samples taken during diving went directly from the<br />
water into ice chests and those from trawls into a stainless<br />
steel sorting tray where they were immediately<br />
hand-sorted using acid-washed rubber gloves . Individual<br />
samples were then placed in prelabeled, acid-washed<br />
polyethylene bags and frozen . For both trace metals and<br />
hydrocarbons samples, care was taken to avoid contamination<br />
from on-deck equipment and activities by immediate<br />
processing in an established routine . Experience<br />
indicates two keys to avoiding on-deck contamination :<br />
maintaining the sample processing area upwind <strong>of</strong> engine,<br />
galley and other exhausts, and frequent washdown<br />
<strong>of</strong> everything with plenty <strong>of</strong> seawater .<br />
b .<br />
Initial Preparation and Digestion<br />
(1) Pelagic Fish<br />
On arrival at the onshore laboratory,<br />
transfer <strong>of</strong> custody documents was completed and all<br />
samples were inventoried according to the preprinted<br />
sample inventory form and stored in a walk-in freezer .<br />
For analysis, five individual sample specimens were<br />
thawed and dissected on a clean bench using Tefloncoated<br />
forceps and stainless steel surgical instruments .<br />
Tissues (flesh, gills, liver, and gonads) were removed<br />
and pooled in acid-washed, preweighed 250-m1 polyethylene<br />
beakers . Pooled samples were composed <strong>of</strong> individual<br />
organisms <strong>of</strong> approximately the same size and developmental<br />
stage which were collected from approximately<br />
the same area . During dissection procedures,<br />
separate instruments were used for separate species and<br />
tissue groups to avoid cross-contamination . Between<br />
use, all dissecting instruments were cleaned according to<br />
normal laboratory procedures then washed with O.1N<br />
nitric acid and rinsed with distilled water . Before dissection<br />
procedures began, all samples were rinsed with distilled<br />
water .<br />
The first dissection procedure was to<br />
open the visceral cavity from the gular region to the vent<br />
with stainless steel scissors . The alimentary system was<br />
snipped above the stomach and pulled from the abdominal<br />
cavity, mesenteries when necessary, exposing the<br />
liver and gonads (where developed) . This allowed for<br />
excision <strong>of</strong> the liver and gonads . The second dissection<br />
procedure involved removing filets <strong>of</strong> skeletal muscle<br />
from the lateral musculature. The epidermis and scales<br />
were removed and the muscles from both sides <strong>of</strong> the<br />
specimen were fileted with a stainless steel knife. The<br />
third dissection procedure was excision <strong>of</strong> the gills. The<br />
operculum was raised and the gill arches removed at the<br />
dorsal and ventral connections <strong>of</strong> the gill cavity with<br />
stainless steel scissors . Gills were collected from all specimens,<br />
whether the gonads were developed or not, as a<br />
backup for insufficient gonadal tissue . The entire gill<br />
structure-arches, rakers, and gill filaments-was analyzed<br />
.<br />
After the five specimens within a group<br />
were dissected, each tissue-liver, flesh, gonads, and<br />
gills-was placed in a pre-weighed 250-m1 beaker . The<br />
beakers were weighed to obtain wet weights <strong>of</strong> the tissues<br />
. Beakers were sealed with polyethylene sheets, frozen<br />
(0 C) and placed in a Labconco Model 75010 freeze<br />
dryer for 48 hrs . The freeze-dried samples were reweighed<br />
to determine water loss, then ground to ensure<br />
complete mixing <strong>of</strong> the sample in a Virtis "45" homogenizer<br />
(The Virtis Company, Inc ., Gardiner, New York)<br />
using stainless steel blades .<br />
The possibility <strong>of</strong> Cr, Fe, and Ni contamination<br />
<strong>of</strong> the samples through microcorrosion <strong>of</strong> the<br />
stainless steel blades was investigated by Tillery (1980x) .<br />
Shrimp tissues were prepared with the Virtis "45" homogenizer<br />
and were also ground with an agate mortar<br />
and pestle . No evidence <strong>of</strong> contamination was found .<br />
The finely ground samples (0.5 g) were<br />
weighed into tared PyrexO ashing boats and placed into<br />
a low temperature asher (LTA-505, LFE Corporation,<br />
Waltham, Massachusetts) . They were ashed for 16 hrs<br />
at 450 watts <strong>of</strong> forward power using an oxygen plasma .<br />
The asking boats were removed from the asher and 1 ml<br />
<strong>of</strong> 70% HN03 (Suprapur) was added to solubilize the<br />
ash and retain it in the asking boat during the transfer to<br />
a clean bench . The ash was quantitatively transferred<br />
into a Teflon bomb with distilled water and 3 ml <strong>of</strong> 70%<br />
HN03 (Suprapur) was added . The Teflon bomb was<br />
sealed and placed in a steam bath (90-110 C) for 2 hrs .<br />
The bomb was allowed to cool and the digestant was<br />
quantitatively rinsed into a 15-m1 polyethylene centrifuge<br />
tube using three rinsings (both cap and cylinder) <strong>of</strong><br />
distilled water . The sample was centrifuged for 10 min<br />
at 3000 RPM and the supernatant decanted into a 25-m1<br />
volumetric flask without disturbing the precipitate . The<br />
precipitate was rinsed with 2 ml <strong>of</strong> distilled water and recentrifuged<br />
for 10 min . This rinse was then decanted<br />
into the volumentric flask and brought to volume with<br />
distilled water . This solution was used to determine the<br />
different analyte metals using flame or flameless AAS<br />
and NAA . Concentrations <strong>of</strong> the different elements determined<br />
the method <strong>of</strong> AAS analysis . Aliquots were<br />
taken for Ba and V analyses by NAA .<br />
(2) Macroepifauna and Demersal Fish<br />
Pooled samples <strong>of</strong> macroepifauna and<br />
demersal fish were composed <strong>of</strong> individual organisms <strong>of</strong>
approximately the same size and developmental stage<br />
which were collected from approximately the same area .<br />
Organisms which had limited fleshy portions (
TABLE 1 . Instrument parameters - AAS<br />
Instrument<br />
Sample Type Parameters Cd Cr Cu Fe Ni P6 Zn<br />
Surficial Sediment wavelength (nm) 228.8 357 .9 324.7 248 .3 232 .0 283 .3 213.9<br />
(<strong>part</strong>ial & total) slit (nm) 0.7 0.7 0.7 OZ 0.2 0.7 0.7<br />
Downcores atomization HGA air/HZCZ air/HZCZ air/HZCZ air/HZCZ air/1-12c, air/H2C2<br />
00<br />
wavelength (nm) 228.8 357.9 324.7 248.3 232.0 283.3 213.9<br />
Paint Chips slit (nm) 0.7 0.7 0.7 0.2 0.2 0.7 0.7<br />
atomization' air/HZCZ air/HZCZ air/HZCZ air/HZCZ air/HZCZ air/HZCZ air/HZCZ<br />
Pelagic & Demersal wavelength (nm) 228.8 357.9 324.7 248.3 232.0 283.3 213.9<br />
Fish and Macro- slit (nm) 0.7 0.7 0.7 0.2 0.2 0.7 0.7<br />
crustacea Flesh atomization HGA HGA HGA air/HZCZ HGA HGA air/HZCZ<br />
Pelagic Fish : wavelength (nm) 228 .8 357.9 324.7 248 .3 232.0 283 .3 213 .9<br />
gills, gonads slit (run) 0.7 0.7 0.7 0.2 0.2 0.7 0.7<br />
and liver atomization HGA HGA HGA air/HZCZ HGA HGA air/HZCZ<br />
1 . Type <strong>of</strong> atomication: HGA = graphite furnace (flameless)<br />
air/HZCZ = air/acetylene (flame)
analyses . The standard reference sample used in this<br />
program was the National Bureau <strong>of</strong> Standards (NBS),<br />
Standard Reference Material 1645, River Sediments .<br />
Table 2 gives the results <strong>of</strong> our analyses <strong>of</strong> this reference<br />
material using the <strong>part</strong>ial digestion procedure previously<br />
described .<br />
Replicate analyses (7) <strong>of</strong> an actual surficial<br />
sediment sample gave the following variabilities<br />
(coefficient <strong>of</strong> variation in percent) : Ba, 22% ; Cd, 17% ;<br />
Cr, 13% ; Cu, 18% ; Fe, 9% ; Ni, 7% ; Pb, 18% ; Zn, 5% ;<br />
and V, 6% . For many <strong>of</strong> the metals the variability is<br />
greater than expected due to analytical precision and<br />
probably results from sample inhomogeneity .<br />
2. Biota<br />
Digested biota samples were analyzed by both<br />
AAS and NAA as described above for sediments . More<br />
flameless AAS analyses were required for the biota samples<br />
because <strong>of</strong> the low concentrations <strong>of</strong> analyte metals<br />
in the samples .<br />
Verification <strong>of</strong> the methodologies and quality assurance<br />
for the biota samples involved the analysis <strong>of</strong><br />
spiked, homogeneous tissues (shrimp muscle) and standard<br />
reference samples . National Bureau <strong>of</strong> Standards,<br />
Standard Reference Material 1577, Bovine Liver samples<br />
were routinely analyzed . Table 3 gives the results <strong>of</strong><br />
analysis <strong>of</strong> this NBS reference material .<br />
TABLE 2 . Trace concentrations and percent recovery in NBS SRM 1645 River Sedimentl(;Ag/g dry wt)<br />
Be Cd Crt Cu Fe' P6 Ni V Zn<br />
Reported -- 10 .2t1 .5 2.9610.28 109119 11 .311 .2 714128 45.812.9 -- 17201169<br />
Concentration<br />
Determined 20 .2 7 .23 2 .26 84 .2 3 .94 710 23 .6 ND' 1519<br />
Concentration<br />
% Recovery -- 71 76 77 35 99 52 -- 88<br />
i . by <strong>part</strong>ial digestion procedure<br />
2 . weight %<br />
3 . value not certified<br />
4 . not determined<br />
TABLE 3. Trace concentrations and percent recovery in NBS SRM 1577 Bovine Liver (mg/g dry wt)<br />
Ba Cd Cry Gti Fe Pb Nip V Za<br />
Reported -- 0.2710 .04 -- 193110 270120 0.34±0 .08 -- -- 130110<br />
Concentration<br />
Determined 4 .78 0 .43 1 .19 188 252 0 .31 0 .19 0 .90 138<br />
Concentration<br />
% Recovery -- 119 -- 97 93 91 -- -- 106<br />
1 . by <strong>part</strong>ial digestion procedure
III . RESULTS<br />
A. Sediments<br />
Mean trace metal concentrations in surficial sediments<br />
from all sampling stations are compared with<br />
similar data from other investigations in the Gulf <strong>of</strong><br />
Mexico in Table 4 . Distribution <strong>of</strong> the trace metal<br />
concentrations by platform and station is given in Appendix<br />
B .<br />
Computer generated scatter plots <strong>of</strong> surficial sediment<br />
trace metal concentrations versus Fe concentrations<br />
are given in Appendix C1 . The surficial sediment<br />
trace metal concentrations normalized to the Fe concentration<br />
are listed by platform and station in Appendix<br />
C2 . All trace metal concentrations normalized to percent<br />
clay are listed in tabular form by platform and station<br />
in Appendix D1 . Normalization <strong>of</strong> surficial sediment<br />
trace metal concentrations with the total hydrocarbon<br />
content (%) (Nulton et al ., 1980) are presented in<br />
Appendix E by platform and station .<br />
Tabular and graphical presentations <strong>of</strong> the downcore<br />
sediment trace metal data are presented in Appendices<br />
F1 and F2, respectively . Downcore sediment Pb-<br />
210 data are tabulated in Appendix G .<br />
B. Biota<br />
Table 5 lists the types <strong>of</strong> biota samples collected and<br />
also the number <strong>of</strong> pooled and individual samples available<br />
for analysis . Table 6 lists species <strong>of</strong> biota common<br />
to other environmental investigations in the Gulf <strong>of</strong><br />
Mexico .<br />
Table 7 is a comparison <strong>of</strong> the mean trace metal concentrations<br />
in organs <strong>of</strong> Archosargus pro6atocephalus<br />
(sheepshead) with similar data (muscle tissue) from the<br />
BGOF (Tillery, 1980a) . A comparison <strong>of</strong> the mean trace<br />
metal concentrations in organs <strong>of</strong> Chaetodipterus faber<br />
(spadefish) with similar data from the BGOF (Tillery,<br />
1980a) is presented in Table 8 .<br />
Table 9 is a comparison <strong>of</strong> the mean trace metal burdens<br />
in organs <strong>of</strong> Micropogon undulatus (Atlantic<br />
croaker) with similar data from the Strategic Petroleum<br />
Reserve (SPR) program baseline studies (Shokes, 1978)<br />
and the STOCS environmental survey (Horowitz and<br />
Presley, 1977) .<br />
Mean trace metal concentrations in tissues <strong>of</strong> Lutjanus<br />
campechanus (red snapper) are compared to similar<br />
data from the S'TOCS study (Presley and Booth, 1979)<br />
in Table 10 .<br />
Table 11 is a comparison <strong>of</strong> the mean trace metal<br />
concentrations in muscle tissue <strong>of</strong> Penaeus aztecus<br />
(brown shrimp) with data from the SPR baseline survey<br />
(Tillery, 19806), the STOCS study (Horowitz and Presley,<br />
1977), and the MAFLA baseline survey (Johnson,<br />
1979) .<br />
Table 12 is a comparison <strong>of</strong> the mean trace metal<br />
concentrations in muscle tissue <strong>of</strong> Penaeus setiferus<br />
(white shrimp) with similar data from the SPR studies<br />
(Shokes, 1978 ; Tillery, 19806), the STOCS study (Presley<br />
and Booth, 1979), and the MAFLA study (could<br />
and Morbert, 1979) .<br />
TABLE 4 .<br />
Comparison <strong>of</strong> the mean trace metal concentrations (ug/g dry wt) in surficial sediments<br />
with other Gulf <strong>of</strong> Mexico studies<br />
Ba Cd Cr Cu Fe' Ni Pb Zn V<br />
Central mean z 77 0.30 8.9 11- 0.69 10 .2 18 .8 44 9.8<br />
Gulf2 CV (070) 175 64 39 49 34 27 96 60 54<br />
Platform Range 0-1515 0 .01-0 .92 2 .3-19 1 .0-45 0 .15-2 .0 3 .9-17 .2 0-136 14-193 0-44<br />
Study n=147<br />
Northwest Gulf3 mean z NA ° 0 .3 NA 11 .4 2 .18 22 .6 16 .5 73 .8 NA<br />
<strong>of</strong> Mexico Range 0.02-0.7 2.0.24.8 0.53-3.34 5 .1-38.8 4.9-34.4 17 .6-132 .3<br />
(Trefry &<br />
Presley . 1976a)<br />
SPR-Weeks2 mean x 37 0 .05 5 .09 2 .0 0.45 6 .2 5 .7 22 NA<br />
Island, Summer CV (016) 45 37 17 40 10 8 22 8<br />
1978 (Tillery, n=9<br />
19806)<br />
1 . concentration in wt %<br />
2. SN HNO3 leach at room temperature<br />
3 . 16N HNO3 + SN HCI leach with heat<br />
4 . NA - metal not determined<br />
I1
TABLE S . Biota samples collected for trace metal analysis<br />
Number <strong>of</strong> Number <strong>of</strong><br />
Generic Name Common Name Pooled Samples Individuals<br />
Agriopoma texasiana clam 6 44<br />
Amusium papyraceum scallop 2 15<br />
Anadara ovalis oyster I 6<br />
Arca baughmani clam 1 S<br />
Archosargus probatocephalus sheepshead 11 54<br />
Arius fells catfish 3 15<br />
Callinectes sapidus blue crab 1 S<br />
Callinectes similis blue crab 1 16<br />
Centropristis philadelphica sea bass 3 17<br />
Chaetodipterus faber spadefish 18 97<br />
Citharichtyes spilopterus bay whiff 1 18<br />
Coryphaenus hipperus dolphin 1 S<br />
Crassostrea virginica oyster 3 22<br />
Cynoscion arenarius sea trout 2 10<br />
Diplectrum bivittatum perch 1 10<br />
Eutropus crossotus fringed flounder 1 10<br />
Lutjanus campechanus red snapper S 23<br />
Lutjanusgriseus grey snapper 1 S<br />
Lutjanus synagris lane snapper 1 4<br />
Macoma pulleyi clam 1 9<br />
Micropogon undulatus Atlantic croaker 11 69<br />
Ostrea equestris oyster 3 36<br />
Paranthias furcifer Creole 2 11<br />
Penaeus aztecus brown shrimp 12 76<br />
Penaeus setiferus white shrimp 2 10<br />
Squilla empusa squilla 2 23<br />
Syacium papillosum dusky flounder 1 8<br />
12
TABLE 6. Biota samples common to other Gulf <strong>of</strong> Mexico marine environmental studies<br />
Study/Species<br />
central<br />
Gulf<br />
Study<br />
(BLM)<br />
Strategic<br />
Petroleum<br />
1NAFLA Rid Reserve<br />
MAFLA Monitoring (SwRI)<br />
Stratcec<br />
Petroleum<br />
Reserve<br />
(SAI)<br />
Buccaneer<br />
Oilfidd<br />
Third Year<br />
Sheepshead<br />
Archosargus (11) X<br />
probatocephalus<br />
Spadefish<br />
Chaetodipterus (18) X<br />
faber<br />
Dusty flounder<br />
Syacium (1) X<br />
papillosum<br />
Croaker<br />
Micropogon (11) X<br />
undulatus<br />
Broken neck shrimp<br />
Trachypenaeus -- X X X<br />
constrictus<br />
Brown shrimp<br />
Penaeus (12) X X<br />
azteus<br />
White shrimp<br />
Penaeus (2) X X X<br />
setiferus<br />
Various species<br />
<strong>of</strong> shrimp -- X X<br />
Sugar shrimp<br />
Trachypenaeus -- X<br />
similis<br />
Squilla<br />
Squilla (2) X<br />
empusa<br />
() = number <strong>of</strong> pooled samples analyzed<br />
13
TABLE 7. Comparison <strong>of</strong> trace metal concentrations (ug/g dry wt) in Archosargus probatocephalus<br />
(sheepshead) organs with other Gulf <strong>of</strong> Mexico studies<br />
Study Organ Parameter' Ba Cd Cr Cu Fe Ni P6 V Zn<br />
Muscle z
TABLE 8 . Comparison <strong>of</strong> average trace metal concentrations (fig/g dry wt) in Chaetodipterus faber(spadefish)<br />
organs with other Gulf <strong>of</strong> Mexico studies<br />
Study Organ Parameter' Ba Cd Cr Cu Fe Ni Pb V Zn<br />
Muscle R
TABLE 9 . Comparison <strong>of</strong> average trace metal concentrations (fig/g dry wt) in Micropogon undulatus(Croaker)<br />
organs with other Gulf <strong>of</strong> Mexico studies<br />
Study Tissue Parameter' Ba Cd Cr Cu Fe Ni P6 V Za<br />
x
TABLE 10 . Comparison <strong>of</strong> average trace metal concentrations (fig/g dry wt) in Lutjanus campechanus (Red Snapper)<br />
organs with other Gulf <strong>of</strong> Mexico studies<br />
Study Tissue Parameter' Ba Cd Cr CU Fe Ni Pb V Zn<br />
x
TABLE 11 . Comparison <strong>of</strong> average trace metal concentrations (Ng/g dry wt) in Penaeus aztecus (brown shrimp)<br />
organs with other Gulf <strong>of</strong> Mexico studies<br />
STUDY PARAMETER' Ba Cd Cr Cu Fe Ni Pb V Zn<br />
x
TABLE 12 . Comparison <strong>of</strong> average trace metal concentrations (fig/g dry wt) in Penaeus setiferus (white shrimp)<br />
organs with other Gulf <strong>of</strong> Mexico studies<br />
STUDY LOCATION' SEASON PARAMETER Ha Cd Cr Cu Fe Ni P6 V Zo<br />
Louisiana Louisiana OCS A2 G21 .0 0.103 0.21 26 23 0.43 0.14 0.5 62<br />
Platform o -- 0.014 0 .02 3 24 0 .06 0.04 -- 1<br />
Study CV (%) -- 14 8 9 98 15 26 --<br />
n- 2(10)3<br />
SPR-<br />
12 1.6 0.11 0.17 34 41 1 .30 0.10 70<br />
SwRI W. Hutberry Summer o 1 .3 0.08 0.08 7 19 1 .01 0.01 NW 3<br />
1978-79 1978 CV (%) 81 76 .9 10 46 78 13<br />
Tillerys<br />
Yz 2 .0 037 0 .69 35 28 1 . 17 0 .29 43<br />
Works Island Winter o 1.7 0.32 0.41 S 10 0.99 0.28 ND 1<br />
1979 CV (X) 87 87 60 IS 35 83 97 3<br />
n- 7(61)<br />
G<br />
SPR-<br />
SAt W. Hutberry Fall 1977- Range ND 0 .010. 0.0]b- ND 2 .1- 0.034- 0.052- ND 35 .2-<br />
1977-786 Winter 0.079 0.043 9.7 0300 0.101 60-9<br />
1979<br />
Weeks Island Fall 1977 Range ND 0.032- 0.038 23 .6 6.4- 0.090. O.ODI- ND "9.4<br />
Shots Winter 0.040 27 .3 6.77 0.740 0.082 36-3<br />
1978<br />
----<br />
---- ------------<br />
----------------------------<br />
----------------- -- ---------------<br />
---------------- --------------- ---------------<br />
-------------------<br />
--------------------<br />
S7'OCS Texas OCS<br />
Winter,<br />
12<br />
0.03 0.04<br />
23<br />
S 0.08
IV . DISCUSSION<br />
A. Sediments<br />
l . Surficial Sediments<br />
Marine sediments contain trace metals bound in<br />
different ways . Trace metals bound in such a way that<br />
they are chemically inert in the marine environment can<br />
be referred to as "non-labile" forms . These include<br />
trace metals bound in crystalline lattices <strong>of</strong> refractory<br />
silicate minerals . Trace metals that may chemically react<br />
in the marine environment, exchanging between phases,<br />
can be referred to as "labile" forms . These include trace<br />
metals bound in organic, carbonate and hydrated iron<br />
oxide phases or in exchangeable sites on the surfaces <strong>of</strong><br />
solids . A number <strong>of</strong> investigators have attempted to<br />
identify various trace metal forms in sediments (Gibbs,<br />
1973) but have found results difficult to interpret .<br />
Trace metals entering marine waters ultimately<br />
accumulate in bottom sediments . Because the labile<br />
forms <strong>of</strong> trace metals are potentially available to marine<br />
biota it is important to estimate the amount <strong>of</strong> the total<br />
trace metal concentration <strong>of</strong> marine sediments that is in<br />
these forms . Although there is no simple procedure for<br />
determining the labile forms, the acid leach technique<br />
used in this study does provide an estimate <strong>of</strong> relative<br />
concentrations available to biota .<br />
Table 4, discussed previously, compares the<br />
overall mean <strong>of</strong> leached trace metal concentrations in<br />
the surficial sediments with data from other investigations<br />
in the same general area <strong>of</strong> the Gulf <strong>of</strong> Mexico .<br />
Trefry and Presley (1976a) suggest that their leached<br />
trace metal concentrations are representative <strong>of</strong> nonpolluted<br />
sediments from the Texas-West Louisiana coast<br />
and Mississippi River submarine delta . Mean concentrations<br />
<strong>of</strong> Cd, Cu, Pb, and Zn are close to the overall<br />
means for these metals found in the present study . Reported<br />
concentrations <strong>of</strong> Fe and Ni, however, were<br />
higher than those in this study and may reflect the<br />
stronger leaching solution (16N HN03 + SN HCI) and<br />
high leaching temperature used .<br />
Concentrations <strong>of</strong> Cd, Cu, Pb, and Zn in sediments<br />
at Weeks Island, approximately 25 nautical miles<br />
<strong>of</strong>f Marsh Island, Louisiana (Tillery, 19806) were lower<br />
than the concentrations observed in the present study<br />
area. The coarser sediments at the Weeks Island site<br />
probably account for these differences since overall the<br />
Central Gulf Platform Study samples had a finer median<br />
grain size .<br />
Although the mean trace metal concentrations <strong>of</strong><br />
surficial sediments found in this study are similar to<br />
those reported for unpolluted sediments, this is not sufficient<br />
reason to conclude that these sediments receive<br />
no metal inputs from the drilling platforms . Distribution<br />
patterns and the geochemical characteristics <strong>of</strong> the<br />
sediments surrounding individual platforms in relation<br />
to regional sediments must also be considered .<br />
a . Physical Influence <strong>of</strong> Platforms on Sediment<br />
Metal Concentrations<br />
To evaluate the trace metal distribution pattern<br />
around production platforms, the concentrations<br />
<strong>of</strong> the teachable trace metals in sediments in the vicinity<br />
<strong>of</strong> the platform structures can be used . From these data<br />
(Appendix B), definite concentration gradients increasing<br />
toward the platform structures are apparent . With<br />
the exceptions <strong>of</strong> Cu, Fe, and Zn, all the other metals<br />
demonstrated sediment concentration gradients for at<br />
least one <strong>of</strong> the platforms studied . This suggests sources<br />
from the structure or associated activities . It is possible,<br />
however, that these gradients are the result <strong>of</strong> geochemical<br />
or biogeochemical processes that are modified by the<br />
platform structure . For example, finer grained sediment<br />
may preferentially accumulate in the vicinity <strong>of</strong> the platforms<br />
due to modifications <strong>of</strong> water movement . This<br />
would lead to increased metal levels associated with the<br />
finer sediments near the platform . Also, increased biological<br />
productivity in the vicinity <strong>of</strong> the platforms may<br />
result in higher total organic carbon (TOC) levels in sediments<br />
. Higher trace metal concentrations would be expected<br />
in sediments containing the higher TOC .<br />
6 . Percent Clay Fraction Transformation<br />
To evaluate the effect <strong>of</strong> grain size on trace<br />
element gradients around the platforms, teachable trace<br />
metal concentrations were normalized to percent clay<br />
fraction in the sediments (Appendix D) . The clay fraction<br />
also includes most <strong>of</strong> the organic matter in the sediments<br />
. This data transformation is an attempt to "filter<br />
out" the grain size and organic matter control on trace<br />
metal concentrations . Therefore, gradients in the ratios<br />
<strong>of</strong> metal to percent clay may better indicate trace metal<br />
releases from a platform itself .<br />
Appendix C1 reveals higher trace metal to<br />
percent clay ratios near the platforms (especially P3) for<br />
most metals for Cruise I . Similar observations were<br />
made from Cruise II data. Nonetheless, the increases in<br />
the ratio in sediments near the platform are generally<br />
small as compared with sediments collected farther<br />
away .<br />
c. Leachable Iron Transformation<br />
Because the controls on trace metal concentrations<br />
in sediments are complex, many geochemists<br />
use elemental ratios to evaluate the importance <strong>of</strong> different<br />
processes . For example, in studies <strong>of</strong> atmospheric<br />
<strong>part</strong>iculates, many investigators (Duce et al ., 1976) normalized<br />
trace element concentrations to aluminum to estimate<br />
the importance <strong>of</strong> the continental source since<br />
aluminum can be considered to be almost exclusively derived<br />
from the continents .<br />
A similar approach was used by Trefry and<br />
Presley (1976a) who normalized HN03-HCl teachable<br />
trace metals to teachable iron concentrations in sediments<br />
<strong>of</strong> the Gulf <strong>of</strong> Mexico . They used this data transformation<br />
to compensate for variabilities in teachable<br />
trace metal concentrations that were due to variations in<br />
the grain size, organic carbon, calcium carbonate content<br />
and mineralogy . They found that metals such as Ni,<br />
Pb, and Zn strongly correlated with iron . Trefry and<br />
Presley concluded) that since sediments <strong>of</strong> a large region<br />
<strong>of</strong> the Gulf <strong>of</strong> Mexico (including the Louisiana OCS)<br />
had remarkably constant metal to iron ratios <strong>of</strong> the<br />
leached fraction, these ratios were representative <strong>of</strong> natural<br />
conditions, and that only where significant anthropogenic<br />
inputs occurred would the ratio be markedly<br />
increased .<br />
21
Following the approach <strong>of</strong> Trefry and Presley<br />
in the present study, leachable trace metal concentrations<br />
were compared to that <strong>of</strong> iron in the sediments surrounding<br />
the platforms . Appendix C1 contains computer-generated<br />
scatter plots <strong>of</strong> metal concentrations<br />
against Fe concentration using all samples collected during<br />
Cruises I and II . Regression lines, regression equations,<br />
and correlation coefficients (r) for each cruise<br />
have been included . An r value greater than 0.2144 is<br />
significant at p = 0 .05 . These data (metal concentrations<br />
normalized to Fe) are summarized by platform and station<br />
in Appendix C2 .<br />
The plots <strong>of</strong> trace metals against iron can be<br />
used to determine if the data from sediments surrounding<br />
a production platform follow a trend consistent with<br />
the data collected on a more regional basis (Trefry and<br />
Presley, 1976a ; Shokes, 1978) . Outliers <strong>of</strong> any trends<br />
that might be observed would clearly suggest pollutant<br />
concentration . One P4 sample from Cruise I had unusually<br />
high Fe concentration and is not included in these<br />
scatter plots . It probably represents contamination from<br />
iron imputs such as metal debris in the sediments or<br />
shipboard contaminants . Iron releases from the platforms<br />
obviously could invalidate the comparison <strong>of</strong> present<br />
data with others using the approach just described .<br />
It is unlikely, however, that the rates <strong>of</strong> releases <strong>of</strong> iron<br />
and other trace metals from the platforms are constant<br />
and in the same proportions as their consolidation in regional<br />
sediments . Therefore, the approach seems reasonable<br />
.<br />
For those scatter plots for which the information<br />
is available, regression lines, equations and r or rz<br />
values from Shokes (1978), Tillery (19806), and Trefry<br />
and Presley (1976a) have been included for comparative<br />
purposes . Although different digestion solutions were<br />
used in each <strong>of</strong> these studies, the results should be comparable<br />
. The stronger digestion solutions would only<br />
shift the data points further to the right along the regression<br />
line .<br />
(1) Barium/Iron Ratios<br />
Figure 1 in Appendix C1 is the scatter<br />
plot <strong>of</strong> Ba against Fe . Ba is an alkaline earth metal, and<br />
<strong>of</strong> the metals studied is geochemically the least similar to<br />
iron . It is not surprising, therefore, that the correlation<br />
between Ba and Fe is poor for both cruises . Natural barium<br />
in sediments (i .e ., not from anthropogenic inputs)<br />
is probably better correlated with the CaC03 fraction <strong>of</strong><br />
the sediments . Calcareous sediments usually contain<br />
higher concentrations <strong>of</strong> Ba because <strong>of</strong> its chemical similarity<br />
to Ca . However, the correlation <strong>of</strong> the Ba concentration<br />
to the CaC03 content (%) <strong>of</strong> the sediments<br />
was rather weak (r = 0 .372, significant at p
whether or not sediment contamination occurs due to<br />
metals release from the platforms . This further evaluation<br />
is presented in the Data Synthesis section (Task 1) .<br />
The program design <strong>of</strong> this study required<br />
that "control stations" be sampled . Control stations<br />
were located in lease blocks where no previous petroleum<br />
development had taken place but which had characteristics<br />
(e .g ., water depth, sediment characteristics,<br />
biota types, etc .) and influences (e .g ., wind, wave action,<br />
currents, etc .) similar to nearby platform stations .<br />
The four control sites were designated C21, C22, C23,<br />
and C24 (Fig . 1) .<br />
Evaluation <strong>of</strong> the sediment trace metal data<br />
(Appendix B) from the control sites indicated that the<br />
data are representative <strong>of</strong> the background concentrations<br />
found beyond the 100-m stations at the platforms .<br />
Therefore, comparison <strong>of</strong> "Control" sediment trace<br />
metal concentrations with those from the platforms<br />
would not prove fruitful . However, the "Control Site"<br />
data has been retained in the data evaluations and correlations<br />
(Appendix C1, B2, D, and E) .<br />
2 . Downcore Sediments<br />
Downcore sediments were collected at all four<br />
Primary Platforms and the four Control Sites during<br />
Cruise I . Separate core samples were taken at each site<br />
for trace metals determination and geochronological<br />
dating (Pb-210 method) .<br />
a . Geochronological Dating by Lead-216<br />
Method<br />
Downcore sediments from C22 were analyzed<br />
in detail for geochronology (see Appendix G for<br />
tabulation <strong>of</strong> Pb-210 data) . The results <strong>of</strong> the Pb-210<br />
analyses showed large variations, no trend toward decreasing<br />
activity with depth and no indication <strong>of</strong> increasing<br />
age with depth . These results indicated that either<br />
the sediments in this area were well mixed to the<br />
depth <strong>of</strong> the core or that the Pb-210 supported by Ra-<br />
226 in the sediment was much greater than the unsupported<br />
Pb-210 . Because <strong>of</strong> these results, further attempts<br />
to establish the chronological age <strong>of</strong> the sediment<br />
cores were abandoned .<br />
b . Trace Metals Analyses<br />
Although attempts to date sediments with<br />
depth were unsuccessful, piston core samples up to<br />
50 cm long were analyzed in sections for evidence <strong>of</strong><br />
metals layering . With the exception <strong>of</strong> Ba, Cd, and Zn,<br />
trace metal concentrations in the downcore sediments<br />
were relatively uniform with depth (Appendix F2) . Concentrations<br />
<strong>of</strong> Ba, Cd, and Zn increased with depth<br />
down to 20 cm then became relatively constant through<br />
the remaining core depth . The concentrations <strong>of</strong> these<br />
metals from the surface to 20 cm may reflect anthropogenic<br />
inputs followed by a discontinuation <strong>of</strong> the input<br />
activity . Though it is logical to presume this concentration<br />
to be associated with drilling activities and the<br />
"below 20-cm" discontinuity to be a predrilling condition,<br />
the data to support the presumption are lacking .<br />
This is a definite area for further research .<br />
B. Biota<br />
The objectives <strong>of</strong> the biota analyses were to (1) determine<br />
if any bioaccumulation <strong>of</strong> trace metals could be<br />
determined in marine organisms inhabiting the area<br />
around petroleum production platforms and (2) determine<br />
which <strong>of</strong> these organisms might be useful as monitors<br />
<strong>of</strong> trace metal pollution . Both objectives were only<br />
<strong>part</strong>ly accomplished due to the limited availability <strong>of</strong> organisms<br />
at the designated sampling sites .<br />
The first objective requires the collection and analyses<br />
<strong>of</strong> a sufficiently large number <strong>of</strong> pooled samples <strong>of</strong> a<br />
species so that interspecies variability may be determined<br />
. Ideally, there should be a large enough data base<br />
(i .e ., data from other investigators) available for each<br />
species so that statistically valid comparisons can be<br />
made .<br />
One problem which limits the comparison to data<br />
from other Gulf studies is that previous studies were in<br />
open shelf waters, and the species analyzed are representative<br />
. Fish data from the present study focuses on those<br />
species which are residents <strong>of</strong> the platform structures<br />
(i .e ., reef or other solid substrate) or pelagic forms attracted<br />
to the structure as temporary residents .<br />
Individual species may be classified as to time <strong>of</strong> residency<br />
as follows :<br />
Species<br />
Sheepshead<br />
Spadefish<br />
Croaker<br />
Association with Platform<br />
Long-term resident as adult, solitary<br />
Long-term resident as adult, schooling<br />
Apparent infrequent migratory visitor<br />
(length <strong>of</strong> time not definitely known),<br />
demersal<br />
Red Snapper Seasonal resident (highest concentration<br />
in winter), usually demersal<br />
Shrimp species analyzed are highly migratory and are<br />
not known to associate with platforms and associated<br />
structures, except : for perhaps being temporarily impeded<br />
by pipelines .<br />
This difference in the species <strong>of</strong> biological samples<br />
available at platforms versus open ocean sites was illustrated<br />
by the lack : <strong>of</strong> similar species being available at<br />
the control sites and the platforms . This prevented a<br />
comparison <strong>of</strong> trace metal burdens between exposed<br />
and nonexposed sampling populations as originally<br />
planned .<br />
Biological samples collected and analyzed for trace<br />
metals are listed in Table S . The total number <strong>of</strong> individuals<br />
and the total number <strong>of</strong> pooled samples analyzed<br />
are also given .<br />
Organisms analyzed that are common to other Gulf<br />
investigations are listed in Table 6 . Three <strong>of</strong> these organisms,<br />
Penaeus setiferus, Syacium papillosum, and<br />
Squilla empusa, were not collected in sufficient numbers<br />
to make more than one or two pooled samples ; therefore,<br />
they have limited value in statistical evaluation <strong>of</strong><br />
the data. However, the number <strong>of</strong> individuals pooled to<br />
make these samples are sufficient to estimate the trace<br />
metal burdens <strong>of</strong> these species in the study area . For the<br />
remaining four organisms (Table 6) sufficient numbers<br />
<strong>of</strong> samples (and individuals) were collected and analyzed<br />
to describe their tissue trace metal burdens .<br />
Accomplishing the second objective listed above requires<br />
sampling populations <strong>of</strong> sufficient size for statistical<br />
evaluation and also a diversity in the types <strong>of</strong> marine<br />
organisms sampled .<br />
Demersal fish and epibenthic organisms include a<br />
number <strong>of</strong> species that are important to the commercial<br />
and sports fishing industries . Since these species are<br />
23
consumed by man, any accumulation <strong>of</strong> toxic metal pollutants<br />
by these species may be detrimental to human<br />
health .<br />
Other species may be food sources for animals<br />
higher in trophic order . As these species are consumed,<br />
their trace metal burdens could be magnified as they are<br />
passed up the food chain, eventually affecting man<br />
(Windon et al ., 1976) .<br />
It has been shown (Pringle et al ., 1968) that some<br />
marine organisms which accumulate high concentrations<br />
<strong>of</strong> toxic trace metals (e .g ., Cd) will purge themselves<br />
and return to ambient levels once the source <strong>of</strong> exposure<br />
is removed . This capability can complicate any<br />
consideration <strong>of</strong> a species as an indicator for trace metal<br />
pollution .<br />
Another important factor in considering a potential<br />
monitoring species is the <strong>part</strong>itioning <strong>of</strong> trace metals<br />
among different tissues <strong>of</strong> the animal . Horowitz (1977)<br />
showed that there can be several orders <strong>of</strong> magnitude<br />
difference in the concentration <strong>of</strong> metals in different tissues<br />
<strong>of</strong> the same animal . Pertinent points about each tissue<br />
analyzed are : (1) the liver provides a "filtering"<br />
mechanism for the circulatory system and should show<br />
the accumulative effect <strong>of</strong> exposure to high metal concentrations<br />
; (2) the gills are in intimate contact with the<br />
external environment <strong>of</strong> the fish and should indicate exposure<br />
to soluble and suspended <strong>part</strong>iculate trace metals<br />
; (3) the gonads exposed to high concentrations <strong>of</strong><br />
certain trace metals may prevent or inhibit the normal<br />
reproductive cycle <strong>of</strong> the individuals and thus reduce the<br />
species population with time ; and (4) muscle tissue is the<br />
principle tissue consumed by humans - exposure to elevated<br />
concentrations <strong>of</strong> toxic trace metals in muscle<br />
would have an immediate impact on human health .<br />
1 . Archosargus probatocephalus<br />
Table 7 summarizes the mean trace metal<br />
concentrations in Archosargus probatocephalus<br />
(sheepshead) tissues . Data from the BGOF (Tillery,<br />
1980a) are included for comparison .<br />
Trace metal concentrations in sheepshead muscle<br />
tissue from this study are very similar to those from the<br />
BGOF study . This is to be expected since the sheepshead<br />
habitats (i .e ., petroleum production platforms) in both<br />
studies are similar . Concentrations <strong>of</strong> Cu, Fe, and Ni,<br />
however, appear to be higher in sheepshead from the<br />
Louisiana oil fields (p=0.01) .<br />
Different tissues showed significant differences<br />
in trace metal concentrations . Liver tissue concentrates<br />
higher levels <strong>of</strong> Cd, Cu, Fe, Pb, and Zn than the other<br />
tissues . Higher concentrations <strong>of</strong> Cu, Fe, and Zn may<br />
be explained on the basis <strong>of</strong> their biochemical functions .<br />
However, there are no known biochemical requirements<br />
for Cd and Pb, and the higher levels in the liver probably<br />
reflect the age <strong>of</strong> the fish and the detoxification<br />
function <strong>of</strong> the liver . Cadmium, Cr, Cu, Fe, Ni, Pb, and<br />
Zn concentrate in the gills . The gonads appear to concentrate<br />
Cd, Cr, and Pb even though the last three elements<br />
have no known biochemical function.<br />
2. Chaetodipterus faber<br />
Mean concentrations <strong>of</strong> trace metals in Chaetodipterus<br />
faber (spadefish) tissues are given in Table 8 .<br />
Comparisons are also made with spadefish data from<br />
the BGOF study. There appear to be significantly<br />
(p=0 .01) higher Cu and Fe concentrations in spadefish<br />
muscle from the present study . Since these were collected<br />
during summer (1978), differences may reflect either<br />
spacial or exposure variations .<br />
Liver tissues contained higher concentrations <strong>of</strong><br />
Cd, Cu, and Fe than other tissues . Concentrations <strong>of</strong><br />
Cu and Fe may reflect biochemical requirements for<br />
these metals . The high Cd concentrations, however,<br />
may reflect the detoxification function <strong>of</strong> the liver and<br />
age <strong>of</strong> the fish .<br />
Higher concentrations <strong>of</strong> Cd, Cr, Cu, Fe, Ni,<br />
and Zn in the gill tissues were also observed in this species<br />
and the gonads had higher levels <strong>of</strong> Cd, Cu, Fe, Ni,<br />
Pb, and Zn as compared to muscle tissue . No other literature<br />
values were found for these <strong>part</strong>icular tissues .<br />
The muscle tissues <strong>of</strong> sheepshead (Table 7) and<br />
spadefish have similar concentrations <strong>of</strong> all metals except<br />
Pb . Except for Ni, Pb, and Zn, gill tissue metal<br />
concentrations are also similar, probably reflecting the<br />
similarity in the water columns from which both species<br />
were taken . The differences in Ni, Pb, and Zn concentrations<br />
may reflect differences in the water column<br />
concentrations <strong>of</strong> these metals .<br />
The gonadal tissue <strong>of</strong> spadefish had higher concentrations<br />
<strong>of</strong> Cd, Cu, Fe, Ni, Pb, and Zn than that <strong>of</strong><br />
the sheepshead . Liver tissues in sheepshead were higher<br />
in Cu, Pb, and Zn, whereas livers <strong>of</strong> spadefish were<br />
higher in Cd . These variations may reflect the different<br />
abilities <strong>of</strong> the species to accumulate certain metals, exposure<br />
levels or possible age differences .<br />
3. Micropogon undulates<br />
Comparisons <strong>of</strong> trace metal concentrations in<br />
Micropogon undulates (Atlantic croaker) muscle tissue<br />
with similar data from other studies in the Gulf are<br />
given in Table 9. Concentrations <strong>of</strong> Cd, Cr, Ni, and Pb<br />
from this study are lower than those reported by Horowitz<br />
and Presley (1977) but higher than those reported<br />
by Shokes (1978) . The concentrations <strong>of</strong> the remaining<br />
metals (Cu, Fe, and Zn) are similar in all three studies .<br />
The differences in Cd, Cr, Ni, and Pb may be due to<br />
spacial and temporal variations or possibly due to analytical<br />
variability. Horowitz and Presley (1977) thought<br />
their Cr and Ni values may be influenced by contamination<br />
from the stainless steel instruments used in sample<br />
dissection .<br />
Trace metal concentrations in muscle tissues <strong>of</strong><br />
croaker, sheepshead (Table 7) and spadefish (Table 8)<br />
are very similar . Metal concentrations in gills and gonads<br />
<strong>of</strong> croaker are more closely matched to those in<br />
spadefish than to those in sheepshead . Liver concentrations<br />
<strong>of</strong> Cr, Cu, Fe, Pb, and Zn are similar to those <strong>of</strong><br />
spadefish while Cd and Ni concentrations are closer to<br />
those <strong>of</strong> sheepshead . The number <strong>of</strong> croaker gills, gonads<br />
and liver samples available were not sufficient to<br />
make more than estimates <strong>of</strong> their trace metal ~concentrations<br />
.<br />
4. Lutjanus campechanus<br />
Table 10 is a comparison <strong>of</strong> the mean trace metal<br />
concentrations in Lutjanus campechanus (red snapper)<br />
tissues with data from the STOCS study (Presley and<br />
Boothe, 1979) . This is the only fish species for which<br />
comparisons with another location can be made for tissues<br />
other than muscle .<br />
Concentrations <strong>of</strong> Cr, Fe, Ni, and Pb are higher<br />
in snapper muscle samples from this study while Cd,<br />
24
Cu, and Zn concentrations are similar to those reported<br />
by Presley and Boothe (1979) . Gill samples from this<br />
study have higher concentrations <strong>of</strong> Cr and Pb . The remaining<br />
metal concentrations were similar in both studies<br />
.<br />
The higher concentrations <strong>of</strong> Cr, Fe, Ni, Pb,<br />
and possibly Cu in muscle and gills may be the result <strong>of</strong><br />
exposure to higher concentrations <strong>of</strong> these metals in the<br />
water column and sediments in the present study area .<br />
S. Penaeus aztecus and Penaeus setiferus<br />
Tables 11 and 12 summarize the mean trace<br />
metal concentrations in muscle tissue for Penaeus aztecus<br />
(brown shrimp) and Penaeus setiferus (white<br />
shrimp), respectively . Similar data from other Gulf<br />
studies are included for comparison .<br />
Comparison <strong>of</strong> brown shrimp data (Table il)<br />
with data from the Strategic Petroleum Reserve Program<br />
proposed brine disposal sites at West Hackberry<br />
and Weeks Island (Tillery, 19806) indicates similar concentrations<br />
<strong>of</strong> all metals except Pb, which is higher in<br />
samples from this study . Compared with the STOCS<br />
data (Horowitz and Presley, 1977), present study concentrations<br />
<strong>of</strong> Cd, Cr, Ni, and Pb are lower . When compared<br />
to the MAFLA data (could and Moberg, 1978),<br />
shrimp from the present study have lower concentrations<br />
<strong>of</strong> Cd but higher concentrations <strong>of</strong> Fe and Pb . The<br />
concentrations from the MAFLA study are not restricted<br />
to brown shrimp but include all shrimp species<br />
collected .<br />
Table 12 data (white shrimp) are based on only<br />
two samples (10 pooled individuals) and gives only estimates<br />
<strong>of</strong> the metal concentrations present . The concentrations,<br />
however, are similar to those in SPR samples<br />
from West Hackberry and Weeks Island (Tillery, 19806)<br />
except for Ni . Compared to Shokes (1978) data from the<br />
West Hackberry site, the concentrations <strong>of</strong> Cd, Cr, Fe,<br />
Ni, and Pb in shrimp from the present study appear to<br />
be significantly higher . However, compared to the<br />
MAFLA data (could and Moberg, 1979) for the combined<br />
shrimp analyses, only Pb concentrations appear<br />
to be higher .<br />
C . Evaluation <strong>of</strong> Species for Monitoring <strong>of</strong> Trace Metal<br />
Pollution<br />
Several factors must be considered when selecting a<br />
species as a monitoring organism for trace metal pollution<br />
. These include: (1) availability <strong>of</strong> the species during<br />
all seasons, (2) the species' natural range <strong>of</strong> habitat, (3)<br />
its ability to accumulate specific trace metals <strong>of</strong> interest<br />
in response to environmental levels, (4) natural variability<br />
<strong>of</strong> trace metals in nonexposed individuals, (5) number<br />
<strong>of</strong> analyses necessary to detect a specific difference<br />
between mean concentrations, and (6) ability <strong>of</strong> the organism<br />
to purge itself <strong>of</strong> certain trace metals when removed<br />
from exposure .<br />
The ideal species for monitoring trace metal accumulations<br />
should be available in the study area during<br />
all seasons in sufficient numbers so that collection will<br />
not be a problem . The species should irreversibly accumulate<br />
the trace metals <strong>of</strong> interest in a tissue that is <strong>of</strong><br />
sufficient size for analysis . The natural variability <strong>of</strong> the<br />
trace metals in the species should be low and the ambient<br />
concentration should be low enough that accumulations<br />
can be readily detected .<br />
The final factor to consider is the number <strong>of</strong> samples<br />
that must be analyzed so the lowest variance for a <strong>part</strong>icular<br />
metal-matrix can be obtained relative to the analytical<br />
effort expended . Pooling <strong>of</strong> individuals in a species<br />
to make one analytical sample is a convenient<br />
means <strong>of</strong> reducing costly analytical efforts while obtaining<br />
reliable population means . Before pooling <strong>of</strong> samples<br />
can be done, it is necessary to sample a large population<br />
individually to determine the standard deviation<br />
between the individuals and the mean . This allows the<br />
number <strong>of</strong> individuals needed for pooling to be selected<br />
for a specific amount <strong>of</strong> variance to detect a real difference<br />
between population means (i .e ., resolution) . Resolution<br />
is dependent upon both metal and species ; therefore,<br />
different sample sizes will be needed for different<br />
metal-matrix combinations .<br />
Tables 13 and 14 give the number <strong>of</strong> individuals<br />
needed to detect a given difference (%) between population<br />
means for .P. aztecus muscle and M . undulatus<br />
muscle, respectively .<br />
In P . aztecus, a relatively low resolution (30%) requires<br />
that a large number <strong>of</strong> individuals (27 to 55) be<br />
pooled for Cd, (,r, Fe, Ni, and Pb . However, for Cu<br />
and Zn, only four individuals need to be pooled to see a<br />
30% difference in means .<br />
In M. undulatus a low resolution <strong>of</strong> 30% requires<br />
that between 38 and 67 individuals be pooled for Cd,<br />
Cr, Cu, Ni, and Pb . Only five individuals are needed for<br />
the same resolution in Fe and Zn .<br />
D . Data Synthesis<br />
The purposes <strong>of</strong> the data synthesis <strong>of</strong> the trace metal<br />
data were as follows :<br />
1 . To correlate concentration <strong>of</strong> trace metals in sediments<br />
and benthic and pelagic macr<strong>of</strong>auna with<br />
proximity to and age <strong>of</strong> the platforms studied,<br />
with emphasis on potentially toxic compounds .<br />
2 . To correlate concentrations <strong>of</strong> trace metals in<br />
downcore sediments to various ages with proximity<br />
to and age <strong>of</strong> the platforms studied with estimated<br />
age <strong>of</strong> the sediments analyzed, and with<br />
initiation <strong>of</strong> petroleum exploration, development,<br />
and production in the overall study area .<br />
3 . To determine the probable or possible impact <strong>of</strong><br />
known spills, discharges, or other sources <strong>of</strong> petroleum-activity-related<br />
contaminants on the<br />
study area in general and on the samples collected<br />
and analyzed, to review other known sources <strong>of</strong><br />
pollutants in the study area, and to discuss the<br />
Mississippi-Atchafalaya Rivers' discharges in<br />
terms <strong>of</strong> magnitude and contaminant loading,<br />
and potential impact on the study area .<br />
4 . To discuss the effects <strong>of</strong> human consumption <strong>of</strong><br />
seafood products containing various levels <strong>of</strong><br />
trace metals including contaminant levels and seafood<br />
consumption necessary to produce a probable<br />
effect .<br />
The results <strong>of</strong> these synthesis tasks are discussed below.<br />
1 . Task 1 : Correlation <strong>of</strong> Trace Metal Concentrations<br />
in Sediments and Biological Samples with<br />
Proximity to and Age <strong>of</strong> Platforms<br />
As discussed earlier in this report, the difficulty<br />
in collecting prescribed species resulted in samples <strong>of</strong> a<br />
25
TABLE 13 . Number <strong>of</strong> individuals which must be analyzed to detect a given percentage difference in Penaeus<br />
aztecus muscle tissue<br />
Number <strong>of</strong> samples<br />
% Cd Cr Cu Fe Ni Pb Zn<br />
10 488 235 43 378 360 368 28<br />
20 122 59 11 95 90 92 7<br />
30 SS 27 5 42' 40 41 4<br />
40 31 15 3 24 23 23 2<br />
S0 20 10 2 16 15 15 2<br />
60 14 7 2 11 10 11 1<br />
70 10 S 1 8 8 8 1<br />
80 8 4 1 6 6 6 1<br />
90 7 3 1 S S S 1<br />
100 S 3 1 4 4 4 1<br />
TABLE 14. Number <strong>of</strong> individuals which must be analyzed to detect a given<br />
percentage difference in Micropogon undulatus muscle tissue<br />
Number <strong>of</strong> Samples<br />
~6 Cd Cr Cu Fe Ni Pb Zn<br />
10 417 340 463 42 602 446 41<br />
20 105 85 116 11 151 112 11<br />
30 47 38 52 S 67 50 S<br />
40 27 22 29 3 38 28 3<br />
S0 17 14 19 2 25 18 2<br />
60 12 10 13 2 17 13 2<br />
70 9 7 10 1 13 10 1<br />
80 7 6 8 1 10 7 1<br />
90 6 S 6 1 8 6 1<br />
100 5 4 5 1 6 5 1
number <strong>of</strong> species being collected for analysis . This resulted<br />
in a minimum <strong>of</strong> information on intraspecies variability<br />
and an inability to distinguish what might in<br />
fact be a concentration indicative <strong>of</strong> trace metal pollution<br />
. Therefore, correlation <strong>of</strong> environmental metal levels<br />
to the presence <strong>of</strong> production platforms had to be<br />
based on sediment data .<br />
The approach was to determine ratios <strong>of</strong> the<br />
concentration <strong>of</strong> the trace metals to :<br />
a) percent iron,<br />
b) percent clay,<br />
c) total hydrocarbons .<br />
These relative concentrations were examined to see if<br />
there was a trend toward decreasing levels <strong>of</strong> the metals<br />
with distance from a platform . If a tendency was observed,<br />
other factors were examined that could explain<br />
the gradient on a basis other than introduction by petroleum<br />
related activities (i .e ., geochemical processes altered<br />
by the existence <strong>of</strong> the platform) . If an increase in<br />
concentration relative to Fe was observed along with no<br />
increase relative to clay content, then the difference in<br />
sediment mineralogy was considered a possible explanation<br />
for the differences among relative concentrations at<br />
the various distances . If a decrease with distance was<br />
observed relative to both Fe and clay, but Fe decreased<br />
relative to percent clay with distance from the platform,<br />
then the decrease could have been due to natural causes .<br />
The platforms were subsequently classified according to<br />
the extent to which they could be considered affected by<br />
environmental pollution arising from the petroleum activities<br />
. This is as follows :<br />
Probably affected :<br />
P1, S6, S7, S11, S17, S18, S19<br />
Possibly affected : P2, P3, P4, S13, 514, 515,<br />
S 16, S20<br />
Probably not affected :<br />
S5, S8, S9, S10, S12<br />
Probably affected implies that for one or more metals a<br />
tendency toward decreasing relative concentration was<br />
observed which could not be explained by relationships<br />
between that metal and percent clay or percent iron .<br />
Possibly affected implies that gradients were observed<br />
in relative concentrations but a possible explanation unrelated<br />
to the platform existed . Probably not affected<br />
means no meaningful tendencies were observed .<br />
The strongest indications <strong>of</strong> trace metal contamination<br />
due to production were at Platforms S7,<br />
511, and 517 . At S7, five metals, Ba, Cr, Cu, Pb, and<br />
Zn demonstrated a gradient with distance from the platform,<br />
and Pb to Fe and Ba to Fe ratios (Appendix C2)<br />
<strong>of</strong> more than 100 were observed at the N100-m station .<br />
At S11, Ba, Cd, Cu, Pb, and Zn were cited as probable<br />
pollutants, and Ba, Cu, Pb, and Zn concentrations relative<br />
to Fe exceeded 100 at N100 m from the platform .<br />
The same five metals were indicated as pollutants at<br />
517, with Ba, Pb, and Zn ratios relative to Fe in excess<br />
<strong>of</strong> 100 at the closest sampling site . Other "probably affected"<br />
sites and the metals indicated to have accumulated<br />
in the sediment from platform-related activities<br />
are listed below :<br />
Platform<br />
P1<br />
S6<br />
S18<br />
S19<br />
Eij _ (Ri)(C)<br />
N<br />
Indicated Pollutants<br />
Ba, Ni, Pb<br />
Cr, Ni<br />
Cu, Zn<br />
Zn<br />
Data were obtained on the age <strong>of</strong> the platform,<br />
level <strong>of</strong> production, and type <strong>of</strong> production to determine<br />
if these correlated with the contingency table between<br />
pollution indication and other <strong>part</strong>icular study<br />
factors .<br />
Platforms were arbitrarily divided into three<br />
age groups : 5 to 8 years, 11 to 17 years, and 22 to 25<br />
years . A contingency table is demonstrated by placing<br />
the actual number <strong>of</strong> observations in each category<br />
(termed DO<br />
in the square and calculating an expected<br />
number <strong>of</strong> observations (termed Eu in the inset box for<br />
that square . The results are indicated in Table 15 .<br />
If there was no relationship between the likelihood<br />
<strong>of</strong> trace metal pollution and the age <strong>of</strong> the platform,<br />
then the distribution <strong>of</strong> platforms by age would<br />
be mirrored by the distribution by age at each level <strong>of</strong><br />
potential pollution . To evaluate this, expected frequencies<br />
were calculated by the formula :<br />
where EU = expected frequency in row i, column j<br />
Ri = number <strong>of</strong> items in row i<br />
Cj = number <strong>of</strong> items in column j,<br />
and N = total number <strong>of</strong> items investigated .<br />
Age<br />
TABLE 15<br />
Probable Possible Probable<br />
Pollution Pollution No . Pollution<br />
Total<br />
Sto8<br />
2<br />
1 .75<br />
3<br />
2<br />
0<br />
1 .25<br />
9 to 17<br />
22 to 25<br />
3 .5 4 2 .5<br />
4 3 3<br />
1 .75 2 1 .25<br />
1 2 2<br />
10<br />
Total<br />
20<br />
27
The test for independence is calculated as<br />
xz =E (0U - E4) 2/E4<br />
u<br />
where OU is the observed number <strong>of</strong> items in row i, column<br />
j . The test statistic follows an approximate chisquare<br />
distribution with degrees <strong>of</strong> freedom equal to the<br />
number <strong>of</strong> rows less one times the number <strong>of</strong> columns<br />
less one .<br />
For the factor <strong>of</strong> age, a x2 <strong>of</strong> 2 .98 with 4 degrees<br />
<strong>of</strong> freedom was calculated . The tabled value at the<br />
5-percent level is 9 .49 for 4 degrees <strong>of</strong> freedom, and the<br />
results are clearly not significant . The conclusion is,<br />
then, that no relationship can be assigned between platform<br />
age and pollution level .<br />
A relationship between the productivity <strong>of</strong> the<br />
platform and the likelihood <strong>of</strong> trace metal contamination<br />
<strong>of</strong> the surrounding area was examined in a similar<br />
manner, using number <strong>of</strong> wells drilled as an indicator<br />
<strong>of</strong> activity level . The numbers <strong>of</strong> wells were divided<br />
into three classes : 1 to 7, 12 to 18, and 21 to 24 . The resulting<br />
contingency table is given below (Table 16) .<br />
The chi-squared value for this contingency<br />
table was 8 .50 with 4 degrees <strong>of</strong> freedom, again falling<br />
below the critical value <strong>of</strong> 9 .59 . The conclusion is that<br />
no relationship may be assessed between the activity<br />
level and the likelihood <strong>of</strong> pollution around the platform<br />
.<br />
The final investigation examined the<br />
relationship between level <strong>of</strong> production <strong>of</strong> both oil and<br />
gas and the likelihood <strong>of</strong> trace metal contamination .<br />
Cumulative production figures were obtained for 17 <strong>of</strong><br />
the 20 study platforms . Oil production in millions <strong>of</strong><br />
barrels and gas production in MCF were used to construct<br />
contingency tables (Table 17) .<br />
The chi-squared values were 3 .50 with 4 degrees<br />
<strong>of</strong> freedom and 10 .30 with 6 degrees <strong>of</strong> freedom<br />
for oil and gas, respectively . The critical values from the<br />
chi-squared distribution at the five-percent level are 9 .49<br />
and 12.59 with 4 and 6 degrees <strong>of</strong> freedom, respectively .<br />
Therefore, no relationship is assessed .<br />
The overall conclusion is that if some portion<br />
<strong>of</strong> the trace metal concentrations in sediments analyzed<br />
in this study are due to releases from platforms, this<br />
contamination cannot be related to the age <strong>of</strong> the<br />
platform, the level <strong>of</strong> activity, or the level or type <strong>of</strong><br />
production .<br />
2 . Task 2 : Correlation <strong>of</strong> Trace Metal Concentradons<br />
is Downcore Sediments with Proximity to<br />
and Age <strong>of</strong> Platforms<br />
The investigation <strong>of</strong> trace metals in downcore<br />
sediments with respect to age <strong>of</strong> the platform and distance<br />
from it could not be successfully completed . The<br />
dating <strong>of</strong> the cores revealed that either extensive mixing<br />
had occurred naturally or during the sampling process<br />
or the activity <strong>of</strong> supported Pb-210 was too large and no<br />
accurate time frames could be established . In addition,<br />
a <strong>part</strong>icle size analysis <strong>of</strong> the top ten centimeters did not<br />
correspond to the analysis <strong>of</strong> the surficial sediments<br />
from the same sites . This raises the possibility that the<br />
surficial layer was lost on sampling, which would also<br />
adversely affect the results <strong>of</strong> this investigation . The<br />
overall conclusion, then, is that no meaningful information<br />
can be obtained from these data, and that no response<br />
to this task is possible .<br />
3. Task 2a : Correlation <strong>of</strong> Trace Metals in Downcore<br />
Sediments with Historical Development <strong>of</strong><br />
the Study Area<br />
The original plan to determine the petroleum<br />
"predevelopment" strata in the downcore sediments (by<br />
Pb-210 geochronological dating) was not accomplished<br />
because <strong>of</strong> the apparent well-mixed character <strong>of</strong> the<br />
upper (0 to 20+ cm) sediment layers . This well-mixed<br />
upper layer was either (1) an artifact <strong>of</strong> the sampling effort<br />
(see Volume I, Part 3, II .C .I .b .), (2) actually representative<br />
<strong>of</strong> rapid sedimentation in this area <strong>of</strong> the<br />
OCS, or (3) the result <strong>of</strong> the passage <strong>of</strong> a major storm<br />
front (Tropical Storm Debra, 1978) .<br />
Without the geochronological time frame <strong>of</strong><br />
reference the trace metal data from the downcore sediments<br />
could not be analyzed to draw any further conclusion<br />
than those stated in Section IV A .2 <strong>of</strong> this report .<br />
4. Task 3: Determination <strong>of</strong> Impacts <strong>of</strong> Known<br />
Spills, Discharges and Other Sources <strong>of</strong> Petroleum<br />
Activity-Related Contaminants<br />
a. Known Spills<br />
Oil spills are known to have occurred near<br />
S12 and S13 (Vol . I, Part 1, V.C .11) . Crude oils usually<br />
have high concentrations <strong>of</strong> Ni and V, and concentrations<br />
<strong>of</strong> these two metals would have been higher at<br />
these two sites . However, no concentrations <strong>of</strong> trace<br />
metals in surficial sediments were observed that could<br />
be associated with those spills .<br />
TABLE 16<br />
No . <strong>of</strong> Wells<br />
Probable<br />
Pollution<br />
Possible<br />
Probable<br />
Pollution No . Pollution<br />
Total<br />
1-7<br />
0<br />
0.7<br />
0<br />
0.8<br />
2<br />
0.5<br />
12-18<br />
21 - 24<br />
4 .55 5 .2 5 .25<br />
6 S 3<br />
1 .75 2 1 .25<br />
1 3 0<br />
14<br />
Total<br />
20<br />
28
l x 10-6<br />
TABLE 17<br />
OIL<br />
Probable Possible Probable<br />
Pollution Pollution No . Pollution<br />
Total<br />
18.4-27 .9<br />
2<br />
1 .4<br />
1<br />
1 .4<br />
1<br />
1 .2<br />
4<br />
7.0-16 .1<br />
0.2-2 .6<br />
1 .8 1 .8 1 .4<br />
3 1 1<br />
2 .8 2 .8 2 .4<br />
1 4 3<br />
Total<br />
17<br />
MCF<br />
138 .1 - 170 .5<br />
21 .4-57 .3<br />
1 .1-5 .4<br />
GAS<br />
Probable Possible Probable<br />
Pollution Pollution No . Pollution<br />
0 .7 0 .7 0 .6<br />
0 2 0<br />
2 .1 2 .1 1 .8<br />
4 1 0<br />
1 .4 1 .4 1 .2<br />
1 1 2<br />
Total<br />
4<br />
Total<br />
17<br />
b . Discharges<br />
Produced waters from petroleum producing<br />
wells may contain concentrations <strong>of</strong> trace metals in excess<br />
<strong>of</strong> those found in the marine waters . These produced<br />
waters are treated in separators to reduce the volume<br />
<strong>of</strong> hydrocarbons associated with them . Trace metal<br />
concentrations, however, are not controlled in the produced<br />
waters and relatively large quantities may be introduced<br />
to the marine environment .<br />
Platform 1, which contains some <strong>of</strong> the older<br />
producers in this study area, contributes up to 20,000<br />
bpd <strong>of</strong> produced waters (John Burgbacher, personal<br />
communication) . These produced waters may contribute<br />
to the concentrations <strong>of</strong> Ba and Pb found in surficial<br />
sediments at P1 . Other platforms, such as S6 and S19,<br />
are also heavy contributors <strong>of</strong> produced waters . Surficial<br />
sediments surrounding both <strong>of</strong> these platforms have<br />
concentrations <strong>of</strong> Cr, Ni, and Zn that can be related to<br />
the platform structure and may reflect the volume <strong>of</strong><br />
produced water from them . However, S11, which has<br />
little discharge (Dick Hickman, personal communication),<br />
also has surficial sediment burdens <strong>of</strong> Ba, Cd, Cr,<br />
Cu, Pb, and Zn that are related to the platform . Lack <strong>of</strong><br />
information on the trace metal content <strong>of</strong> the produced<br />
waters limits the ability to correlate them with trace<br />
metal concentrations in the marine environment .<br />
c. Other Sources <strong>of</strong> Trace Metal Contaminants<br />
The nine trace metals determined in this program<br />
are known to be potentially released by various<br />
petroleum production and drilling activities . Other important<br />
sources <strong>of</strong> these trace metals are the exhausts <strong>of</strong><br />
internal combustion engines located on the platform<br />
structures on boats (supply, service or pleasure boats),<br />
flaring <strong>of</strong> natural gas, petroleum seepages, airborne terrestial<br />
sources, riverine inputs, and sacrificial anodes on<br />
the platform and satellite structures .<br />
Insufficient data prohibits a quantitative<br />
evaluation <strong>of</strong> the relationship between these sources and<br />
sediment trace metal concentrations . Trefry and Presley<br />
(1976a) suggest that Cd and Pb burdens in shelf sediments<br />
have increased within the last 25-30 years due to<br />
input from the Mississippi River . This could be an explanation<br />
<strong>of</strong> the sediment burdens <strong>of</strong> Cd and Pb at P1,<br />
S7, S 11, and S 17 . These same investigators, however,<br />
state that there have been no increases in shelf sediment<br />
burdens <strong>of</strong> Co, Cr, Cu, Mn, Ni, or Zn from the Mississippi<br />
River over the same time period . This leaves the<br />
platform-related sediment concentrations <strong>of</strong> Ba, Cr,<br />
Cu, Ni, and Zn unexplained . The concentrations <strong>of</strong> Cd<br />
and Pb in sediments may suggest the Mississippi River<br />
as a source ; however, the presence <strong>of</strong> the sediment concentration<br />
gradients with distance from a platform at<br />
P1, S7, 511, and S17 remains unexplained and may suggest<br />
a platform-related source .<br />
S . Task 4: Impact <strong>of</strong> Seafood Containing Elevated<br />
Trace Metal Concentration<br />
Ninety seven samples from 27 different organisms<br />
were analyzed for nine metals . This approach<br />
29
provided for a rather broad examination <strong>of</strong> tissue levels<br />
<strong>of</strong> trace metals <strong>of</strong> biota from the entire study area but it<br />
provided very limited data for any single organism .<br />
More samples <strong>of</strong> fewer species would improve the reliability<br />
<strong>of</strong> the data and information regarding possible<br />
differences within the study area . Comparison <strong>of</strong> the values<br />
with other areas <strong>of</strong> the Gulf Coast (STOCS and<br />
MAFLA) for those organisms common to all three studies<br />
shows no consistent elevations in the Louisiana study<br />
area . The levels <strong>of</strong> the trace metals measured in biota<br />
are well below those necessary to cause public health<br />
concern .<br />
E. Recommendations for Further Studies<br />
Further development is needed <strong>of</strong> the data evaluation<br />
technique <strong>of</strong> linear regression <strong>of</strong> sediment<br />
trace metal concentrations with other chemical<br />
and physical parameters . This technique is a<br />
valuable tool in determining abnormal levels <strong>of</strong><br />
trace metals in the sediments and could be<br />
expanded to investigate other chemical and physical<br />
parameters that correlate with trace metal<br />
concentrations . More intensive investigations into<br />
the technique and its limitations are needed . Sufficient<br />
data to further evaluate this technique already<br />
exist from previous studies done in the Gulf<br />
<strong>of</strong> Mexico and elsewhere .<br />
2 . An in situ means <strong>of</strong> determining trace metal pollution<br />
from a point source (e.g ., petroleum production<br />
platforms) is needed to eliminate extraneous<br />
factors that could prevent an accurate determination<br />
<strong>of</strong> a pollution event or <strong>of</strong> long-term<br />
chronic pollution .<br />
Placing filter-feeding organisms (clams, oysters,<br />
etc .) at a petroleum production platform (in non-contaminating<br />
cages) and harvesting them 6 months to 1<br />
year later would be one way <strong>of</strong> determining trace metal<br />
pollution . A similar control group <strong>of</strong> filter-feeding organisms<br />
would also be placed at a site such as an inactive<br />
production platform, buoy, sunken ship, etc . The<br />
trace metal concentrations in the s<strong>of</strong>t tissues <strong>of</strong> the organisms<br />
from the active platform site would be compared<br />
to those from the control site ; this comparison would<br />
provide data on the amount <strong>of</strong> trace metal pollution<br />
coming from an active petroleum production platform .<br />
30
V. CONCLUSIONS<br />
No strong evidence exists <strong>of</strong> high levels <strong>of</strong> trace metal<br />
contamination in sediments surrounding petroleum<br />
platforms . Generally, significant increases <strong>of</strong> trace<br />
metal concentrations above regional levels are observed<br />
at the 100 m stations from the platforms . Sediments collected<br />
farther away from the platforms had trace metal<br />
levels that usually could be explained by natural geochemical<br />
processes . Sediment trace metal concentrations<br />
that were not explained by natural processes could not<br />
be related to platform age, level <strong>of</strong> production, or number<br />
<strong>of</strong> wells .<br />
Trace metal inputs from the Mississippi River probably<br />
exert the dominant influence on trace metal concentration<br />
in sediments in this study area . This influence<br />
masks the effects <strong>of</strong> trace metal release from petroleum<br />
platforms .<br />
Attempts at establishing ages <strong>of</strong> sediment strata<br />
using the Pb-210 method failed . This failure is probably<br />
due to either the existence <strong>of</strong> high levels <strong>of</strong> Ra-226 supported<br />
Pb-210, high rates <strong>of</strong> sedimentation, sediment<br />
reworking, or a combination <strong>of</strong> these . Therefore, trace<br />
metal concentrations in downcore sediments could not<br />
be interpreted in a historical sense . Concentrations <strong>of</strong><br />
most trace metals were relatively constant with depth,<br />
but for Ba. Cd, and Zn, concentrations in the sediments<br />
decreased toward the surface .<br />
Concentrations <strong>of</strong> Cr, Cu, Fe, and Ni in sheepshead,<br />
spadefish and red snapper collected at the platforms<br />
may be related to sediment concentrations . Bioaccumulation,<br />
however, cannot be verified based on comparison<br />
<strong>of</strong> the overall mean tissue trace metal concentrations<br />
and ranges with similar data from other Gulf<br />
studies .<br />
31
VI . ACKNOWLEDGEMENTS<br />
Lead-210 analyses were performed by Controls for<br />
Environmental Pollution, Inc ., Santa Fe, New Mexico .<br />
Neutron activation analysis was performed by Mr .<br />
Andrzej H . Pradzynski, University <strong>of</strong> Texas, Austin,<br />
Texas .<br />
Dr . Herbert L . Windom, Skidaway Institute <strong>of</strong><br />
Oceanography, Savannah, Georgia, acted as consultant<br />
to the Trace Metal Work Group and provided valuable<br />
assistance in data interpretation and evaluation .<br />
Laboratory work on this study was performed by<br />
Bonnie Fergus, Jack Trevino, Bernie Villasenor and<br />
Cara Froboese .<br />
33
VII. LITERATURE CITED<br />
Anderson, J .B ., and R.R . Schwarzer . 1979 . Sedimentology<br />
and trace metal concentrations in sediments<br />
and organisms . In W .B . Jackson [ed .] Environmental<br />
assessment <strong>of</strong> an active oilfield in the<br />
northwestern Gulf <strong>of</strong> Mexico, 1977-1979 . Vol .<br />
III, Physical and chemical investigations . Nat .<br />
Oceanogr . Atmos . Admin ., Nat . Mar . Fish .<br />
Serv ., Environmental Protection Agency .<br />
Berryhill, H.L ., Jr ., G.L . Shideler, C.W . Holmes,<br />
G .W . Hill, S .S . Barnes, and R . G . Martin, Jr .<br />
1979 . Geology . In Environmental studies, South<br />
Texas Outer Continental Shelf, 1975 . Rep . to<br />
U .S . Bureau <strong>of</strong> Land Management . Prep . by U .S .<br />
Geological Survey .<br />
Dames and Moore . 1979 . The Mississippi, Alabama,<br />
Florida, Outer Continental Shelf baseline environmental<br />
survey, 1977-1978 . Vol . I-A . Program<br />
synthesis report . Final rep . to Bureau <strong>of</strong> Land<br />
Management .<br />
Duce, R.A ., G.L . H<strong>of</strong>fman, B .J . Ray, I .S . Fletcher,<br />
G .T . Wallace, J .L . Fasching, S.R . Piotrowicz,<br />
P .R . Walsh, E .J . H<strong>of</strong>fman, J.M . Miller, and<br />
J.L . Heffler . 1976 . Trace metals in the marine atmosphere<br />
: Sources and fluxes, pp . 77-120. In<br />
H.L . Windsor and R.A . Duce [ed .] Marine pollutant<br />
transfer . Lexington Books, Lexington,<br />
Massachusetts .<br />
Gibbs, R .J . 1973 . Mechanisms <strong>of</strong> trace metal transport<br />
in rivers . Science 180 :71-73 .<br />
Gould, G ., and B . Moberg . 1979 . Macroepifauna and<br />
demersal fish trace metal analyses . In The Mississippi,<br />
Alabama, Florida, Outer Continental Shelf<br />
baseline environmental survey, 1977-1978 . Vol .<br />
II, Chapter 5 . Final rep . to Bureau <strong>of</strong> Land Management<br />
. Dames and Moore .<br />
Holmes, C.W . 1973 . Distribution <strong>of</strong> selected elements<br />
in surf icial marine sediments <strong>of</strong> the northern Gulf<br />
<strong>of</strong> Mexico continental shelf and slope . U .S . Geol .<br />
Surv . Pr<strong>of</strong> . Paper 814 . 7 p .<br />
Horowitz, A ., and B .J . Presley . 1977 . Trace metal concentration<br />
and <strong>part</strong>itioning in zooplankton, neuston<br />
and benthos from South Texas Outer Continental<br />
Shelf . Arch . Environ . Contam . Toxicology<br />
. 5(2) :241-255 .<br />
Johnson, D . 1979 . Interpretation <strong>of</strong> tissue trace metal<br />
data . In The Mississippi, Alabama, Florida,<br />
Outer Continental Shelf baseline environmental<br />
survey, 1977-1978 . Vol . II . Final rep . to Bureau<br />
<strong>of</strong> Land Management . Dames and Moore .<br />
Montalvo, J.G ., and D.V . Brady . 1974a. Toxic metal<br />
determinations in Timbalier Bay water samples .<br />
Part 1 . Final rep ., Offshore Ecol . Invest ., Gulf<br />
Univ . Res . Consortium, Houston, Texas .<br />
Montalvo, J.G ., and D .V . Brady . 1974b . Toxic metal<br />
determinations in <strong>of</strong>fshore water samples . Part 2 .<br />
Final rep ., Offshore Ecol . Invest ., Gulf Univ .<br />
Res . Consortium, Houston, Texas .<br />
Nulton, C.P ., C.F . Bohnstedt, D.E . Johnson, S.F .<br />
Martin, and R.E . Thomas . 1980 . Ecological investigations<br />
<strong>of</strong> petroleum production platforms in<br />
the Central Gulf <strong>of</strong> Mexico . Vol . 1 : Pollutant fate<br />
and effects studies . Part 3 : Organic chemical<br />
analyses . Draft final rep ., Bureau <strong>of</strong> Land Management<br />
. Southwest Research Institute, Houston,<br />
Texas . 143 p .<br />
Potter, P.E ., N .F . Shimp and J . Witters. 1963 . Trace<br />
elements in marine and fresh water argillaceous<br />
sediments. Geochem . Cosmochem . Acta . 27:669-<br />
694<br />
Presley, B .J ., and P.N . Boothe . 1979 . Trace metals in<br />
epifauna, zooplankton and macronekton, pp . 6-1<br />
to 6-47 . In Environmental studies, South Texas<br />
Outer Continental Shelf, Biology and Chemistry,<br />
1977 . Univ . Texas Mar . Sci . Inst ., Port Aransas,<br />
Texas .<br />
Pringle, B.H ., D.E . Hissong, E.L . Katz, and S.T . Mulawka<br />
. 1968 . Trace metal accumulations by estuarine<br />
mollusks . J . Sanit . Eng . Div . Amer . Soc .<br />
Civ . Engrs ., 94(3) :455 .<br />
Shokes, R .F . 1976 . Rate-dependent distributions <strong>of</strong><br />
lead-210 and interstitial sulfate in sediments <strong>of</strong><br />
the Mississippi River Delta . Ph.D . Dissertation .<br />
Texas A&M Univ ., College Station, Texas .<br />
Shokes, R .F . 1978 . Characterization <strong>of</strong> baseline conditions<br />
at the West Hackberry <strong>of</strong>fshore brine disposal<br />
site-Texoma group strategic petroleum reserve<br />
program . Final rep . to U .S . De<strong>part</strong>ment <strong>of</strong> Energy<br />
. Prep . by Science Applications, Inc .<br />
Shokes, R .F . 1979 . Macroepifauna and demersal fish<br />
barium and vanadium . In The Mississippi, Alabama,<br />
Florida, Outer Continental Shelf baseline<br />
environmental survey, 1977-1978 . Vol . II, Chapter<br />
7 . Final rep . to Bureau <strong>of</strong> Land Management .<br />
Dames and Moore .<br />
Tiech, T.T ., T.E . Pyle, D.H . Eggler, and R.A . Nelson .<br />
1973 . Chemical variations in sedimentary facies<br />
<strong>of</strong> an inner continental shelf environment, northern<br />
Gulf <strong>of</strong> Mexico . Sediment Geol . 9:101-115 .<br />
Tillery, J.B . 1980a . Trace metals . In W.B . Jackson,<br />
[ed .] Environmental assessment <strong>of</strong> an active oilfield<br />
in the northwestern Gulf <strong>of</strong> Mexico . Nat .<br />
Oceanogr . Atmos . Admin ., Nat . Mar . Fish .<br />
Serv ., Environmental Protection Agency .<br />
Tillery, J.B . 19806. Trace metals . In W.B . Jackson and<br />
G.M . Fau [ed .] Biological/Chemical survey <strong>of</strong><br />
Texoma and Capline sector salt dome brine<br />
disposal sites <strong>of</strong>f Louisiana, 1978-1979 . Vol . VII .<br />
NOAA Technical Memorandum NMFS-SEFC-<br />
31, 76 p .<br />
Trefry, J .H ., and B .J . Presley . 1976a . Heavy metal<br />
transport from the Mississippi River to the Gulf<br />
<strong>of</strong> Mexico, pp . 39-75 . !n H .L . Windom and R.A .<br />
Duce [ed .] Marine pollutant transfer . Lexington<br />
Books, Lexington, Massachusetts .<br />
Trefry, J.H ., and B .J . Presley . 19766. Heavy metals in<br />
sediments 'from San Antonio Bay and the northwest<br />
Gulf <strong>of</strong> Mexico . Environ . Geol . 1 :283-294 .<br />
Ward, C.H ., M . :E . Bender, and D .J . Reish [ed .] .1979 .<br />
The <strong>of</strong>fshore ecology investigation . Effects <strong>of</strong> oil<br />
drilling and production in a coastal environment .<br />
Rice Univ . Stud . 65(4&5) : 1-589 .<br />
Wheeler, R.B ., J.B . Anderson, R.R . Schwarzer, and<br />
C.L . Hokanson . 1980 . Sedimentary processes and<br />
trace metal contaminants in the Buccaneer<br />
35
Oil/Gas Field, Northwestern Gulf <strong>of</strong> Mexico . Environ<br />
. Geol . 3 :163-175 .<br />
White, T.T ., K.E . Turgon, and A.W . Blizzard . 1977 .<br />
Rig monitoring . In Baseline monitoring studies,<br />
Mississippi, Alabama, Florida Outer Continental<br />
Shelf, 1975-1976 . Vol . VI . Final rep . to U .S . Bureau<br />
<strong>of</strong> Land Management . State Univ . System<br />
Fla. Inst . Oceanogr .<br />
Williams, S.E ., and J.J . Jones . 1974 . The distribution<br />
and origin <strong>of</strong> bottom sediments in Timbalier Bay,<br />
Louisiana . Final rep ., Offshore Ecol . Invest .,<br />
Gulf Univ . Res . Consortium .<br />
Windom, H .L ., W .S . Gardner, W.M . Dunstan, and<br />
G .A . Paffenh<strong>of</strong>er . 1976 . Cadmium and mercury<br />
in a coastal marine ecosystem, pp. 135-158 . !n<br />
H.L . Windom and R .A . Duce [ed .] Marine pollutant<br />
transfer . Lexington Books, Lexington,<br />
Massachusetts .<br />
Young, E .J . 1954 . Studies <strong>of</strong> trace metals in sediments<br />
. Ph.D . Thesis, M .I.T ., Cambridge,<br />
Massachusetts .<br />
36
VIII . PERSONAL COMMUNICATIONS<br />
John Burgbacher 2 . Richard R. Hickman<br />
Shell Oil Company<br />
Exxon<br />
One Shell Square Rm 3650 P .O . Box 60626<br />
P.O . Box 60124 New Orleans, LA 70160<br />
New Orleans, LA 70160<br />
37
APPENDICES<br />
39
APPENDIX A<br />
Abbreviations used in this work<br />
41
Abbreviations used in this work<br />
AAS Atomic Absorption Spectrophotometry NBS National Bureau <strong>of</strong> Standards<br />
Bi-210 Bismuth-210 NAA Nuclear Activation Analysis<br />
BGOF Buccaneer Gas/Oil Field OEI Offshore Ecology Investigation<br />
BLM The Bureau <strong>of</strong> Land Management OCS Outer Continental Shelf<br />
HAP Hydrated Antimony Pentoxide STOCS South Texas Outer Continental Shelf<br />
Pb-210 Lead-210 SPR Strategic Petroleum Reserve<br />
MAFLA Mississippi, Alabama and Florida Study TOC Total Organic Carbon<br />
43
APPENDIX B<br />
Metal Concentrations in Surficial Sediments by Platform and Station in jug/g Dry Weight<br />
45
Summary for RA in Surficial Sediments PAGE<br />
Distance<br />
Transect 0100 OSOU 1000 2000 Mean<br />
N - l94,6-00 61 .600 58 .000 60 .800 98 .750<br />
S 191,800 45 .200 a4 .4100 93 .800<br />
1 o . s0~ 0<br />
2b .500<br />
11 Mean 1 46 . 400 .333-'3~:~33-~''b'T:7<br />
'N;8<br />
Station 03<br />
E 71 .800 , . . , _~ . . . . _~ 44 .200 , 60,760<br />
w<br />
119 .800 b u .b00 84 .400 35 .000 75 :950<br />
mean Q1 .000 53 .533 63 .000 43,800 62 .833<br />
tation 04<br />
E 79 .900 77 .800 97,400 85 .033<br />
Station 23<br />
47 .500<br />
Station 24<br />
Grwnri<br />
26 .600<br />
Mean -103 .333--~2~ 59 .808 65 .U9 61 .7w<br />
47
Summary for CD in Surficial Sediments PAGE 2<br />
Distance<br />
----------------------------------------<br />
Transact 0100 OSOU IOUO 2000 Mean<br />
Station 02<br />
E .151 .223 .112 .272 .185<br />
s .261 .252 .IQU .27u .2a'4<br />
w<br />
Mran<br />
.319<br />
.22b<br />
.203<br />
.25k<br />
.316<br />
.202<br />
.274<br />
.303<br />
.278<br />
.24b<br />
Station 03<br />
E .050 .Ou2 .034 .048 .044<br />
.0es .u~5 .062 .20e .102<br />
w ,030 .075 .079 .249 .109<br />
Mean .049 .059 .055 .155 .079<br />
St a t ion U4<br />
E<br />
,281 .098 .114 ,1U0 .171<br />
14 ,211 .121 .155 .119 .151<br />
S .425 .140 .119 .341 .256<br />
y<br />
.UF3<br />
Mean<br />
.336 .116 .117 ,175 .186<br />
Station 21<br />
Station 22<br />
Station 23<br />
. 5<br />
.209<br />
.124<br />
S tation<br />
.136<br />
Grand<br />
Msan .241 .181 .168 .228 .205<br />
48
Summary for CR in Surticial Sediments PAGE 3<br />
n19C9n[P<br />
Transact 0100 0_40 1000 2000 Mean<br />
N 1u,300 6 .940 7 .410 10 .200 9,712<br />
S<br />
111.060p~ 7 .770 9 .070 10-,§71_0 9,652<br />
Mean 12+3b 2~ 1 Q . U ~~-f TT 4 :T~'~ 0<br />
Station 03<br />
E 5 .2Q_~<br />
0 ~ 5 _~.300 5 .630 4,190 5 .143<br />
4<br />
°0<br />
3 - b<br />
725<br />
. 7~<br />
B ;8<br />
3 .950 ~ .5Aa<br />
: T . -5 .<br />
5 .370 4,120<br />
5 .590 4,757<br />
Mean 4 .702 5 .085 4 .675 5 .942 5 .101<br />
E S tation 4 8 .825 10 .060 10 .210 7 .120 9,028<br />
N S<br />
10 .210 9 .510 9,980 Q .~00 9 .7<br />
10-5<br />
w 7 . 0 U 9,<br />
Mean<br />
8 .701 9,527 10 .030 9 .247 9,376<br />
station ?I<br />
Station 22<br />
Station 23<br />
r~3<br />
6,980<br />
7,410<br />
Station 24<br />
9,450<br />
Grand<br />
Mean 7_651 7_3SO 7 ,2 64 7,553 7,586<br />
49
Summary for CU in SurfiCial Sediments PAGE u<br />
Distance<br />
Transect 0100 0500 1000 2000 Mean<br />
N 14 .542 9 .307 11 .716 13 .491 12 .261<br />
S 15 .360 13 .176 9 .837<br />
13 686 13 .016<br />
13 .491 12 .oA& 11 .690 12 .15 12 .605<br />
can<br />
u, n<br />
Station 02<br />
E 5 .6uy 10 122 3 .830 9,745 7 .215<br />
.yVb ,y8<br />
S 11 .57u 9 .345 11 .5u8 11 .716 11 .044<br />
N 12 .3nU 6 .358 12 .715 16 .110 11 .870<br />
Mean 8 .85 9,932 9 .268 11 .975 10 .015<br />
Station 03<br />
E 2 .459 4 .081 3 .723 2 .375 3 .081<br />
14 2 .u51 3 .217 2 .518 10 .122 4,577<br />
3 .294 3 .600 u,o51 7 .847 4 .6q8<br />
Mean 2 .692 3 .36b 3 .285 7 .077 4 .105<br />
tation 4<br />
E 16 .250 10 .741 9 .695 10 .037 12 .188<br />
16,538 10 .193 11 .336 9 .552 11 .904<br />
S JO 184 10 .877 9 .766 10 .570 12 .119<br />
U .yHb<br />
Mean 15 .989 10 .709 14 .205 10 .159 11 .765<br />
Station 21<br />
"<br />
Station 22<br />
1 .5 , 28 4<br />
10 .877<br />
Station 23<br />
" 7 .654<br />
a ion v<br />
10 .724<br />
Grind<br />
Mean 10 .536 9 .103 8 .253 10 .449 10 .105<br />
50
Summary for FE in Surfitial Seoiments PAGE 5<br />
~istance<br />
Transect 0100 0 OU 1000 2000 Mean<br />
t ,974 .831 .556 .674 ,782<br />
N 1 .060 .577 .096 .9U3 .819<br />
S ,743 ,729 .761 .991 .806<br />
w -91h -q?l u<br />
p<br />
j2<br />
Mean ,923 .764 .71u ,803 .8 1<br />
Station 02<br />
Station<br />
E<br />
Mean<br />
S tation<br />
E<br />
S 11<br />
'?ean<br />
03<br />
04<br />
Station 21<br />
Station 22<br />
Station 23<br />
tattoo<br />
Grand<br />
Mean<br />
4<br />
~352 373 .366<br />
h<br />
.3Z7 .36J<br />
b<br />
.25b ,uA6 ,361<br />
.319 ,416 .346<br />
.830<br />
1 .060<br />
_713<br />
.646<br />
,817<br />
,746<br />
.825<br />
~,s~<br />
,734<br />
,799<br />
.852<br />
.925<br />
,9u<br />
.b 8<br />
,830<br />
.380<br />
.6<br />
24<br />
.538<br />
.540<br />
.577<br />
.782<br />
934<br />
.838 653 631 754<br />
366<br />
- 417<br />
_<br />
.410<br />
.4105<br />
.760<br />
.848<br />
851<br />
1 .1490<br />
1 .070 .879<br />
v .71<br />
737<br />
.720<br />
.882<br />
726<br />
51
Summary for NJ in Surficial Sediments PAGE b<br />
Distance<br />
Transact 0100 0500 1000 2000 Mean<br />
i n A<br />
,p<br />
L113U<br />
10<br />
N 12 .u3u 9 .510 10 .670 11 .350 10 .990<br />
S 10 .990 11 .120 8 .570 12 .330 10 .752<br />
1 00 11 90 10 .030 10 .280 10 .422<br />
can u .<br />
Station 02<br />
E<br />
-<br />
6 .220<br />
~o<br />
10 .450 6 .680 1 : 218 7 . 111<br />
S<br />
10 .290 10,050 10 .450 10 .41 0.297<br />
10 .410 8 .760 12 .640 12 .750<br />
11<br />
11 .140<br />
Mean B . ;0 10 .335 9 .637 10 .527 9_782<br />
Station 03<br />
~E 6.005 5 980 5 .980 4 .450 5 .648<br />
N 4 .310 5 .030 u,760 10 .450 6 .137<br />
w 3 .9 430 64KU 664U<br />
20 6.180 5 .910 8 .4A0 6 .122<br />
Mean<br />
4 .916 5 .917 5 .835 7 .550 6 .054<br />
S tation 04 -<br />
E 12 .650 8 .140 10 .030 9,640 10 .396<br />
N 12 .960 9 .610 11 .440 9,400 10 .865<br />
15 .550 11 .350 9,820 9 .980 114397 , 5<br />
Mean 12 .925 9 .335 9 .817 9 .972 10 .512<br />
Station 21<br />
Station 22<br />
8 . 900<br />
Station 23<br />
" 9 .200<br />
St a t ion<br />
9 .910<br />
Grand<br />
Mean 9 .333 9 .015 8 .737 9 .662 9 .639<br />
52
Summary for Ps in Surficial Sediments PAGE 7<br />
Dietanee<br />
Transect 0100 0500 1000 2000 Me an<br />
tation 02<br />
N 10 .040 8 .230 8 .000 ~,6 0 8 .72<br />
S 9,880 10 .630 11 .500 11 .110 10 .780<br />
W 8 .640 12 .990 1 .470 12 .000 12 .025<br />
Station 03<br />
E 7 .000 7 .750 6 .6 ~ 4 Q 0 ~ ~ ~ 7 ._~<br />
090 p 7 .1062<br />
S 000 6 . b ~ -i ~49~ ' 042<br />
i<br />
7 .530 7 .680 5 .350 7 .820 7 .095<br />
Mean 7,302 6 .982 5 .605 10 .475 7 .641<br />
tat+on 4<br />
E<br />
N<br />
30,125<br />
17 .500<br />
18 .160<br />
17 .000<br />
18 .500<br />
22 .44 0<br />
19 .760<br />
15 .050<br />
22.579<br />
17 .94<br />
2<br />
Mean<br />
26 .311 18 .387 19 .165 18 .390 0 .563<br />
gtatten 21<br />
Station 22<br />
1-170 u<br />
Station 23<br />
" 17 .935<br />
Station 24<br />
21 .260<br />
Grand<br />
Mown 16_oRA- 12_290 11 88 ; 13456 14,976<br />
53
Summary for V in Surficial Sediments PAGE A<br />
Distance<br />
Transect 0100 0500 1000 2000 Mean<br />
t 4 . to VU /,UUU Y,lUU 4 .SUV /,4/S<br />
N 9 .800 8 .900 7 .200 8 .633<br />
S 13 .20 9 .200 11 .800 11 .400<br />
w 8 30U 6 .700 6 70U 7 .100 7 .200<br />
'dean<br />
Station 02<br />
8 00 1 , 900 4 800 4 .500 6 .522<br />
N<br />
S 6 .400 5 .600 8 .700 25 .400 11 .5<br />
W 3 .000 6 .000 7 .100 13 .600 7 .425<br />
Mean 5 .650 7 .875 6 .875 12 .800 8 .300<br />
Station 03<br />
E 4,800 3 .400 4,100<br />
N 29 , 900 2 , 900 3 .300 7,900 11 .000<br />
. vu n . uo IOU<br />
w<br />
U .100 13 .300 8 .600<br />
Mean 29,900 3 .850 4 .025 9 .700 11 .868<br />
S tation 04<br />
E 8 .800 11 .300 10 .900 10 .333<br />
N 9,000 10 .b00 11 .500 8 .600 9,925<br />
S 13 . 400 10 .600<br />
1 2 .200 12 .8 00<br />
12 .30 0<br />
. u~ - Tu ~. 56u<br />
T~ TO ' D - '-<br />
T'1~ 7'<br />
Mean 10 .26b 11 .175 11 .025 12 .000 11 .116<br />
Station 21<br />
Station 22<br />
Station 23<br />
6 .800<br />
11 .550<br />
tat on 4<br />
7 .500<br />
Grand<br />
Mean 14 .004 7 .712 7 .781 10 .175 9 .227<br />
54
Summary fog ZN in Surficial Sediments PACE 9<br />
Transact<br />
----- ----------- Distance<br />
0100 0500 1000 2000 Mean<br />
tation 02<br />
S 34 .300 26 .800 33 .100 30 .800 30 .250<br />
w 28 .200 29,100 34 .400 33 .600 31 .450<br />
Station 03<br />
E 18 .600 20 .000 20 .000 19 .200 19 .355<br />
Ig_500 18 090 16-020 g4-909<br />
19495<br />
11 S 19, 1 00<br />
1 b,2 - o U<br />
~ ...<br />
19 140<br />
W 18 .200 25 .000 21 : 60 0 25 .700 22 .625<br />
Mean 19 .000 20 .450 19,350 25 .225 21 .006<br />
tetlon 04<br />
E 43 .400 31 .800 35.500 35 .900 54,066<br />
41 .300 33 .600 45.400 33 .600 38 .475<br />
11 S<br />
4A- ;)On<br />
w 99,000 H :08 0 . U 3T .0<br />
Mean<br />
70 .475 35 .575 3b.425 37 .025 44 .875<br />
Stwfinn ?1<br />
Station<br />
-<br />
22<br />
Station 23<br />
40 .250<br />
33_700<br />
34 .300<br />
Stat i on 24<br />
37 .200<br />
Grand<br />
-Mean 41_609 31_506 30 .587 13337 35,561<br />
55
Trace Metals in Surficial Sediments - Second Cruise<br />
Cd Cr Cu Fe Ni Pb Zn Ba v<br />
Station OS<br />
0100 .417 5 .630 5 .254 .437 7 .840 - 5 .230 23 .400 1n3 .400 4 .600<br />
§-7 1.' Q 494 § .270 IP-499 ~6-300<br />
1000 . 4 R O 19 6 10 i 8 1 .5 .44 .5 775 it) .33u 11 110 4z r4ov ;M4 ~i e ios<br />
2000 .78q 5 .880 17 .411 :583 12 .530 13 :600 42 :400 123 .800 9 .600<br />
1 t At inn Oh<br />
0100 .500 15 .75 0 1 .213 86 15 .020<br />
*.667 14,670 15 . 071 .899 11 . 870 28, 03U 62 . 200 34,000 11 . 300<br />
050* .400 16 .160 15 .58b .851 15 .230 29 .540 65 .000 14,400<br />
1000 .524 13 .760 16 .526 .852 11 .95 0 3U . 40 68 .400<br />
2000 .532 15 .390 14,656 .997 11 .760 24 .260 50 .640 9,800<br />
StArinn n<br />
0100 .316 18 .700 14 .318 .808 13 .700 97 .800<br />
0500 .253<br />
61 . 800 q8 .1300 12900<br />
13 .060 13 .572 .799 14,510 27 .310 52 .700 62 .000<br />
1000 .230<br />
12 .100<br />
15 .234 12 .678 .816 15 .430 27 .310 Sa .700 x9,200<br />
anon _t7~ 11 .200<br />
11_040 1 ?-098 -ROM 10 600 22,170 4S .800 60,800<br />
Station 08<br />
0100 .412 9,170 11 .614 .722 9,60 16 .940 46 .800 79 .200 7 .800<br />
48 4 49 -70 0<br />
1000 .37v 6 .910 13 .1 .SU0 9 .060 11 .530<br />
2000<br />
0 .6 U .<br />
.235 11 .140 12 .827 .832 14 .200 16.880 09 .200 37 .200 17 .900<br />
Rtarinn 09<br />
010 .388 9,430 11 .3 8 .762 9 . ,6 4 .4 ,40<br />
.566 11 .600 12 .b7~ .d51 13 . 580 37 . 230 63 . 200<br />
0500<br />
13 . 000<br />
.347 9 .396 13 .206 .573 10 .410 24,070 vH .500 89 .400 2G .6o0<br />
828 11-232 21-130<br />
2000 ,415 13 .d9U 1 ,41 .9<br />
1 .46 .640<br />
Station 10<br />
9 4<br />
.S 0 10 . 74 ' 0 U . 1 .1 6 6 0 U<br />
0500 .6n4 8 .o5U 13 .688 .899 13 .030 6 .690 32 .300<br />
* .436 8 .190 11 .932 .827 12 . 550 8 . 190 47 . 600 7 . 400<br />
4 8 7 9 6 00 0 7 *j88<br />
000 .368 8 .1 0 9. 9 1 8<br />
Station 11<br />
(11 no -S<br />
8 1 49 ,800 00<br />
0500 .201 7 .364 .OlU .b 10 02 1 1 -.<br />
1 b .<br />
1000 .418 5 .010 10 .550 .571 8 .870 7 .320 31 .300<br />
2000<br />
35 .200 6 .100<br />
.273 8 .810 12 .827 .745 14 .710 10 .430 42 .000 13 .000 9 .200<br />
tation 1<br />
0100 ! 928<br />
7 .770 19 .330 .723 13 .300 16 .220 48 .000 118 .200 11 .300<br />
0500 .550 8 .580 15 .486 .808 11 .760 9 .200 35 .200<br />
b 9 8 1 ~ :21 j~ n j8 : 81 0 14130 35 , 700 75 .3000 9,300 7<br />
U 4 .<br />
vu<br />
too<br />
* Entry skewed four places to the left<br />
56
Trace Metals in Surficial Sediments - Secono Cruise<br />
Cd Cr Cu Fe Ni Pb Zn Ba V<br />
--- -- ------ ------ ------ ------ -- --- ------ ------ ------<br />
Station 13<br />
0100 599 12 .910 13 .827 .788 9 .320 21 .330 b5 .100 8 .100<br />
* .609 . 5 117 , 100 15.064 .902 13 .990 34 .750 87 .300 8 .600<br />
V5,07 v T . :~8D -24 .260 5 . Z~UU-<br />
1000 .5Q9 16 .1U to 80 U 1 15 4<br />
.5 725<br />
55 .925 12 .720 27 .1Q0 56 .900 60 .400 13 .900<br />
2000 .430 16 .370 15 .511 .949 15 .330 30 .040 66 .000 11 .600<br />
Station 15<br />
° IJ 00 .<br />
. 2 i ~ . ~ bR 0 p 9 ~~ 695 724 1u,d2 ~ U ~5U 65 .u~o 93 . 800 11 .100<br />
6~ ^<br />
0140 1 .5 D 71 UUU 41613<br />
1000 .225 t3 .o40 7,378 .555 11 .380 22 .500 43 .000 115 .800 10 .400<br />
2000 .268 10,090 6 .499 .710 11 .760 12 .340 31 .100 57,200<br />
S tation 16<br />
0100 .495 10,550 7 .881 .696 8 .900 19 .450 50,400 179,800<br />
0540 .2P1 4,100 8 .853 510 8 .190 ?_3 .020 44 .500 10 .600<br />
1000 :Z 2 17 11 110 8 .2)8 .771 11 .520 17 .870 44 .700 55 .000 10 .300<br />
Station 17<br />
0100 8Q2 13 , 110 12 .690 .583 9 .250 136 .020 192 .900 245 .400 9,600<br />
oSOO .d .235 1v .u60 . 7 .905 .712 11 .730 59,330 6u .600 . 193 .400~ 12 .100<br />
* .371 11 . 230 8 . 706 .663 11 . 180 54,150 73 .400 203 .800 10 . 900<br />
1000 .173 14 .770 7 .457 .775 13 .690 41 .740 60 .700 99,600 11 .100<br />
2 0 0 0<br />
Station 18<br />
0100 ,X . 39b 251 7 .770 11 .288 703<br />
- ' `- - 10 .600 14 .650 50 .300 88 .800 8.200<br />
I e . TA 6 S<br />
0500 .300 9,70 ~a7Z ~T. T3'U "1'u .<br />
.536 .711 9 .110 'UO'U-5U'<br />
11 .500 : iT1'Q<br />
13 .700 87,600 9,200<br />
1000 .178 6 .800 7 .820 .478 7 .520 15 .700 40,900 86 .200 9,000<br />
2000- .144 9 .360 6 .582 .65b 9.560 14 .740 30 .600 9,400<br />
Station 19<br />
0100 .023 2 .700 1 .033 .1A5 v .82U 2 .090 19,300 1 .400<br />
0500 008 3 .240 .910 .253 5 .650 2 .110 16 .300 2 .100<br />
2000 .014 2 .320 1 .107 :'1 ?1 4,430 2 .090 17 .500<br />
Station 20<br />
0500 .155 7 .3 tPOU Be<br />
20 x,761 .505 9,230 7 .900 1 .200 V<br />
1000 .206 6 .880 6 .499 ,625 7 .950 5 .230 29 .400 6.900<br />
200 ._232 _ _6 .260 9 .739 .535 8.290 12 .030 29 .500 56 .000 9 .200<br />
* Entry skewed four places to the left<br />
57
APPENDIX Cl<br />
Graph <strong>of</strong> Metal Concentration vs . Fe Concentration for SN HN03 Leach <strong>of</strong> Surficial Sediments<br />
I :<br />
II :<br />
May 1978 Cruise (Primary Platforms)<br />
August 1978 Cruise (Secondary Platforms and Control Sites)<br />
For each graph :<br />
1-indicates two data points<br />
2-indicates three data points<br />
3-indicates four data points<br />
59
BA VERSUS FE FOR 61M281XC<br />
rl .+tt*+ .tt lt.++ttt+tl+tt+tttftlrrr+t+t+tl+ . .++ttftitfti+t .i. laar+t~tt+l<br />
-~TS~"<br />
t<br />
---- t<br />
ib25 .-<br />
r<br />
f<br />
f<br />
150J .-<br />
t<br />
t<br />
_1375 . - r<br />
t<br />
i<br />
- 125u:-<br />
r I : y = 110 .9x + 14 .1<br />
1125 .= r = 0 .169<br />
* II : y = 100 .8x + 160 .4<br />
t00J .-<br />
t<br />
as<br />
r = -0 .184<br />
a7 ;<br />
C : y = 23 .9x + 26 .5<br />
u9/9 * (Tillery-SPR 1 980b)<br />
750 . "<br />
t -<br />
f<br />
625 .- r<br />
- --<br />
50u .-<br />
-<br />
t<br />
A75<br />
2SU .-<br />
r<br />
x ,t ,e+<br />
y * t<br />
i2s .- -* -*- _ _ * ** *~<br />
----- _ + ~ ,r x * k * ±r ** T~ 12 +L.1 Z its l-mot 1 ls-rt~<br />
f - x ,t t ,i ,t +t 1 t ~r " 1 ,t 2 +t<br />
cwt<br />
-+L ±± ~i at+~ .. . .. .. . . . .. .. . .. . lttti+i . . . I o+ .* .<br />
,OUO .700 .uU . U<br />
FE<br />
FIG. 1 . Surficial sediment Ba concentration (fig/g) vs Fe concentration (%)<br />
61
Ca VERSUS Fe FOR bLMZB1CX<br />
+I t+t+tt.it l .......*+I++++..... lfit+++tttlt+ t.t ..+tl .t. ....ttlttttt~~t~l<br />
- 1 .050=<br />
" I : y = 0 .123x + 0 .123<br />
---~ r = 0 .25<br />
" Q7S ; II : y = 0 .405 + 0 .103<br />
_.__. . * r = n _ 39n<br />
t<br />
B : Y = 0 .19x - 0 .03<br />
(Shokes, 1978)<br />
----<br />
.A25-<br />
-;<br />
x<br />
t<br />
t<br />
-- +<br />
.675- + x<br />
Cd<br />
t +r<br />
.h00 "<br />
: **<br />
t +t<br />
t<br />
'<br />
5.25- t<br />
t<br />
+ +r<br />
ug/g<br />
/<br />
~t : f w<br />
i is : fr~t* /<br />
ft<br />
} *" f * f<br />
t<br />
* f<br />
.375-<br />
* **<br />
t */ * w<br />
t<br />
+ *~ * 1<br />
.300-<br />
x e iww<br />
1r 1 R<br />
t<br />
~+1~ tFR f 11<br />
+ii ~ R*<br />
.075 t<br />
- ~ j<br />
t<br />
r * 1 +~ 11<br />
r * 3~<br />
.000- ~<br />
+If +~~ ~+t+l+fif~t++~l+~++t+tttlit~+ttt++ltt++t+tt~lttt+ttt+tlt~tt+tt~+l<br />
FIG. 2. Surficial sediment Cd concentration (fig/g) vs Fe concentration (%)<br />
62
Cr VERSUS F. FOR BLM2BICX<br />
ilt+r.i ...+lf+t+i.++tit+t+tr++tl+.t..++.. it .+. .++.. l .i..+t.;. l++ ttt~t~*I<br />
t<br />
i<br />
f<br />
19 .5A- I : y = 7 .73x ± 2 .24<br />
r = 0 .82<br />
ie .oo* II : y = 14 .9x - 0 .13<br />
.._------t * r = 0-755<br />
/ II<br />
/ -<br />
16 .S0±<br />
B : y = 4 .75x + 1 .52<br />
-; (Shokes, 1978)<br />
-t3: o ~~-<br />
- /<br />
13 .50 r<br />
t +**<br />
t<br />
12 .00 :<br />
t<br />
Cr + */*<br />
10 .50 =<br />
* / * * / I<br />
*~* * ~ * **<br />
u9/9 ; *<br />
*<br />
~*~* ** 1<br />
.*<br />
.uv "<br />
* tNW t k<br />
t * 1<br />
t<br />
7 .50" ~ * /*<br />
: * * i<br />
,r * 1 ,t * i<br />
6 .00- /<br />
s * *f Z*<br />
,.,.<br />
t * /<br />
4 .50 ~ t<br />
~ - .<br />
t , 1/<br />
+<br />
1 .5~- ~<br />
i<br />
---<br />
.on-<br />
+ 1 .tt+t+tt+lt+tttitF . lt+t+++tttl~ft+ritftIt+t ..t .ttlt .+.ttt+tltttti+t+tl<br />
. OOtf--e . Vm -Ft-.b0tJ---M200--fit<br />
(%)<br />
FIG. 3. Surficial sediment Cr concentration (ug/g) vs Fe concentration (%)<br />
63
.<br />
i<br />
t<br />
-- - * - . _<br />
p5 .5~-<br />
Cu VERSUS Fe FOR BLM281CX<br />
t Itt~ir~t+~l ~+++t~~~~l~+t~t~t~~lt~~+tt+~+l "~t+i~+~~lt~~t~tit+l~~t~~~~~~1<br />
t<br />
f<br />
*-<br />
I : y = 10 .7x + 2 .4<br />
42 .00!<br />
+<br />
- - - - - * --<br />
r = 0 . 671<br />
3e .so= II : y = 11 .8x + 3 .2<br />
r = 0 .385<br />
-<br />
-- 3s :oo-* g ; y -_ 24 . 7x - 4 . 55<br />
--- - --<br />
+<br />
( Shokes, 1978)<br />
31 .50-<br />
-- t<br />
28 .00<br />
Cu<br />
f<br />
i<br />
_?y "<br />
u9/9<br />
- zr .u~<br />
f<br />
17 .50; "Yr<br />
t<br />
f ~! " ~/ I<br />
14 .00. * * * * ~t**~ +r+r<br />
t x 1 * * +rw ~ 1*<br />
* - ~. **x*<br />
r 2 1 ~~*+y ~*1~<br />
t fN 1r 1t 1 * 1F * f<br />
10 .50<br />
f<br />
* tR~t ~!<br />
+ ~ *.~*<br />
1<br />
_,7<br />
* *3<br />
.007 -<br />
i * * * * **<br />
+ ~ 1*<br />
3 .50- ~<br />
t<br />
*<br />
+~<br />
~**<br />
~*xx 1<br />
t<br />
f<br />
.00+It+tit+t+tlt.rtt+titl++t+t+tt+l++ f+ttf.tltt++tt ..tl+fttttt+tl++ittttttl<br />
.nuo ZOO .400 buu .ro (/)<br />
Fe °<br />
FIG . 4. Surficial sediment Cu concentration (ug/g) vs Fe concentration (%)<br />
64
Pb VERSUS Fe FOR 6LM281CX<br />
r .. ..... .. 1++ . .*t .. *1+* ..t .+f. 1 trtt..«t 1 tit+t.t+t 1 .... ..... 1++++ rtt~t I<br />
r<br />
-" -<br />
130 .0t"<br />
i<br />
t<br />
-- --*<br />
t<br />
120 .0" i<br />
- - --- - t ----<br />
t<br />
.<br />
t<br />
100-. 07 y = 14 . 5x + 4 .1<br />
- - . -t-----<br />
r = 0 .544<br />
90 .0-<br />
II : y = 12 .1x + 15 .3<br />
-- - -- --- --;-- -- r = 0 .010<br />
80 .0, t<br />
Pb +<br />
~o .o-<br />
(Sho kes, 1978)<br />
u9/g +<br />
r<br />
f<br />
t<br />
t<br />
50 .0-<br />
1t<br />
40 .0 /<br />
t * /<br />
t<br />
t t ,r<br />
30 . 01 - r ** _. II<br />
*<br />
* * * - ** **<br />
t ~ 21 +~-! + i * +~ 1<br />
10 .0- *~~*1 * ~*i.l~ .*<br />
.0- i<br />
+tl+r++. .f4+lttt.tttttl+ ti+t+t++lt+.+t.tttlttttattttl<br />
FIG. S. Surficial sediment Pb concentration (ug/g) vs Fe concentration (%)<br />
65
Ni VERSUS Ft FOR BLM2B1Cx<br />
tl*+t+ *tt.+l ..+.*++t+l ...++.t.. lt.t+++t+ . lfittt.f.rlt.t++t++tl* .tt...t. l<br />
*<br />
r<br />
II<br />
1b .25- t<br />
f * /<br />
15 .00" ~<br />
+<br />
,~<br />
--- t<br />
- i ---<br />
i<br />
13 .75- ." +<br />
+r*<br />
f<br />
t<br />
*<br />
~*<br />
I<br />
-- tz:so= ~-*<br />
+ A<br />
11 . 25- : *w*<br />
t + +t ~ ~ t<br />
1t<br />
10 .00! ~ ~ -* w ~~ 1*~<br />
i --<br />
w 1V i<br />
Ni t*<br />
*ltt *t<br />
u9~9 ; ~ *~ * , ~* C /<br />
t<br />
t<br />
6 .25- /<br />
* ~ 1*<br />
t 1t<br />
5 .00 =~ / ^ * ~ 1 : y = 6 .32x + 4 .97<br />
r=0.682<br />
3,7s- II : y = 12 .Ox~+ 2 .78<br />
r / r = 0 .833<br />
1 .25-<br />
t<br />
t ' A . y = .72x + 9 .5<br />
(Trefry & Presley, 1976a)<br />
B : y = 8 .7x + 1 .09<br />
Soes,<br />
.UO-<br />
* It+t+itt++l+ .+.tttiil+.i+.+t+tli+++++t++ittt .ttt+. lfi.+ttr+ili++rirti*I<br />
. 2 00 CVO :'-"t .200-'---i -,-t<br />
FIG. 6. Surficial sediment Ni concentration (,ug/g) vs Fe concentration (%)<br />
66
V VERSUS FE FOR OLM291XC<br />
+1 ... . ... .. lftt+ifttfltri.t+t++l~**~+~++tl*~~+t~i~ilt*t+t~t~~l~++tt~~+fl<br />
t<br />
45 .50 -<br />
r --<br />
r<br />
42 .U0-<br />
r = 0 .664<br />
__ 38_, 50- t<br />
II : y = 12 .5x + 1 .23<br />
--357 0-0= r = 0 . 728<br />
~-<br />
3i .5o-<br />
- t<br />
- 28 .00<br />
V ; :*`t<br />
24 S~- r<br />
t<br />
u9/9 ;<br />
21 .00-<br />
t<br />
17 .5 " `"<br />
t<br />
t<br />
* --<br />
14 .00~<br />
w w l,r * 1<br />
s 2 ,r t~*<br />
x~, ~w +e ~,tt*<br />
- ,r* * ,t,~ ~ *~,t * ,r<br />
10 .50<br />
s * w *~ ,r * 11'<br />
t ~1 2 2<br />
tt*x * +1 !t * f k<br />
U -<br />
t<br />
t~ 1 1<br />
,.<br />
t<br />
/ *1**t<br />
t<br />
t / 1<br />
t<br />
.0A~i+fa+t .t.tlra++t+t+il .++iti++tl ;+rt.tt+fl+±+rttt+tl± .t+++t+tli±.ttr.t~~<br />
FIG. 7 . Swficial sediment V concentration (Ng/g) vs Fe concentration (%)<br />
(Samples circled not included in regression)<br />
67
zn VERSUS F. FOR aLMZetcx<br />
- 210:0 t<br />
r<br />
-- r<br />
19S .0-<br />
180 .01 t<br />
------+ - - I . y = 30 .0x + 5 .<br />
t es .o= r = 0 .454<br />
._<br />
-rso-:o*<br />
--135 .0<br />
---<br />
- --,<br />
II : y = 27 .2x + 33 .4<br />
r = 0 . 167<br />
: y = 34 .58x - .<br />
(Trefry & Presley , 1976a)<br />
izo .o= B : y = 36 .8x + 5 .32<br />
Zn ~<br />
105 .0"<br />
t<br />
u9/9<br />
v ,u"<br />
t<br />
t<br />
t<br />
75 .0-<br />
*<br />
60 .0 -<br />
* *<br />
(Shokes, 1978)<br />
* ~,r 1 ~ f R<br />
~. ~s~' 1* *w *,t fr<br />
45 .~~ , ~ ,r **1<br />
* +*<br />
*~ ~ I<br />
--<br />
II<br />
t +~ * 1<br />
t ,t<br />
15 .0* r ~2~~~ ~'<br />
t<br />
f<br />
,n- +It++ .++iitl .+. ++ti++l++ +++.++tl .tt+ .tt+il+ .tt+if.+lf+. .ttt+tIt±+.t.t..<br />
. ,. .,<br />
s ~q~<br />
FIG. 8. Surficial sediment 7.n concentration (ug/g) vs Fe concentration (%)<br />
68
APPENDIX C2<br />
Metal Concentrations vs Fe Concentrations from SN HN03 Leach <strong>of</strong> Surficial Sediments by Platform and Station<br />
69
Summary for CD/FE in Surfieial Sediments ' PAGE 8<br />
I,iTransect 0104 0500 1000 2400 Mean<br />
_ ''. .<br />
~ iie<br />
14<br />
" - ,4 7 .223 .730 .277 .416<br />
,N<br />
.213 .7ia ,614 , 09 .462<br />
I3<br />
,8 5 7 .568 .239<br />
'_<br />
7<br />
;06<br />
IMeen .431 .426 .448 .366 .417<br />
~~3tatlon 02<br />
~,o N ,400 ,4 8 :135<br />
i~~I 6 2 50<br />
i'' 1H<br />
. 0 .3<br />
'<br />
l~~wn<br />
_U 7i _x97<br />
.<br />
:392 .2 92 ; 406<br />
X15 ~SS7 44S<br />
~~.Stat ion 03<br />
IIE .123 .1 3 .093 = .126 .113<br />
, . S<br />
138<br />
1 2 1<br />
1 19 ; bq ; 1 40<br />
w<br />
.lal .154 ;c19<br />
, a6 3 ,24q<br />
Mean .148 .139 ,166 .277 ,182<br />
, . !Stat i on 04<br />
JE- ,442 ,131 .13d' ,243 .237<br />
121<br />
_'tAO '~Si<br />
.168<br />
,~do<br />
,iai<br />
22 ~w<br />
.666 .io3 ,1le -:051 , va<br />
M e an<br />
. 471 .1 44 ,1 4 0 ,Z02 .239<br />
12,<br />
I7!<br />
ts<br />
27<br />
StAtian pt<br />
Station 22<br />
Station 23 .<br />
3<br />
,q<br />
.187<br />
Station 24,<br />
u<br />
ui Mleand _t8Q _~71, 67 ~,A50<br />
.I54<br />
295<br />
IAA<br />
i3oj, . .<br />
71
'Summary for CR/FE<br />
1n 3urficial<br />
Sediments PAGE 9<br />
Met<br />
---------------- iTransect 0100 0500 100A<br />
~Rtatinn 01<br />
IE<br />
ii ".a27 11 .5 ze 11 .007 --<br />
N<br />
3 :491 12 .028 10 .647<br />
S<br />
!q .$66 10 .658 ~1 .919<br />
w<br />
t 2 ag >>_oeo ~_I o<br />
!Mean<br />
13,188 11 .5?.8 11 .18S<br />
11tatlon 02<br />
0- AAA a,eN: 1e_one<br />
N<br />
10,400 8 .608 9.75a<br />
10 .711<br />
Iw<br />
9 ;208 9 .810 8,90<br />
~ r M , ewn<br />
9, _ f1j 9'4p 5 t0_A 8<br />
IE~ation 03<br />
N<br />
Mean<br />
3tat on . .<br />
E<br />
N<br />
~W<br />
Meen<br />
StAtinn<br />
Ori<br />
~f<br />
Station 22 .<br />
Station 23<br />
Station<br />
find<br />
Moan<br />
24<br />
14 . 01<br />
2$<br />
15 :430<br />
14,642 .<br />
10,236<br />
9 .632<br />
2 .70 8<br />
0, 02<br />
I -!J9A<br />
14.4; 0<br />
9,78<br />
1a<br />
11 : .544033<br />
15 .383<br />
12_96<br />
11 :13<br />
13 .n38<br />
2000 Mess<br />
i1 .3e0<br />
30 .817<br />
1Q~.807<br />
t ~ope<br />
11,546<br />
la-bis<br />
10 .063<br />
10 .635<br />
8,683<br />
0,990<br />
11,026<br />
1Q,,950<br />
10 ;5;90<br />
10 .9T2<br />
~i .a3s<br />
1j7 a5<br />
.067<br />
t aso<br />
11,851<br />
to,nb_a , -<br />
9 .716<br />
10 .03a<br />
9:152<br />
Of-<br />
13.840<br />
11_618<br />
12 :070<br />
12 .873<br />
13.485 11 .984 12 .340 12 .011<br />
11 . 27 0 .789 11h -.-7365 4 .9 8<br />
A 2-CA 1-1<br />
12 .248 1 . 95 5 .509 10 . 94<br />
11 . 991 68 10.005 1 .<br />
"<br />
11-146 1_711 0-1,19<br />
8 .998<br />
9-471<br />
10 .338<br />
10 .714<br />
10-690<br />
72
I<br />
I<br />
Summary for CU/FE in Surfieiat Sediments PAGE 10<br />
!Transact<br />
Oietwncp<br />
0100 0500 ]000 2000 Mean<br />
I~ytatlen (11<br />
E 15 .968 17 .406 13 .982 16,361 1 .934<br />
N 13 .719 16 .130 16 .833 1q .296 1 .2p4<br />
3 20 .68 18.07 12 .926 13 .810 16.372<br />
Mean 16.388 16.346 :14.389 16.130 15.813<br />
'Station 02<br />
19-47 _ 7<br />
N 13 .475 19 is 13<br />
19 17 591<br />
i s 19 S44 IN N 9 14 -: 6-55 H : 31 18:069<br />
iw<br />
23 :208 l0o962 IS,756 16 . 74 16.625<br />
Moan<br />
18,012 IS-1186 4 - A& n- l in 10' .991<br />
,Station 03<br />
E 6&744 7 146 11 .941 10 .472 Hso 18.516<br />
7 - ;)9rlr 9- T4 If%- nn R-h k<br />
S 7 847<br />
049 7,199 12,766 8,715<br />
w<br />
1 2 :867 7 :407 it . 22 14 586 11 5 0<br />
Mean<br />
8 .651 8 .173 9.541 12 :475 9 :710<br />
tation 04<br />
i<br />
24-.356 4 398 1 .119 17 39S 16 889<br />
IN 1~ .602 2:3SS 111 . JSS<br />
~ 12 :21~ 1j:106<br />
w<br />
Mean<br />
IStAtinn 21<br />
Station 22<br />
Station 23<br />
P -SX6 12-1941 44<br />
17 006 15 OZ3 14 - 362<br />
21 : 132 13 : 492 12 : 38S<br />
.11 _ 3t<br />
5 266<br />
11348<br />
1 647<br />
12 914<br />
14 :6 9<br />
.ao9<br />
75b<br />
10 .92,9<br />
Station 24<br />
12.159<br />
arsnd<br />
Ap en 16 - 04S ' 13 .349 12 .592 15,165 14 .051<br />
.,<br />
. .<br />
r<br />
i<br />
73
ummary for NI/FE in Surlicial Sediments PAGE 11<br />
,fTranseet 0100 0500 1000 2000 Mean<br />
sta*i~ .. n~<br />
~JE 9,787 12,022 16,871 1 1 ,537 12 .804<br />
, 11 . 7? ~6 I g :482 153 0 .036 13 .8 9 3<br />
~ ;S 14,7 1 1~ .?~SY 11 . 61 1 .442 13 .437<br />
~Mean 11 .832 14,001 13 .829 13 .494 13.289<br />
t at i on 02<br />
~S 17 .365 16 :7922 13 .268 20 : 0 19 (6 .8481<br />
w 19 . 642 15 , 103 15 . 66<br />
] 17 5 e<br />
own<br />
17,276<br />
3 .1<br />
1 ,B i<br />
16,198 1S-d iA 41R 1A - Al 6<br />
Station 03<br />
LE .829 16.032 16 .339<br />
6 18,099<br />
3<br />
16 .606<br />
w<br />
15 . 313 l ION t.~1 6 16 .3 7 1<br />
Mean<br />
15 .328 14 .489 16 .925<br />
11 .71 ~5 . 37<br />
16_8 8 . ' 44 -<br />
10 .9 9 15 . 57<br />
15 .762 15 .Oa0<br />
13,807 15 .137<br />
tat on 04<br />
18.201 (0.912 11 .772 16 .707 1A .398<br />
IN<br />
12 . 6 1~:648 12.422 12.020 12 .079<br />
S<br />
21,<br />
,7211<br />
Q }b85 14,057<br />
!w 16 . 1 .2 6 11<br />
Mesn<br />
16.989 11 .627 11 . 11 .218 12 .906<br />
a<br />
'RtAtinn P1<br />
tstion 22<br />
Ib .ls2<br />
,<br />
Station 23<br />
. 13 .051<br />
Ststi-on 24<br />
arand:<br />
M&An, 14-078 14-499 14-234<br />
11 .236<br />
IVAlq<br />
74
Summary for PB/FE in 3urfieisl Sediments PAGE 12<br />
~tatenee<br />
75
Summary for ZN/FE in Surfitia) Sediments PAGE 13<br />
rTrsnsect<br />
N<br />
S<br />
tation<br />
Mean<br />
01<br />
(Station 02<br />
N<br />
W<br />
Station<br />
E<br />
N<br />
3<br />
w<br />
Mean<br />
Station<br />
,E<br />
N<br />
Mesn<br />
03<br />
04<br />
Rtatinn 71<br />
,'<br />
--<br />
Station 2<br />
Station 23<br />
Station<br />
sand<br />
24<br />
---------- - ----------<br />
0100 0500 1000 2400<br />
45 :943<br />
108 .479<br />
89 ;x28<br />
57 .750<br />
59 :770<br />
40,736<br />
51.220<br />
43.088<br />
Mean<br />
61 .590<br />
62 . 1<br />
71 .050 58 .079 57 .549 53.86 60,041<br />
49<br />
5,708<br />
A&<br />
.174<br />
52-AKI<br />
ell.<br />
60 .205<br />
71 .094<br />
60 .091<br />
155 .900<br />
38 .96<br />
-<br />
5 4 0 :1<br />
.1~q _n7<br />
an<br />
~ 53.619<br />
a>-17'7<br />
50 .000<br />
51 .400<br />
49,309<br />
42.627<br />
40, 27<br />
43 :~4~<br />
al - &<br />
54 .b45<br />
A>- c;7<br />
qA,990<br />
59 .83a<br />
56,Y56<br />
41 .6b7<br />
49,Aa1<br />
5<br />
I 4,568 91<br />
50 .526<br />
%A-ha7<br />
I,2a2<br />
x7 .770<br />
07.056<br />
,<br />
62.21e<br />
a2.9po<br />
_aS6<br />
a5 :2~8<br />
47- 9<br />
52 .741<br />
rid-06A<br />
5z ,629<br />
573,53q<br />
5 .226 *<br />
`75 .603<br />
a~'eZn-<br />
10 .467 40 .036 43 .726 02 .079 58 :427<br />
52.142<br />
480478<br />
42.1.77<br />
,<br />
3. .<br />
76
Trace Metals/FE<br />
in 3urfieisl Sediments - Second Cruise<br />
. Cr<br />
Fe<br />
.<br />
Ni<br />
Pb<br />
.---Cd "-"----- -----~u<br />
--------<br />
-Station<br />
05<br />
0400 ,954 !2,883 12.023 1 .000 17 .941 1 .968<br />
-<br />
,547<br />
2000<br />
3twtien<br />
~OS00<br />
11000<br />
Station<br />
0 4 00<br />
A6<br />
1 .353<br />
470<br />
,615<br />
07<br />
, 9<br />
10 .086 29,864 1 .000 21 .p92 23.326 '2:j2~<br />
18 .989<br />
16 .150<br />
23 . 1 44<br />
18'.315<br />
19 . 1997<br />
17 .720<br />
1 .000<br />
1 .000<br />
1 .000<br />
17 .897<br />
14,026<br />
17 .067<br />
34;712<br />
35,610<br />
1 ? 1 .040<br />
x 2000 :ab2 16.139 1v .973 1 .000 13 .119 27,438<br />
76.381<br />
0 .252<br />
.ate-<br />
76 .95 Z -_<br />
56:683<br />
'0100<br />
10500<br />
1000<br />
;)nnn<br />
Station<br />
E0100<br />
re 1 seo<br />
.571<br />
,461<br />
.748<br />
- ;)82<br />
09 :509<br />
_r~ee<br />
2000<br />
,435<br />
1.701<br />
1 .929 '<br />
13 .820<br />
13- -tAg<br />
12 .375<br />
Ie_An~<br />
is 095<br />
6 .086<br />
0,929<br />
26 .264<br />
19-41 7<br />
1 .000<br />
1 .000<br />
1 .000<br />
1 .000<br />
4.879 1 .000 Ono<br />
13 .3 2<br />
19,911<br />
18 .120<br />
7 067<br />
2.463<br />
2 ,363<br />
5,060<br />
28A<br />
12.795<br />
la -<br />
17,848<br />
14 044 1 .000 14 .094 . 4754<br />
64.820<br />
73 .706<br />
98.200<br />
R9 - I 1c;<br />
~d~64 1 ? _<br />
q9;j3a<br />
0100<br />
0500<br />
1000 ,<br />
200A<br />
Station<br />
0400<br />
(I an<br />
l000~-<br />
2000<br />
Rtation<br />
0 ROO<br />
00<br />
1 000 nno<br />
.b78<br />
,672 .<br />
,628'<br />
-42A<br />
il<br />
1 .402<br />
- 13-4-<br />
.732<br />
.366<br />
12<br />
jj?<br />
.886<br />
-147-<br />
10 .24<br />
9, .622<br />
10,000<br />
1 j) - 9,%4<br />
15 .805<br />
12<br />
9 825<br />
11 :826<br />
18 :717<br />
619<br />
11-210<br />
1<br />
17. 97<br />
15.226<br />
19 .235<br />
VA-P77<br />
1 ..000<br />
1 .000<br />
1 .000<br />
t-poil<br />
109 .40 ~ 1 .000<br />
18 476,<br />
17 :217<br />
26 736<br />
19 :166<br />
28 .779<br />
23-822<br />
` 13 .68<br />
14,494<br />
15 .2 14<br />
16-9; 'A<br />
18 .34<br />
I-non JA-as<br />
1.000<br />
1 .000<br />
1 00<br />
1 :0000<br />
11000<br />
1-000<br />
15.534<br />
1 9r. 745<br />
18 96<br />
14:iS4<br />
17 .RSI<br />
19- ta<br />
10.264 9,955<br />
7.442 g.9Z9<br />
15,712<br />
I -63 .636a6<br />
2 . ,7A9<br />
124 .41S /<br />
I I -9;4r,<br />
12 820<br />
14:000<br />
22 434<br />
11 :386<br />
23 .3SS<br />
19 A 4<br />
20 1.210 ~<br />
r. -9 7<br />
816<br />
6:376<br />
-<br />
66 90<br />
43A64<br />
59.008<br />
77
,<br />
Trace Metals/FE<br />
in Surfici al Sediments " Sec ond Cruise<br />
Cd Cr Cu Fe N1 Pb Zn<br />
~I Ot00ion 1 .7&6 0 1 .6! 8381 17 . 547 1 .000<br />
,<br />
V~uu<br />
11 .8J7 .069 82 .6 0<br />
- ;i ~ i- \p- 7&4 1 non 7{<br />
~ ~h~'<br />
r> >nV<br />
000 ,608 17,492 16, 816 ,2000 .453 17 .250 16 .305 1 .000 . 16 . 154 3 1 . 654<br />
6 .547<br />
'RtAtinn 14<br />
01 00<br />
; 1 .3567<br />
0 1 .000 ' , 0 6 .201 85-.9~<br />
,,0500 92 1.362 : !.0 .430 . 1 .000 '12.x86 19 .239 52 .011<br />
. 1000<br />
. 148<br />
. 1 1 . 3 S3 9 . 5 . 1 . 000 1R .9T 21 .684 56 , 203<br />
.o<br />
Station !5<br />
~710100<br />
. ,446 18 .695 13,391 1 .000<br />
111 -112 14-7<br />
Al; 1 fl' ;Oph 20 .470 63 .771 90 .331<br />
L-finn lit-r%37 90-177 A3-qpa<br />
2000 374' 14.092 19 .077 1 .000'<br />
.<br />
.<br />
ib .n25 1 7 .2 3 5 43.436<br />
e ~4ta ien fG<br />
27<br />
0500 .551 15 .882 iT,359 1 .000 16,059 G5 . 1~7 87 .2 5 5<br />
8<br />
1000 . 8 4 . 9 10 .137 , 000 14 , 902 J? . 17 8 - 57 . 977<br />
Station 17<br />
" 0100 1 . 0 2 .487 21 .767 ,000 1 .5 .86 2J . 3 .110 3 0 .875~ .'<br />
OSOO<br />
058<br />
~ 1000 .269 14 .376 8 .23 1 .000 l3 .~81 3 .2 5 . 248<br />
u010<br />
.3 2<br />
i -<br />
" 00~~<br />
. 3~ 2 ` 1 q . 226<br />
14-269<br />
b<br />
' . 1 .<br />
1b360 1 . 000<br />
10 a 1-000<br />
. 8<br />
15<br />
in<br />
. 8 3<br />
0 .8 9<br />
_12 . 845<br />
2,470<br />
1 .<br />
t ~ l S' . 565<br />
ion 19<br />
p 0t 00<br />
1 4<br />
0 on -? 14 .595 .580 1 .000 ,0 4 11 .297 104,324<br />
1597 ~aqo -3 2 A- .490 64-API<br />
.1 1000 I J515 32-RO& 13.39a<br />
,` 1 .000 1 , 4 ,0 0<br />
2000 .093 ' 25 .364 . 31 F .000 9 . 8 :13 .84! 2 R : 894<br />
Statinn >0<br />
14 0100 .388<br />
0500<br />
.307<br />
k 000 .330<br />
A<br />
u<br />
b<br />
11<br />
y<br />
y<br />
II<br />
n 131<br />
w<br />
u '<br />
_<br />
1 1 .332 0 0<br />
14 2 :491' x . 428 1 .000<br />
11 .008 10-~91 1 .000<br />
. .<br />
.. _<br />
.:><br />
..<br />
' . .<br />
6 64<br />
18 . 277<br />
1 .72<br />
, .<br />
.<br />
4, , 6t1<br />
15 . 644 6 1 , 782<br />
8 .368 07 .000<br />
: . .<br />
.<br />
78
APPENDIX D<br />
Metal Concentrations vs Percent Clay Content <strong>of</strong> Surficial Sediments<br />
79
Summary for CO/CLAY in Surficial Sediments PAGE 1<br />
,Transict<br />
---<br />
`<br />
-------------------<br />
0100 0509<br />
---- ------- -<br />
1000 200Q<br />
Mean<br />
3 tAtinn<br />
01<br />
019 .006 25 Oi l<br />
01`6<br />
N :013 028 :031 :01 :021<br />
:S<br />
.034 :035 .016 .0<br />
nI34<br />
w Olt -AIQ -QjA _nI<br />
- 0<br />
,Mean .019 -.022 .022 . .018 .020<br />
:Station 02<br />
_<br />
oN ,0 5 .015 .0 1 2 , 026<br />
'013<br />
w lots : o io : oo ° :oii<br />
-'to<br />
.Station 03~<br />
SE ,009 ,006 .004 ,006 ,O0b '<br />
63 .006 ,008 ,007 .013 .008<br />
W ,012 .016 .011 .018 ,O1C<br />
,Mean ,014 .013 .007 .016 .012<br />
" 3tation 04<br />
,006 ,009 .010 ,013<br />
roN .<br />
;022<br />
.013 .00z<br />
A<br />
_n e _ete<br />
: :<br />
`.006 .014<br />
_o1 _e3 a n 7<br />
27q .025 .01~ .009 .009 ,Olq<br />
Mean .030 .O1 .009 .016 .017<br />
u . ."<br />
-<br />
.021<br />
`<br />
-<br />
a .<br />
pStation ZZ _ .<br />
:Station p<br />
23~<br />
,010<br />
Lotion 24 -<br />
.007<br />
~~~rend<br />
.,~r~~<br />
non ntc n~11<br />
. .<br />
..<br />
, .<br />
.r><br />
Y I _ .<br />
81
Summary for CR/CLAY in Surtieial Sediments PAGE 2<br />
,Transec t aioa 0500 1040 2000 Moon<br />
., _<br />
" E - : 509 333<br />
~~37 ,q40<br />
~S<br />
,563<br />
.588 .64 .8 .81 ,485 .63<br />
Mean` .64 .645 .670 .565 : .631<br />
tetion 02<br />
. . e44 274 R6 5 :H! 1 396<br />
, . .515 :261<br />
1 1w , 109<br />
, 517 ;23 7<br />
: 07<br />
. 277<br />
13<br />
U Station 03<br />
.070 . .719 , 70 .493 .738 :<br />
"" 3<br />
.718 .96<br />
W<br />
1 . ~80~ .626 .8J7<br />
317<br />
1 . 119<br />
,Mean 1 .276 1 .035 .613 59 ,664 39q .8 ,897<br />
6<br />
t Station Oq<br />
2 0 ~E .614 .592 .779 .198 ~6 1 p<br />
2 1 1 .Sv7 1:012 .454 .467 . .8 0<br />
22~N<br />
.Mean<br />
u<br />
45 4<br />
.823<br />
1 .266<br />
1 .019<br />
,9 J<br />
,88<br />
1 .0 4<br />
.7 6<br />
.919<br />
.875<br />
" = - .aba<br />
Station<br />
1<br />
22<br />
71<br />
:Station 23<br />
1 IStst<br />
E on 4<br />
'i6ran d<br />
' Mean .791 762 _6GC S6A<br />
.426<br />
.ASO<br />
-(AA<br />
A(((<br />
A(r . .<br />
N<br />
82
mwarY for CU/CLAY in Surficiel Sediment* PAGE 3<br />
,Transeet<br />
0100 0500 1000 2000 Mean<br />
.ttAtinn al<br />
~E .712 .502 .ae3 .91! .652<br />
,N .822 .629 .809 ,581 .720<br />
5<br />
.809<br />
1 . 09 8<br />
. 878<br />
. 619<br />
. 85 ~<br />
~ w<br />
_,7op<br />
l ., :e8<br />
I .1A1 Lees l,eo<br />
7 rMeea<br />
.785 .884 .847 .799 ,828<br />
~Itstion 02'<br />
F649<br />
,b7S OR(LS<br />
,681 ~6C2<br />
IOIN<br />
'6J0 ,561 .689 .676<br />
3 1 .102<br />
.4 1 . 479<br />
. 049<br />
. 612<br />
M ,375 .SaB 395<br />
_<br />
3 .5Q3<br />
..Station 03<br />
.3E .498 .S4a .443 .279 .4d<br />
S Y 1 1 .96 :750 :517 :553 :7q7 ~'<br />
Mean , 66 .691 . .431 .788 ,669<br />
.. It at on Oq<br />
20<br />
1 .463 .632 ,7 a0 ,702 .884<br />
r~, N . 06 1 .084<br />
. i .a8<br />
, 4<br />
1-3717<br />
lk 21<br />
221Mean v 1 :58 42<br />
5*313<br />
3 979<br />
0 X161 1 881 X845 1 :91 4164<br />
:.<br />
a . . .770<br />
Station 22<br />
, 1-490<br />
M<br />
,Station 23<br />
.503<br />
3, Stat on 4<br />
»Arand<br />
., ono non ~.~~ per.<br />
.544'<br />
' _Ate<br />
83
~<br />
Summary for FE/CLAY in Surtieiel Sediments PAGE 4<br />
,~Trsnsect<br />
0100 0500 . 1000 2000 Mean<br />
I f tatinn ! 1<br />
.045 .0 9 ,0 .056 ,Oa ]<br />
,4 ,060 ,0391 ,050 ,001 ,0 547 .<br />
' W ,0 ~ ~OqS 095 ~ASL 093<br />
7iMeen .049 056 .059 ,049 .053<br />
-<br />
ojS<br />
E<br />
tAtSOR<br />
f<br />
0Z<br />
0<br />
~3 .056 ;02' .033 .0 0 ,034<br />
A M&An<br />
.016<br />
-044<br />
.053<br />
-017<br />
.027<br />
.040<br />
00 4<br />
.0 7<br />
.030<br />
-017<br />
.Station 03<br />
E<br />
' IN<br />
.07Y<br />
_156<br />
.0 50<br />
_f38<br />
.044<br />
_~30<br />
.045<br />
-086<br />
5<br />
63 ,OqS .066 .0ggg7 .0 .060<br />
Mean .090 .088 .0~5 .060 .070<br />
,t on On<br />
E .0601<br />
.044 .065 ,040 .052<br />
.083 .002<br />
3<br />
'06 _ 2<br />
~~<br />
O T : 098<br />
2iYi , 038 . 10 . 070 .186 .09q--<br />
,Mean<br />
,080 .087 .071 .093 .082<br />
Station 21<br />
s , ` OSS<br />
t o S t a t i on 22<br />
-101<br />
-<br />
,Station 23<br />
p , 0040<br />
Scation<br />
.<br />
2T<br />
,0a5<br />
la rsn d<br />
3 Y- ~w ALC f1L7 I1Ci AC7<br />
ALA<br />
q' . .<br />
N f<br />
nF - .<br />
84
.<br />
ISummary for NI/CLAY in Surficisl Sediments PAGE 5<br />
,Trsnsect<br />
a<br />
0100<br />
-------------------<br />
0500 '1000 2000 Mean<br />
,416 ,307<br />
.Sa3<br />
.698 .5~6<br />
~IS 578 ;9273<br />
76g 3 ,558 .707<br />
A0 f_tAt 1,Ot~f ,91A<br />
X 918<br />
~iMesn . 574 .77Q<br />
~ .783 .665 .<br />
.698<br />
tstion 02<br />
*AIR -5A<br />
+oN 1 .087 .502 .Su9 , 6a7 .706<br />
3 .979 ,453 .Y34 .399 .566<br />
w 7 ,796 04 16 O J 13 .460<br />
13<br />
Atatlon 03<br />
4E .242 .797 .712 . .5 ~ 24 ~ . 3 B~ Q<br />
1 .9 9 -c%77<br />
.754 1 .1 6 .9 0 .784 ;921<br />
7 M<br />
1 . 307<br />
. 2x8 .857<br />
,59<br />
7 1 .012<br />
~,Mesn 1 .315 1 .208' .768 .839 1 .032<br />
1 .3iai on ; -04<br />
_<br />
E ° 1 .092 .479 .766 ` ,679 ` .752<br />
s,N 1 .964 100J2 . 312 ,477 ,996<br />
nN .616 .161 .79 1 .016 ,896<br />
Mean<br />
1 .247 1 .024 .839 .828 .984<br />
24 q<br />
n$t,ation 22<br />
. 731<br />
_<br />
:Station 23<br />
. . .584<br />
~seacion za<br />
.503<br />
"arsnd _<br />
Ma-an .971 -A9A -7%9 -70A -790,<br />
w<br />
u<br />
N<br />
q<br />
M<br />
b<br />
II<br />
~7<br />
43<br />
N . .<br />
4 1<br />
w<br />
v<br />
y<br />
17<br />
U<br />
r<br />
,.<br />
. . .<br />
'<br />
4<br />
85
.<br />
Summary for PB/CLAY in Surficial Sediments PAGE 6<br />
--<br />
' Transact -------------------<br />
0304 0500 ----------<br />
----- 1000, --<br />
-'2000 f ''Neon<br />
827<br />
1 .328 .904 .865 .814<br />
, I 3 .430 1 .16'<br />
~_eb4<br />
,982<br />
. 0<br />
t aat<br />
~ , :ae<br />
1 , ~g~<br />
1 .070<br />
t ion<br />
'Mcan 1 .236- *999 , 1 .001<br />
'.929 1 :.041<br />
cation 02<br />
. .<br />
' o<br />
-947<br />
,44 - 910<br />
,<br />
S 1 . 6<br />
;90v} .q79<br />
.719<br />
.477<br />
6 580<br />
.j63 1 .<br />
wean<br />
2 6g4 :661 .2I9,A ~b6~<br />
,.Station -03<br />
~3E 1 .604 1 .033 .790 ,834 1 .065<br />
165<br />
s w<br />
2 .5l0 .600 ~77<br />
~Mean<br />
,551 1 . 59<br />
2 .144 1 .438 ,759 1 .166 1 .76<br />
, . tat<br />
,<br />
on OY<br />
.<br />
!N<br />
2.987 1 :.068 1 .4iZ 1 .382 1, .) i2 ,<br />
~ 2.652 .809 ,020 ,76<br />
, 560<br />
2 , qq<br />
. uq6<br />
Mean<br />
2.338 1 .997 1 .63 72<br />
'<br />
5<br />
1 .55 1 .882<br />
,,Station 22<br />
Station 23<br />
" 1 .022<br />
a, J tat 7on 24<br />
33 arend<br />
a.<br />
u<br />
x<br />
77 :<br />
52<br />
r<br />
A<br />
b<br />
L<br />
42<br />
Y<br />
U<br />
46<br />
4<br />
Y<br />
I N<br />
31<br />
.<br />
-<br />
L<br />
A<br />
..<br />
- .<br />
86
Summary for ZN/CLAY In Surf ;eia1 Sediments PAGE 7<br />
,1ransact 0100 0500 1000 2000 Mess<br />
o<br />
-<br />
Jan 01<br />
" StAt E ; 720 1 .222 2 .932 .702 .644<br />
,N 2 .751 3.86 3 .014 2 .082 2 .833<br />
~s 4 .242 3 .508 ,768 .932 1 .112<br />
7Mean 3 .246 3.Obq - x.135' .641 3.032<br />
Station _02 .<br />
AI x,797 z,feo<br />
=H<br />
2 .886 ,860<br />
' 1 .207<br />
2 .6n5<br />
1 .373<br />
.148<br />
1 .160<br />
,824<br />
1 .661<br />
1 .369<br />
--<br />
.Ststion 03<br />
,E<br />
3.849 .667 2361 22 9 .2.789<br />
.<br />
2.736<br />
i . 9 .81<br />
30 1 .810 4 .053<br />
~Meen 5 .379 4 :2Q9 . 2 . 541 2 . 770 3 . 73Y<br />
~<br />
I.Station OA<br />
- --<br />
roE 9.3585<br />
T'1 2.710 2.510 4 .111<br />
6.258 ,574 2 .06Y 1 .706 3.400<br />
a_7R .2 4-101<br />
7w<br />
789 4 :775 ~'~ '' ~ 0 0 ,0<br />
M<br />
8 . 60<br />
ean<br />
6 . 37<br />
1 3915 3 . 072 3 .114 4 .318<br />
I<br />
.7k Lotion 22 \<br />
IS<br />
,~3tat ion 23<br />
, "<br />
: Station 2q<br />
=<br />
a tsRAfld<br />
2 .133<br />
- - - ,,<br />
1 .88$<br />
4_322 3_22? 2_6i1 ~_oAa' 7_a71,<br />
L_.-- . .<br />
a,<br />
w<br />
A<br />
_T<br />
87
.<br />
(Trace Metals/CLAY in Surficial Sediments - Second Cruise<br />
,Station 05<br />
Cd Cr Cu Fe Ni Pb<br />
- - - J--"--<br />
'losao ~o~~ 'iaa ' ;na<br />
~ I 1000 07 959 428<br />
, 2000 :107 :795 :35 3<br />
;037 .664<br />
'c43 1 .993<br />
. 082<br />
:<br />
,63'1 ~~n---1 .60 6--<br />
079 1 .693 1 . 838 5 .730<br />
,f0500 .009<br />
' ~<br />
.345<br />
3;2 018 .325<br />
oj1000 .O1<br />
631<br />
.465 1 ! 51<br />
2 ;689<br />
2000 -at<br />
K .&Z<br />
. .029 ,004<br />
;<br />
- 020<br />
1, 25<br />
-<br />
79;7<br />
,311<br />
o<br />
107<br />
Station 07<br />
X0100 .012 .703 ,538<br />
ormh<br />
.030<br />
. 18<br />
-<br />
2,42 741<br />
nj<br />
3 .677<br />
-<br />
- 4<br />
2,323<br />
11000 ,007 005 .Y96 ,413<br />
.2000 : .014 ,q76 .442 :029 ` .387<br />
1 .782<br />
.809 1 .672<br />
100 010<br />
: 1,01500<br />
:009<br />
81000<br />
;)non<br />
.031<br />
-all<br />
Station 09<br />
,10100 .049<br />
OS80<br />
- .0vt<br />
21000 .046<br />
000<br />
. 043<br />
:<br />
t4nn Ifl<br />
.01 ID 097<br />
0 00<br />
:.<br />
140<br />
1000 .061<br />
-pea<br />
.223<br />
.285 428<br />
158A 1 .404<br />
s I<br />
1,179<br />
-Aah<br />
1 :5db<br />
447<br />
1 464<br />
:012<br />
.972 .<br />
1-950<br />
- 91<br />
.,1,417<br />
1-24A,<br />
:4*)U<br />
1 397<br />
018<br />
:020<br />
.042<br />
-0 I a<br />
109S<br />
-054<br />
JUJ<br />
09<br />
1 :5 :183 11 :141<br />
09 :90 0<br />
1 .8h', 69 .097 ., .<br />
- -1 .17A .9 0<br />
.235<br />
.407 7 N3089<br />
761 1 .47 4 .126<br />
-&C;4 77<br />
&7<br />
1*219<br />
-982 07 10 S110<br />
1 :370 J:577 -S 4 31--<br />
40<br />
2 463 4 : i 4a<br />
;5 ' T.c4ft -<br />
. . IOS56<br />
1,4 8 -<br />
IN 6ft<br />
1.517 6.J83<br />
9 4A<br />
Sta ion 11<br />
:0100 .101 1 .137 7,869 - .072 1,3J9 9,949 14,474<br />
, 2000' .045 1 .44q 2 .10 3 _ . 12 2 2. x 11 1 . 30 : . ~ 6 . ~ 8 8 -<br />
. .<br />
12<br />
~0100 ,030 .4 39 1 .092 .0 t<br />
, 0500<br />
,916 .712<br />
, 054<br />
. 841<br />
1 . 518 .079<br />
000<br />
:1; 13<br />
.451<br />
.086<br />
1 .097 2 .808 .098<br />
1 . 1 41 2.279 .758<br />
4Z -<br />
l - ., -<br />
,<br />
';..<br />
8g
'<br />
Trace Metals/CLAY in .Surficiel Sediments - Second Cruise<br />
Cd Cr Cu Fe Ni Pb Zn<br />
~t~pion<br />
13-OA6 ~ 1 .00 1 .072 . . .061.<br />
.~3<br />
1000 .019-<br />
~ 0 .500 .030<br />
,2000 .010 .399 .378 ,023<br />
.7J2<br />
~ ,a ~ ,409<br />
.37q<br />
1 .653<br />
o?e<br />
.874<br />
.733<br />
5 .047<br />
,PRA<br />
.830<br />
1 .610<br />
'0100<br />
,,0500<br />
1000<br />
'f2000<br />
.161<br />
.018<br />
.012<br />
_013 _<br />
a<br />
Station 15<br />
'~0400<br />
o 00 '_o~a<br />
038<br />
,2000 .<br />
Statinn<br />
X0100<br />
,0500<br />
000<br />
1000<br />
,Station<br />
1 9100<br />
1000<br />
,2000<br />
I3tatinn<br />
0100~<br />
X0500<br />
000<br />
.' .026<br />
16 1/<br />
.062<br />
.016<br />
.016<br />
.02<br />
2 .1 6<br />
.596<br />
1.079<br />
_b69<br />
1 .609<br />
t_S4 'A<br />
17<br />
,093 1 . ;66<br />
p _866<br />
,011 .953<br />
,015 .808<br />
to<br />
.016<br />
,oL4<br />
.007<br />
6<br />
.465<br />
.753<br />
_522<br />
l .~al<br />
_ 411<br />
.i 3<br />
.045<br />
.081<br />
_aSn<br />
,085<br />
,oo~<br />
1 .760<br />
.557<br />
1 .220<br />
_eA4<br />
1 .744<br />
t,S~~<br />
7 .847<br />
.858<br />
1 .766<br />
_746<br />
5 .432<br />
a ~~n<br />
29 . 3S1<br />
2,321<br />
4 .577<br />
~_a~7<br />
7,694<br />
7 71~<br />
.970 .625 .069 1 .131 1 .187 2 .490<br />
1 .319 ,4a5<br />
.460 .503<br />
.806 7 ,604<br />
79<br />
.4e3<br />
.451<br />
.276<br />
`1 .322<br />
_473<br />
.481<br />
,463<br />
.~0i<br />
. 351<br />
.318<br />
,0 7<br />
.029<br />
.056<br />
.061<br />
_04 ;<br />
,OSO<br />
.056<br />
.oa4<br />
.033<br />
. 0049<br />
1 .1<br />
,465<br />
.84<br />
,964<br />
_702<br />
,883<br />
.757<br />
~~<br />
.424<br />
.306<br />
,u 1<br />
1 .308<br />
1 .30q<br />
14 . ~69<br />
A , ~SZ<br />
2 .690<br />
1 .305<br />
.910<br />
.535<br />
. 8<br />
6.300<br />
2.528<br />
.26<br />
20,09q<br />
:_g~_<br />
3 916<br />
2.541<br />
~'.iza .<br />
.637 .<br />
.663<br />
Station 19<br />
0100<br />
U-NOO<br />
,000<br />
OOQ<br />
Spition<br />
0t00<br />
0500<br />
1000<br />
2-000<br />
,013<br />
-004<br />
X020 `<br />
005<br />
20<br />
,029<br />
,012<br />
,012<br />
1 .500<br />
I-7QS<br />
1 .652 T<br />
.892<br />
,913<br />
.559<br />
,405<br />
-192<br />
.574<br />
-479<br />
.395<br />
.426-<br />
,103<br />
- 13,;<br />
.1g3<br />
.0 8<br />
.9 4 ,0<br />
~ .363 .039<br />
,-482<br />
,037<br />
47 .010<br />
2 .678<br />
2-974<br />
62 4<br />
1,704<br />
1 . 6<br />
.705 '<br />
,468 461,<br />
1 .161<br />
1-131<br />
` . ,0 0<br />
.804<br />
1 .06q<br />
.603<br />
,30B<br />
10 .722<br />
A-4;79<br />
6.905<br />
'6,731<br />
,382<br />
.7 2 9<br />
-<br />
89
APPENDIX E<br />
Metal Concentration vs Hydrocarbon Concentration in Surficial Sediments by Platform and Station<br />
91
Summary for CD/HC in Surficial Sediments PAGE 15<br />
Distanee<br />
Transact 0100 0500 1000 2000 Mean<br />
station 03<br />
E 000 ,007 .010 .006 ,006<br />
N :014 .01 4 ,029 .068 .029<br />
5<br />
,006<br />
W<br />
,004 .007 .034 ;004 ,022<br />
Mean ,007 .008 .017 .034 .016<br />
Stet on 04<br />
E ,032 .006 .007 ,005 ,012<br />
N ,028 .013 .007 .008 .Oly<br />
W<br />
Mean<br />
~Satien 21<br />
Station 22<br />
Station 23<br />
,000<br />
.054 .007<br />
6y . . 082 049<br />
:004- 033<br />
02G .022<br />
3<br />
.005<br />
.u<br />
012<br />
.015<br />
Stat i on q<br />
.003<br />
Grand<br />
Moon _e141 _o?I _017 046 X019<br />
93
Summary Ior tR/MC in Surfitiat Sediments PAGE 16<br />
Distance<br />
Transact 0100 0500 1000 2000 ~ Mean<br />
Station 03<br />
E .486 .858 1 .689 ,551 .896<br />
W ,457 .498 1 .63 1,984 ,9~6<br />
Mean .647 .657 1 .311 1 .269 ,9 1<br />
tat on 4<br />
,74q ,578 ,609 .263 ,548<br />
0<br />
1 9 5<br />
5962<br />
. 4q 3 : 4<br />
~<br />
. .3 9 2 ~ . 3Q3 X8 2 96<br />
. ~ ~ 0 T5 .3~<br />
3<br />
Mean<br />
1 .342 .570 .q38 .903 .813<br />
Station 21<br />
Station 22<br />
Station 23<br />
V<br />
.395<br />
,607<br />
S tat i on 4<br />
.228<br />
drand<br />
Mean .822 .717 .766 1 .160 .625<br />
94
Summary for CU/HC in Surficiel Sediments PAGE 17<br />
Dietanr'<br />
----------------------------------------<br />
Transect 0100 0500 1000 2000 Mean<br />
Station 02<br />
N<br />
S<br />
1 . ;46<br />
, 587<br />
11 """<br />
3 .894<br />
1,.51<br />
4,065<br />
1 .1 31<br />
.289<br />
1-991<br />
1 .151<br />
.695<br />
2 .869<br />
- 1 -274 -<br />
5 .73y<br />
, 972<br />
8.339<br />
4 .S71<br />
3 .074<br />
.846<br />
3 .647<br />
l9<br />
Station 03<br />
E .226 .649 1 .117 .3 12 ~ .53<br />
76<br />
0 i-<br />
S .35v . 41 351 1 .464,6~-2<br />
W ,3B1 .33q 1 .733 1 .388 .959<br />
Mean .370 .451 1 .005 1 .616 .860<br />
Stetson 04<br />
E 1 .772 .617 ,578 .371 .834<br />
. ; 0~ ~ 'S ~ ~ 6 _ 21 . ~ 0 ~ 96<br />
C<br />
~A7S 1 6 69<br />
w<br />
, 000 .1 8 ;<br />
. 3~ 89-3~ 5<br />
Mean<br />
2 .90q .625 .405 ,984 1 .249<br />
RtAtiftM PI<br />
Station 22<br />
Station 23<br />
Station 24<br />
6rand<br />
M&wn 1_ :9S _962 819<br />
.477<br />
615<br />
.713<br />
.258<br />
1,890 893<br />
95
Summary for FE/HC in Surficial Sediments PAGE 18<br />
Distance<br />
Transact 0100 0500 1000 2000 Mean<br />
tstion 03<br />
E .034 .059 .110 ,050 .063<br />
N * 8 -080 .086 .203 110<br />
S 45 .3<br />
W .030 ,045 .154 .095 ,0 UOU<br />
81<br />
Mean .045 .054 .099 .1 .15 .078<br />
Station 21<br />
Station 22<br />
. 3<br />
.042<br />
Station 23<br />
" .057<br />
S tat i on<br />
.021<br />
brand<br />
Mean .073 .066 066 118 .059<br />
96
Summary for NI/HC in Surfitial Sediments PAGE 19<br />
Distsneg<br />
Transett ------------ 0100 -----------------------<br />
0500 1000 2000 Mean<br />
tation 03<br />
~ JVz<br />
1~ 'o'1` n f '~c'i :'~Rd~<br />
w ;u54 ,573 2 .5 6 1 : 1 :263<br />
Mean .670 .761 1 .674 1 .686 1 .197<br />
S tat i on 0 4<br />
E 1 .323 ,468 .598 .356 .686<br />
1 .714 1 .003 ,512 616 ,961<br />
S<br />
3 _ 7 a 6 324 2407<br />
1 8<br />
Meen<br />
2 .2000<br />
j8<br />
64 :5~8 .~2 .945 1,052<br />
3iwtien 21<br />
- ;~C53<br />
Station 22<br />
503<br />
Station 23<br />
" .62B<br />
Stat i on 2 4<br />
grand<br />
Moan 1 - 229 984 1 , 008 1 , 73S<br />
.239<br />
872<br />
97
Summary for PB/MC in Surticisl Sediments PAGE 20<br />
Distance<br />
Transact 0100 0500 1000 2000 Mean<br />
tation 03<br />
N 1 . 633 1 . 176 1 . 544 2 ~na7 1 .7 00<br />
!W) ovv 3:58<br />
W<br />
, 8i 2 .712 2 .289 1 .38 1 .314<br />
Mean 1 .050 ,921 1 .656 2 .085 1 .428<br />
tat on 04<br />
3 .618 1 .043 1 .103 .730 1 .623<br />
2 .3A4 1 .774 1 .OQ0<br />
'999 2 .s a7<br />
w 29 . 5 bbd<br />
0411<br />
Mean 3 .037<br />
1 .081 .839<br />
1 .888 1 . 11<br />
Scstion 21<br />
Ststlon 22<br />
Station 23<br />
.5<br />
.801<br />
1 .449<br />
Sta ti on u<br />
.512<br />
6rend<br />
Mean 1 .709 1 .127 1,180 2 , 024 1 .164<br />
98
Summary for ZN/HC in Surficial Sediments PAGE 21<br />
Distance<br />
Trsnsect 0100 0500 1000 2000 Mean<br />
Station 03<br />
E 1 .749 3 .183 5 .998 2 .5J3 .3~3<br />
2 .107 2 .319 9 :N? 4,547 4 . 5<br />
Mean 2,680 2 .644 5 .744 5 .195 4 .065<br />
S tat i on 04<br />
11<br />
W<br />
Mean<br />
StAt4nn .71<br />
Station 22<br />
15 : 46 1 1 : 805 2 .02 2 .206 3 . 197<br />
l .f 4 1 .0<br />
9 : 047 " 7 2 :1 85 ' 1 .602 A . 34 4,229<br />
11558<br />
1,90S<br />
Station 23<br />
" 3 .026<br />
Stat i on 2 4<br />
6rand<br />
lSesn a_9li2 3-186 ~ 'A8a<br />
.896<br />
2B6 3 .028<br />
99
Trace Metals/Ht<br />
Station OS<br />
in Surficial Sediments - Second Cruise<br />
Cd Cr Cu Fe Ni Pb Zn<br />
----- --- ----- - ------ - ------ - -- ---- ------<br />
,860<br />
Station OT<br />
0100 .013 .760 .582 .033 .560 3 .97<br />
OOA 95A -Q?7 -40.6 1 .764<br />
"San<br />
2000 .013 .066 .q32 .0 9 .379 ,792 1 ;63<br />
ion 09<br />
Station 11<br />
0100 .179 2.016 13 .954 . 128 2 . 9 15 .869 25 .665<br />
91000 .132 1 .7 0 9 .1 0<br />
.9 p 4 454<br />
2000 .052 1 .686 .QSq .143 .614 1 . 96 8 .036<br />
100
Trace Metals/HC<br />
in Surfieiel Sediments " Second Cruise<br />
Cd Cr<br />
----- - ----- - ----- Cu - --- ---- Fe ---- ---- Ni<br />
Pb<br />
Zn<br />
-------- ------ -<br />
Station 13<br />
0100 .007 .162 .173 .010 .117 .267 .815<br />
0500 010 49 2u5 015 ,201 ,403 .950<br />
2000 .01 .665 .630 ,039 .623 1 .220 2 .680<br />
Station 15<br />
0100 .011 .486 .345 .026 .527 1,6y1 2 .324<br />
05 0_ - .018__ 8u1 513 050 829 2 .5_15 v .206<br />
f o 0 0<br />
. 3A33 ~~:lTt<br />
2000 .022 .833 .537 .059 .971 1 .019 2 .569<br />
Station 17<br />
0100 .070 1 .030 .997 ,046 .727 10 .684 15 .152<br />
050 o<br />
U12<br />
. 7 01 60 . 1361<br />
2000 .021 1 .109 .63 .077 1 .040 1 .793 3 .490<br />
Station 19<br />
~x5q00 .004 1 .604 .050<br />
'~~ 0 .125<br />
.053<br />
2000 0 6 . 31<br />
2.796 1 .040 8 .067<br />
I : 1~} . 00 ` 2 : 976 ~-<br />
78 .039<br />
Station 20<br />
40 2 1 .211<br />
0500 .028 1 . 4<br />
1<br />
1<br />
1000 .017 .582 .550 .053 .673 .443 2 .489<br />
2000 .112 3.021 4 .700 .258 4 .001 5 .906 14,237<br />
101
APPENDIX Fl<br />
Concentration <strong>of</strong> Trace Metals in Downcore Sediments<br />
103
DOMNCUpE SEDIMENTS -<br />
TRACE MFTALS<br />
PAGE 1<br />
0<br />
Sample LwbPl Core Sen Cadmium<br />
cm un/n<br />
1R0501FN05nn7H3 0 .0-10 .0 .SP6<br />
78OSOiPN0500?93 10.0-?O .D ,30?<br />
7e0501PNO500203 20,0-3n.0 .390<br />
780501PN0500263 30,0-40,0 ,421<br />
180901Prio500703 40,0-50 .0 ,415<br />
1nO5n2PN05O0?N3 0,0-10 .0 .436<br />
780502PN0500793 10 .0-I3 .5 ,459<br />
7R(15~2PN05002fIT 13 .5-16,0 ,457<br />
7R0502PN0500793 16 .0-26.0 ,449<br />
780503PNO500781 0 .0-10,0 ,554<br />
78OS03PNn5np7y3 10,0-20,0 .644<br />
780503PN05002B3 20 .0-30,0 ---- ,709<br />
7f10503PN05O0?81 30.0-40 .0 .696<br />
7P0503PN0500?Ni 40 .U-50,0 ,6A6<br />
780504PNnS00PP3 0.0-10 .0 .411<br />
7NO5naVNOSAo?A3 l0,0-12 .0 , ;aB<br />
780504PN05002A3 12 .010,0--- - ,345<br />
780504FN0500 ;)83 14,0-22 .0 ,064<br />
780571C ?US 0.0-10,0 --- .561<br />
780571f J83 10.0-20 .0 .557<br />
7805?lf ?N3 20,0-30 .0 .535<br />
780521f 203 30,0-40,0 ,561<br />
780521C 28t 40,0-50 .0 ,605<br />
780522f ;) B's 0.0-10,0 .301<br />
780572t 7P3 10.0-20 .0 ,650<br />
780522C 763 20 .0-10,0 .641<br />
7P0572C 283 30.0-40,0 .632<br />
7RQ522C PA,; 40,0-50 .0 .623<br />
750573C ?N3 0 .0-10 .0 ,177<br />
78n573c 2N3 10 .0-20,0 .271<br />
76e573t 7R3 70,0-30 .n .?,SO<br />
780S73f 203 30.0-40 .0 ,260<br />
780573f. 203 40 .0-50 .0 ,309<br />
780524r 783 0 .0-10 .0 .236<br />
780524C 2H3 10,0-20.0 ,216<br />
7005?nt 79S 70 .0-30.0 .535<br />
7Pn52ur 2n3 30 .0-4n,0 ,SR3<br />
Chromium copper Iron Nickel Lied Zinc VANADIUM BARIUM<br />
uq/a ua/n x uv/4 uo/a uo/a ua/o uo/o<br />
14 .P _ _ 14 .9 1 .50 13 .5 10 .6 43,9 9,6 69,6<br />
13 .A i6 .7 1 .54 15 .0 13 .1 46 .4 -- 10 .R ~ 35 .7<br />
13 .8 16 .6 1 .19 15,0 12 .6 44,9 12 .6 --<br />
11 .4 16 .9 1 .23 14,3 12 .1 41 .4 _ .__. 10 .4 . 95 .6<br />
13 .5 17 .6 1 .50 15 .2 13 .S 46 .4 13 .0 14A,6<br />
P.2 14 .6<br />
1 .03 .14 .1 . ._ 11 .1 37,9 4 12 .4 76 .0<br />
8.6 14 .2 _ . .<br />
1 .06 14,5 _<br />
.0---<br />
10 .1 0<br />
------i0.4 . .-- -<br />
- -46 .K - .<br />
R.2 13 .8 1 .05 13 .7 9 .7 19,4 11 .0 103.0<br />
8.0 14 .1 . . . 1 .02 13 .9 A .7 .. . 38 .4_- . . . . .. _ . 10 .2 _ 32 .2 -<br />
15 .7 18 .0 2 .07 17 .1 12 .6 50 .8 11 .5 61 .0<br />
15 .4 19,8<br />
1 .05 1P .q _,-<br />
_ 13 .5 _ . 54 .3 14,5<br />
15 .6 -- ---- 22 .0 ---- ---- 1 .65 -- - ~ 18,6<br />
13 .5 51 .3 15 .s ~ E0.0'<br />
14 .9 22 .2 1 .07 19,0 13 .5 53 .3 15 .7 61 .0<br />
15 .7 22 .7_ 1 .28 . 19,7 . . 13 .1 . .56, " 8. 15 .1 . --<br />
10 .7 16 .8 1 .24 15 .0 11 .6 49,4 7,4 --<br />
13 .5<br />
- 18 .1 -<br />
. . . .<br />
. .. . 1 .72 15 .6 11 .6 51 .8 9 .6 --<br />
11 . 4<br />
I R .1<br />
1 . 39 . --- . ..- 17 .1<br />
-- ---- 10 . 9 ---- -----53 .8 . j'--- - ._q 3. s<br />
-<br />
10 .0 16,1 1 .17 iR,0 13.5 55 .3 10,6 140 .6<br />
10 .1 18 .5 1 .l9 15 .0 _ _ .----~6.0 - ---<br />
13 .5<br />
._I O<br />
.P------ 7N .0<br />
10 .0 18 .9 1 .4S 16,1 12 .6 49,9 11 .6 86 .11<br />
9 .S 18 .9 1 .23 15 .2 13 .5 4e,9 17 .2 100 .2<br />
10,6 19 .6 x,66- -- 16 .3 _ 1a .0 b9.4 12 .6 61a-<br />
9 .1 19,0 1 .63 14,8 14,0 47 .4 12 .6 103 .4<br />
8 .H 12 .1 .93 12 .3 9 .7 4 .9 ._<br />
40 .0<br />
10 .1 17 .3 1 .08 15 .2 11 .6 47 .4 10 .2 120 .0<br />
8 .6 16 .6 ,98 15 .4 9,2<br />
9.2 45,4 9,5 178,6<br />
7 .4 ff .1 .8n 13 .7 _<br />
--- 3N .4 - ----6 .2 i1B .6 -<br />
9 .7 16 .6 1,59 15,3 12 .6 44,9 A,7 181 .0<br />
14 .4 14 .9 ,54 14 .5 14,0 09,q 104 , 96 .6<br />
11 .1 14 .9 1 .26 12 .8 12 .6 43 .4 7 ,6 --<br />
11 .7 15 .4 1 .30 13 .6 12 .6 47,4 9,0 --<br />
11,9 15 .0 1 .31 14,1 13 .1 46.9 9,4 118 .R<br />
12.4 13 .8 1 .27 13 .7 12 .1 41 .4 10,8 110,4<br />
.0 6 .6 ,9? 9,0 11 .1 32 .0 7 .R --<br />
10 .1 9 .3 1 .04 11 .9 6 .7 39,9 11 .1 50 .6<br />
9.0 1P .7 1 .29 17 .2 t2 .1 53 .3 9,3 87 .6<br />
12 .? 19,6 1 .6h 1R,1 13 .1 54 .8 0,6 55 .E<br />
* Below detection limit
APPENDIX F2<br />
Concentration <strong>of</strong> Trace Metals in Downcore Sediments<br />
107
10<br />
20<br />
30<br />
CM<br />
40<br />
50<br />
0 50 100 150 200<br />
BA (PPM)<br />
BA/FE (x10-4)<br />
FIG. 1 . Barium concentration (ppm) and ratio <strong>of</strong> Ba/Fe concentrations with depth (cm) in downcore sediment<br />
sample from C22.<br />
109
10<br />
20<br />
30<br />
CM<br />
40<br />
50<br />
0 0 .2 0 .4 0,6 0,8<br />
FIG. 2 .<br />
CD (PPM)<br />
CD/FE (x10-4)<br />
Cadmium concentration (ppm) and ratio <strong>of</strong> Cd/Fe concentrations with depth (cm) in downcore sediment<br />
sample from C22 .<br />
110
10<br />
20<br />
30<br />
CM<br />
40<br />
50<br />
FIG .<br />
0 5 10 15 2C<br />
CR (PPM)<br />
CR/FE (x10-4)<br />
3. Chromium concentration (ppm) and ratio <strong>of</strong> Cr/Fe concentrations with depth (cm) in downcore sediment<br />
sample from C22 .<br />
111
10<br />
20<br />
30<br />
CM<br />
40<br />
50<br />
FIG. 4 .<br />
5 10 15 20 25<br />
CU (PPM)<br />
Cu/FE (x10-Lj )<br />
Copper concentration (ppm) and ratio <strong>of</strong> Cu/Fe concentrations with depth (cm) in downcore sediment sample<br />
from C22.<br />
112
10<br />
20<br />
30<br />
CM<br />
40<br />
50<br />
0 0 .5 1,0 1,5 2,0<br />
FE (9)<br />
FIG. S . Iron concentration (ppm) with depth (cm) in downcore sediment sample from C22.<br />
113
0<br />
_-<br />
to<br />
20<br />
30<br />
CM<br />
O ~+<br />
40<br />
t~ O<br />
50<br />
O PB CONCENTRATION<br />
+ PB/FE RATIO<br />
FIG .<br />
0 5 10 15 20<br />
PB ( PPM)<br />
Ps/FE (x10-4)<br />
6. Lead concentration (ppm) with ratio <strong>of</strong> Pb/Fe concentrations with depth (cm) in downcore sediment<br />
sample from C22 .<br />
114
10<br />
20<br />
30<br />
CM<br />
40<br />
50<br />
0 5 10 15 20<br />
Ni (PPm)<br />
Ni/FE (x10-4)<br />
FIG. 7. Nickel concentration (ppm) and ratio <strong>of</strong> Ni/Fe concentrations with depth (cm) in downcore sediment<br />
sample from C22 .<br />
115
10<br />
20<br />
30<br />
CM<br />
40<br />
50<br />
0 5 10 15 20<br />
V ( PPM)<br />
V/FE (x104)<br />
FIG. 8. Vanadium concentration (ppm) and ratio <strong>of</strong> V/Fe concentrations with depth (cm) in downcore sediment<br />
sample from C22.<br />
116
0<br />
io<br />
Zo<br />
30<br />
CM<br />
40<br />
50<br />
20 30 40 50 EO<br />
FIG .<br />
ZN (PPM)<br />
ZN/FE (X1O-4)<br />
9. Zinc concentration (ppm) and ratio <strong>of</strong> Zn/Fe concentrations with depth (cm) in downcore sediment sample<br />
from C22.<br />
117
APPENDIX G<br />
Downcore Sediment Pb-210 Data from Control Site 22<br />
119
Sample Moisture Total Weight <strong>of</strong><br />
Identification % _ Sample ( dry)(Rrams)<br />
Down Sed<br />
Get #1 0-0 .4cm 73.1 2.15<br />
Out #2 0.4-0 " 8cm 62.5 4.20<br />
Cut #3 0 .8-1 .2cm 44.2 4.30<br />
Cut #4 1.2-1.6cm 41.9 4"30<br />
Get #5 1.6-2.Ocm 44"g 4.80<br />
Get #6 2.0-2.4cm 42 .5 7" 54<br />
Cut #7 2.4-2 "8cm 40 .E 5.15<br />
Cut #8 2.8-3 "2cm 42.5 7.30<br />
cut 49 3.2-3 .6cm 41 .1 8.30<br />
Cut #10 3.6-4"ocm 41 .6 8.65<br />
Get #11 4.0-4.4cm 35 .2 9 .<br />
Cat #12 4.4-4 .8cm 36.4 9.80<br />
Cut #13 4.8-5 .2cm 36.4 13.E<br />
Get #14 5.2-5 " 6cm 34 "7 12 "<br />
Cut #15 5" 6-6.0cm 31 "2 20.30<br />
Get #16 6.0-6.4cm 32.6 13 "35<br />
Cut #17 6 .4-6.8cm 25 "0 11.10<br />
Get #18 6 .8-7 .2cm 27 "g 15.50<br />
cut #19 7.2-7.6cm 22 .2 1.4"00<br />
Cut #20 7.6-8 "ocm 13 .3 12 " 5<br />
cut #21 8.4-8 .4cm 18 .8 13 "00<br />
Get #22 8.48.8cm 23 .8 13 "45<br />
out #23 8.8-9 .2cm ' 24 " 1 15 "1+0<br />
Cut #24 9 .2-9.6cm 28 .2 13.75<br />
Get #25 9 .6-lo .Ocm 28 .1 12.80<br />
Cut #zb 10.0-10.4cm 28.1 31.50<br />
Cut #27 10.4-10.8cm 29.8 12.00<br />
Cut #28 10.8-11.2cm 27.2 12.30<br />
Cut #29 11.2-11.6cm 28.4 9.20<br />
Cut #30 11.6-12.0cm 26.2 10.20<br />
Cut if31 12.0-12.4cm 27 .2 31.10<br />
Cut 452 12.4-12 "8cm 22 .5 13 "40<br />
Get 433 12.8-13.2cm 23 "7 12.44<br />
Cut #34 13 "2-13 . bcm 32.0 12.10<br />
Cut #35 13.6-14.Ocm 26.0 11.80<br />
Get #36 14 " 0-14.4cm 32.7 10.70<br />
Cut #37 14 " 4-14-8cm 30 .6 13-60<br />
P, a~$<br />
(~9 )<br />
x.61=x .13<br />
J .38o .12<br />
1.7±3.5<br />
1.2+0 .5<br />
1.2f0 .4<br />
1.2+0 .5<br />
0.7b+0 .29<br />
x "41+0 .28<br />
x.41+0 .28<br />
1.78±0 .1.1<br />
x.85{0 .51<br />
2.9+0 .?<br />
2 .Of0 .2<br />
5 .5+x " 7<br />
z .9+0 .6<br />
1 .'7:+0.5<br />
1.3+0 .7<br />
1.1+0 .6<br />
1.0+0 .6<br />
1.6+0 .6<br />
1.3+0 .6<br />
1.9+1 .1<br />
1.6+0 .7<br />
1.6+0 .6<br />
121
Sample Moisture Total Weight <strong>of</strong> pCi/ S<br />
Identification $ Sample (dry) (gr ams) (dry)<br />
Down Sed :<br />
Cut #38 14 .8-15 .2cm 33 .0 10.45 2 .1+0 .4<br />
Cut X39 15.2-15 .6em 27 .8 9 .60 1 .3+0 .3<br />
Cut #40 15.6-16 .Ocm 21 .5 10 .20 1 .4+0 .4<br />
Cut #41 16 .0-16 .4cm 18 .7 13 .50 1 .2+0 .3<br />
Cut #42 16 .4-16 .8cm 16 .3 10 .80 2 .0+0 .4<br />
Cut #43 16 .8-17 .2cm 20 .7 9 .60 3 .2+U .5<br />
Cut #44 17 .2-17 .6cm 32 .1 13 .10 5 .5+0 .9<br />
Cut #45 17 .6-18 .Ocm 23 .1 17 .80 7 .1+0 .7<br />
Cut #46 18 .0-18 .4cm 27 .1 15 .20 2 .1+0 .5<br />
Cut #47 18 .4-18 .8em 24 .9 13 .75 1.2+0 .5<br />
Cut #48 18 .8-19 .2cm 14 .9 12 .85 0 .9+0 .4<br />
Cut #49 19 .2-19 .6em 25 .8 18 .40 0 .9+0 .4<br />
Cut #50 19 .6-20 .Ocm 18 .0 19 .10 1 .0+0 .6<br />
Cut #51 20 .0-20 .4cm 20 .4 26 .35 1 .1+0 .5<br />
Cut #52 20 .4-20 .8em 28 .3 18 .00 1 .0+0 .5<br />
Cut #53 20 .8-21.2em 31 .2 11 .90 3 .6+0 .6<br />
Cut #54 21 .2-21 .6em 33 .9 17 .00 9 .1+1 .0<br />
Cut #55 21 .6-22 .Ocm 36 .8 18.55 1 .8+0 .6<br />
Cut #56 22 .0-22 .4cm 25 .5 12 .00 1.8+0 .6<br />
Cut #57 22 .4-22 .8em 31 .8 16 .50 1.0+0 .5<br />
Cut #58 22 .8-23 .2cm 28 .4 ll .50 1 .6+0 .6<br />
Cut #59 23 .2-23 .6cm 31 .1 6 .20 1.9+0 .6<br />
Cut #60 23 .6-24.Ocm 30 .9 11.05 0.63+0,14<br />
Cut X61 24.0-24 .4cm 34 .6 10 .10 0 .69+0 .2E<br />
Cut #62 24 .4-24 .8cm 27 .7 12 .00 1 .5+0 .3<br />
Cut #63 24 .8-25 .2cm 16 .4 9 .20 1 .3+0 .4<br />
Cut #64 25 .2-25 .6cm 17 .1 13 .80 0 .73+0 .16<br />
Cut #65 25 .6-26 .Ocm 27 .8 11 .70 1 .4+0 .2<br />
Cut #66 26.0-26 .4cm 18 .9 12 .90 0 .66+0 .14<br />
Cut #67 26 .4-26 .8cm 22 .1 12 .00 0 .78+0 .22<br />
Cut #68 26 .8-27 .2cm 28 .8 9 .90 1 .0+0 .6<br />
122
VOLUME I-POLLUTANT FATE AND EFFECTS STUDIES<br />
Part 5-Microbiology and Microbiological Processes<br />
by<br />
Lewis R. Brown<br />
Gary W. Childers<br />
Robert W . Landers, Jr .<br />
Mississippi State University<br />
Mississippi State, Mississippi 39762<br />
John D. Walker<br />
Environmental Protection Agency<br />
Washington, DC 20204<br />
Editor : C. A . Bedinger, Jr .<br />
Editorial Assistant : Laura Z. Kirby
TABLE OF CONTENTS<br />
Page<br />
I . INTRODUCTION . . . . . . . . . . . . . . . . . . . . . . . . . . . . . . . . . . . . . . . . . . . . . . . . . . . . . . . . . . . . . . . . . . . . . . . . . . . . . . . . . . . . . . . . . . . . . . . . . . . . . . . . . . . . . . . 123<br />
u. METHODS AND MATERIALS . . . . . . . . . . . . . . . . . . . . . . . . . . . . . . . . . . . . . . . . . . . . . . . . . . . . . . . . . . . . . . . . . . . . . . . . . . . . . . . . . . . . . . . . . . . . . 125<br />
A. Study Area awl Sampling Design . . . . . . . . . . . . . . . . . . . . . . . . . . . . . . . . . . . . . . . . . . . . . . . . . . . . . . . . . . . . . . . . . . . . . . . . . . . . . . . . . . . . . 125<br />
B. Sample Collection and Preparation .. . . . . . . . . . . . . . . . . . . . . . . . . . . . . . . . . . . . . . . . . . . . . . . . . . . . . . . . . . . . . . . . . . . . . . . . . . . . . . . . . 127<br />
l. Primary Platforms . . . . . . . . . . . . . . . . . . . . . . . . . . . . . . . . . . . . . . . . . . . . . . . . . . . . . . . . . . . . . . . . . . . . . . . . . . . . . . . . . . . . . . . . . . . . . . . 127<br />
2. Control Sites . . . . . . . . . . . . . . . . . . . . . . . . . . . . . . . . . . . . . . . . . . . . . . . . . . . . . . . . . . . . . . . . . . . . . . . . . . . . . . . . . . . . . . . . . . . . . . . . . . . . . . . 127<br />
3. Secondary Platforms . . . . . . . . . . . . . . . . . . . . . . . . . . . . . . . . . . . . . . . . . . . . . . . . . . . . . . . . . . . . . . . . . ... . . . . . . . . . . . . . . . . . . . . . . . . . 127<br />
C. Materials . . . . . . . . . . . . . . . . . . . . . . . . . . . . . . . . . . . . . . . . . . . . . . . . . . . . . . . . . . . . . . . . . . . . . . . . . . . . . . . . . . . . . . . . . . . . . . . . . . . . . . . . . . . . . . . . . . . 128<br />
D. Sample Analysis . . . . . . . . . . . . . . . . . . . . . . . . . . . . . . . . . . . . . . . . . . . . . . . . . . . . . . . . . . . . . . . . . . . . . . . . . . . . . . . . . . . . . . . . . . . . . . . . . . . . . . . . . . 128<br />
1 . Aerobic Heterotrophic Bacteris . . . . . . . . . . . . . . . . . . . . . . . . . . . . . . . . . . . . . . . . . . . . . . . . . . . . . . . . . . . . . . . . . . . . . . . . . . . . . . . 128<br />
2. Off-DoSrading Bacteria . . . . . . . . . . . . . . . . . . . . . . . . . . . . . . . . . . . . . . . . . . . . . . . . . . . . . . . . . . . . . . . . . . . . . . . . . . . . . . . . . . . . . . . . . . 128<br />
3 . Yeasts and Fluqgi . . . . . . . . . . . . . . . . . . . . . . . . . . . . . . . . . . . . . . . . . . . . . . . . . . . . . . . . . . . . . . . . . . . . . . . . . . . . . . . . . . . . . . . . . . . . . . . . . 128<br />
4. NitntaReduciv& Hydrocarbon-Utilizing Micnvms . . . . . . . . . . . . . . . . . . . . . . . . . . . . . . . . . . . . . . . . . . . . 128<br />
S. SulfateReductiAs, Hydrvcar6on-UtffiirnW A~kr~o~eF~ns . . . . . . . . . . . . . . . . . . . . . . . . . . . . . . . . . . . . . . . . . . . . 128<br />
6. Nitrogen, Ammonium, Nitrate, Nitrite, Phosphate and . . . . . . . . . . . . . . . . . . . . . . . . . . . . . . . . . 130<br />
7. Oil-Degradation . . . . . . . . . . . . . . . . . . . . . . . . . . . . . . . . . . . . . . . . . . . . . . . . . . . . . . . . . . . . . . . . . . . . . . . . . . . . . . . . . . . . . . . . . . . . . . . . . . 130<br />
a . Oxygen Consumption . . . . . . . . . . . . . . . . . . . . . . . . . . . . . . . . . . . . . . . . . . . . . . . . . . . . . . . . . . . . . . . . . . . . . . . . . . . . . . . . . . . 130<br />
b. Respirometry . . . . . . . . . . . . . . . . . . . . . . . . . . . . . . . . . . . . . . . . . . . . . . . . . . . . . . . . . . . . . . . . . . . . . . . . . . . . . . . . . . . . . . . . . . . . . . 130<br />
c. Hydrocarbon Analyses . . . . . . . . . . . . . . . . . . . . . . . . . . . . . . . . . . . . . . . . . . . . . . . . . . . . . . . . . . . . . . . . . . . . . . . . . . . . . . . . . . 130<br />
8. Nitrification . . . . . . . . . . . . . . . . . . . . . . . . . . . . . . . . . . . . . . . . . . . . . . . . . . . . . . . . . . . . . . . . . . . . . . . . . . . . . . . . . . . . . . . . . . . . . . . . . . . . . . . 131<br />
9. Nitrogen Fixation. . . . . . . . . . . . . . . . . . . . . . . . . . . . . . . . . . . . . . . . . . . . . . . . . . . . . . . . . . . . . . . . . . . . . . . . . . . . . . . . . . . . . . . . . . . . . . . . . 131<br />
10. Denitrificstion . . . . . . . . . . . . . . . . . . . . . . . . . . . . . . . . . . . . . . . . . . . . . . . . . . . . . . . . . . . . . . . . . . . . . . . . . . . . . . . . . . . . . . . . . . . . . . . . . . . . 131<br />
11 . Sulfate Reduction . . . . . . . . . . . . . . . . . . . . . . . . . . . . . . . . . . . . . . . . . . . . . . . . . . . . . . . . . . . . . . . . . . . . . . . . . . . . . . . . . . . . . . . . . . . . . . ., 131<br />
12. Sulfur Oxidation . . . . . . . . . . . . . . . . . . . . . . . . . . . . . . . . . . . . . . . . . . . . . . . . . . . . . . . . . . . . . . . . . . . . . . . . . . . . . . . . . . . . . . . . . . . . . . . . . . 131<br />
13 . P6otosyntheais . . . . . . . . . . . . . . . . . . . . . . . . . . . . . . . . . . . . . . . . . . . . . . . . . . . . . . . . . . . . . . . . . . . . . . . . . . . . .. . . . . . . . . . . . . . . . . . . . . . . 131<br />
14 . Heterotrop6icActivity . . . . . . . . . . . . . . . . . . . . . . . . . . . . . . . . . . . . . . . . . . . . . . . . . . . . . . . . . . . . . . . . . . . . . 131<br />
15. Phosphorus Uptalce . . . . . . . . . . . . . . . . . . . . . . . . . . . . . . . . . . . . . . . . . .. . . . . . . . . . . . . . . . . . . . . . . . . . . . . . . . . . . . . . . . . . . . . . . . . . . . 132<br />
16. Lipolysis . . . . . . . . . . . . . . . . . . . . . . . . . . . . . . . . . . . . . . . . . . . . . . . . . . . . . . . . . . . . . . . . . . . . . . . . . . . . . . . . .. . . . . . . . . . . . . . . . . . . . . . . . . . . 132<br />
17. Chitinolysis . . . . . . . . . . . . . . . . . . . . . . . . . . . . . . . . . . . . . . . . . . . . . . . . . . . . . . . . . . . . . . . . . . . . . . . . . . . . . . . . . . . . . . . . . . . . . . . . . . . . . . . . 132<br />
18. Cellulolysis. . . . . . . . . . . . . . . . . . . . . . . . . . . . . . . . . . . . . . . . . . . . . . . . . . . . . . . . . . . . . . ... . . . . . . . . . . . . . . . . . . . . . . . . . . . . . . . . . . . . . . . . 132<br />
19. Proteolysis . . . . . . . . . . . . . . . . . . . . . . . . . . . . . . . . . . . . . . . . . . . . . . . . . . . . . . . . . . . . . . . . . . . . . . . . . . . . . . . . . . . . . . . . . . . . . . . . . . . . . . . . . 132<br />
E. Pure Culture Studies . . . . . . . . . . . . . . . . . . . . . . . . . . . . . . . . . . . . . . . . . . . . . . . . . . . . . . . . . . . . . . . . . . . . . . . . . . . . . . . . . . . . . . . . . . . . . . . . . . . . . 132<br />
F . Statistical Analyses . . . . . . . . . . . . . . . . . . . . . . . . . . . . . . . . . . . . . . . . . . . . . . . . . . . . . . . . . . . . . . . . . . . . . . . . . . . . . . . . . . . . . . . . . . . . . . . . . . . . . . . 133<br />
III . RESUL'I'5 . . . . . . . . . . . . . . . . . . . . . . . . . . . . . . . . . . . . . . . . . . . . . . . . . . . . . . . . . . . . . . . . . . . . . . . . . . . . . . . . . . . . . . . . . . . . . . . . . . . . . . . . . . . . . . . . . . . . . . . . . . 135<br />
A. Sample Analysis . . . . . . . . . . . . . . . . . . . . . . . . . . . . . . . . . . . . . . . . . . . . . . . . . . . . . . . . . . . . . . . . . . . . . . . . . . . . . . . . . . . . . . . . . . . . . . . . . . . . . . . . . . 133<br />
1. Aerobic Heterotrop6ic Bacteria . . . . . . . . . . . . . . . . . . . . . . . . . . . . . . . . . . . . . . . . . . . . . . . . . . . . .. . . . . . . . . . . . . . . ... . . . . . . . . . 135<br />
2. Aerobic Bacteria an 09 Agw . . . . . . . . . . . . . . . . . . . . . . . . . . . . . . . . . . . . . . . . . . . . . . . . . . . . . . . . . . . . . . . . . . . . . . . . . . . . . . . . . . 135<br />
3. Ytasts and Fluqai. . . . . . . . . . . . . . . . . . . . . . . . . . . . . . . . . . . . . . . . .. . . . . . . . . . . . . . . . . . . . . . . . . . . . . . . . . . . . . . . . . . . . . . . . . . . . 143<br />
4. Nitrate-Reducing, Hydt~ocarbon-U~llficroor~aaima . . . . . . . . . . . . . . . . .. . . . . . . . . . . . . . . . . . . . . . . . . . . 143<br />
S. SWfato-Reducins, Hydrocarbon-UtflizicgMicr+vorpeaisma . . . . . . . . . . . . . . . . . . . . . . . . . . . .. . . . . . . . . . . . . . . . 143<br />
6. Chemical Nutrients. . . . . . . . . . . . . . . . . . . . . . . . . . . . . . . . . . . . . . . . . . . . . . . . . . . . . . . . . . . . . . . . . . . . . . . . . . . . . . . . . . . . . . . . . . . . . . . ISO<br />
7. Oil Degradatioa. . . . . . . . . . . . . . . . . . . . . . . . . . . . . . . . . . . . . . . . . . . . . . . . . . . . . . . . . . . . . . . . . . . . . . . . . . . . . . . . . . . . . . . . . . . . . . . . . . . ,135<br />
a . Sediments . . . . . . . . . . . . . . . . . . . . . . . . . . . . . . . . . . . . . . . . . . . . . . . . . . . . . . . . . . . . . . . . . . . . . . . . . . . . . . . . . . . . . . . . . . . . . . . . . . 155<br />
b. Mixed and Pure Cultures . . . . . . . . . . . . . . . . . . . . . . . . . . . . . . . . . . . . . . . . . . . . . . . . . . . . . . . . . . . . . . . . . . . . . . . . . . . . . . . 161<br />
8. Nitrification . . . . . . . . . . . . . . . . . . . . . . . . . . . . . . . . . . . . . . . . . . . . . . . . . . . . . . . . . . . . . . : . . . . . . . . . . . . . . . . . . . . . . . . . . . . . . . . . . . . . . 170<br />
9. Nitrogen Fixatioa. . . . . . . . . . . . . . . . . . . . . . . . . . . . . . . . . . . . . . . . . . . . . . . . . . . . . . . . . . . . . . . . . . . . . . . . . . . . . . . . . . . . . . . . . . . . . . . . . 170<br />
10. Denitrification . . . . . . . . . . . . . . . . . . . . . . . . . . . . . . . . . . . . . . . . . . . . . . . . . . . . . . . . . . . . . . . . . . . . . . . . . . . . . . . . . . . . . . . . . . . . . . . . . . . . 170<br />
II . Sulfate Reduction . . . . . . . . . . . . . . . . . . . . . . . . . . . . . . . . . . . . . . . . . . . . . . . . . . . . . . . . . . . . . . . . . . . . . . . . . . . . . . . . . . . . . . . . . . . . . . . . 170<br />
12. Sulfur Oxidation . . . . . . . . . . . . . . . . . . . . . . . . . . . . . . . . . . . . . . . . . . . . . . . . . . . . . . . . . . . . . . . . . . . . . . . . . . . . . . . . . . . . . . . . . . . . . . . . . . 170<br />
13. P6otosyathexis . . . . . . . . . . . . . . . . . . . . . . . . . . . . . . . . . . . . . . . . . . . . . . . . . . . . . . . . . . . . . . . . . . . . . . . . . . . . . . . . . . . . . . . . . . . . . . . . . . . . 170<br />
14. Heterotrop6ic Activity . . . . . . . . . . . . . . . . . . . . . . . . . . . . . . . . . . . . . . . . . . . . . . . . . . . . . . . . . . . . . . . . . . . ... . . . . . . . . . . . . . . . . . . . . 170<br />
IS. Phosphorus Uptake . . . . . . . . . . . . . . . . . .. . . . . . . . . . . . . . . . . . . . . . . . . . . . . . . . . . . . . . . . . . . . . . . . . . . . . . . . . . . . . . . . . . . . . . . . . . . . . 182<br />
16. Lipolysis . . . . . . . . . . . . . . . . . . . . . . . . . . . . . . . . . . . . . . . . . . . . . . . . . . . . . . . . . . . . . . . . . . . . . . . . . . . . . . . . . . . . . . . . . . . . . . . . . . . . . . . . . . . . 182<br />
17. C6itinolysis . . . . . . . . . . . . . . . . . . . . . . . . . . . . . . . . . . . . . . . . . . . . . . . . . . . . . . . . . . . . . . . . . . . . . . . . . . . . . . . . . . . . . . . . . . . . . . . . . . . . . . . . 182<br />
18. Cellulolysis . . . . . . . . . . . . . . . . . . . . . . . . . . . . . . . . . . . . . . . . . . . . . . . . . . . . . . . . . . . . . . . . . . . . . . . . . . . . . . . . . . . . . . . . . . . . . . . . . . . . . . . . . 182<br />
19. Proteolysis . . . . . . . . . . . . . . . . . . . . . . . . . . . . . . . . . . . . . . . . . . . . . . . . . . . . . . . . . . . . . . . . . . . . . . . . . . . . . . . . . . . . . . . . . . . . . . . . ... . . . . . . 182<br />
B. Pure Culture Studies . . . . . . . . . . . . . . . . . . . . . . . . . . . . . . . . . . . . . . . . . . . . . . . . . . . . . . . . . . . . . . . . . . . . . . . . . . . . . . . . . . . . . . . . . . . . . . . . . . . . . 182<br />
1V . DISCUSSION . . . . . . . . . . . . . . . . . . . . . . . . . . . . . . . . . . . . . . . . . . . . . . . . . . . . . . . . . . . . . . . . . . . . . . . . . . . . . . . . . . . . . . . . . . . . . . . . . . . . . . . . . . . . . . . . . . . . . 203<br />
A. Analysis <strong>of</strong> Microbial Populations . . . . . . . . . . . . . . . . . . . . . . . . . . . . . . . . . . . . . . . . . . . . . . . . . . . . . . . . . . . . . . . . . . . . . . . . . . . . . . . . . . . 203<br />
! . Aerobic Hewotrophic Bacteria . . . . . . . . . . . . . . . . . . . . . . . . . . . . . . . . . . . . . . . . . . . . . . . . . . . . . . . . . . . . . . . . . . . . . . . . . . . . . . . 203<br />
2. Aerobic Bacteria on Oil Agar . . . . . . . . . . . . . . . . . . . . . . . . . . . . . . . . . .. . . . . . . . . . . . . . . . . . . . . . . . . . . . . . . . . . . . . . . . . . . . . . .. 205<br />
iii
TABLE OF CONTENTS (conYd)<br />
3. Yeasts and Fungi. . . . . . . . . . . . . . . . . . . . . . . . . . . . . . . . . . . . . . . . . . . . . . . . . . . . . . . . . . . . . . . . . . . . . . . . . . . . . . . . . . . . . . . . . . . . . . . . . . 206<br />
4. Microorganisms from Rosenfeld's Nitrate-Hpdrocar6on Medium (MRNHM) . . . . . . . . . . . . . . . . . . . . 207<br />
S. Microorganisms from Rosenfeid's Sulfate-Hydrocarbon Medium (MRSHM). . . . . . . . . . . . . . . . . . . . . 208<br />
B. Sample Analysis <strong>of</strong> Chemical Nutrients . . . . . . . . . . . . . . . . . . . . . . . . . . . . . . : . . . . . . . . . . . . . . . . . . . . . . . . . . . . . . . . . . . . . . . . . . . . . . 208<br />
C. Oil Degradation. . . . . . . . . . . . . . . . . . . . . . . . . . . . . . . . . . . . . . . . . . . . . . . . . . . . . . . . . . . . . . . . . . . . . . . . . . . . . . . . . . . . . . . . . . . . . . . . . . . . . . . . . . . 211<br />
D. Magnitude <strong>of</strong> and Impact <strong>of</strong> Oil upon Microbial Processes . . . . . . . . . . . . . . . . . . . ., . . . . . . . . . . . . . . . . . . . . . . . . . . . . . . . . 211<br />
l. Nitrification . . . . . . . . . . . . . . . . . . . . . . . . . . . . . . . . . . . . . . . . . . . . . . . . . . . . . . . . . . . . . . . . . . . . . . . . . . . . . . . . . . . . . . . . . . . . . . . . . . . . . . . 211<br />
2. Nitrogen Fixation . . . . . . . . . . . . . . . . . . . . . . . . . . . . . . . . . . . . . . . . . . . . . . . . . . . . . . . . . . . . . . . . . . . . . . . . . . . . . . . . . . . . . . . . . . . . . . . . . 211<br />
3 . Denitrification . . . . . . . . . . . . . . . . . . . . . . . . . . . . . . . . . . . . . . . . . . . . . . . . . . . . . . . . . . . . . . . . . . . . . . . . . . . . . . . . . . . . . . . . . . . . . . . . . . . . 212<br />
4. Sulfate Reduction . . . . . . . . . . . . . . . . . . . . . . . . . . . . . . . . . . . . . . . . . . . . . . . . . . . . . . . . . . . . . . . . . . . . . . . . . . . . . . . . . . . . . . . . . . . . . . . . 212<br />
S. Sulfur Oxidation . . . . . . . . . . . . . . . . . . . . . . . . . . . . . . . . . . . . . . . . . . . . . . . . . . . . . . . . . . . . . . . . . . . . . . . . . . . . . . . . . . . . . . . . . . . . . . . . . . 212<br />
6. Photosynthesis . . . . . . . . . . . . . . . . . . . . . . . . . . . . . . . . . . . . . . . . . . . . . . . . . . . . . . . . . . . . . . . . . . . . . . . . . . . . . . . . . . . . . . . . . . . . . . . . . . . . 212<br />
7. Heterotrop6ic Activity . . . . . . . . . . . . . . . . . . . . . . . . . . . . . . . . . . . . . . . . . . . . . . . . . . . . . . . . . . . . . . . . . . . . . . . . . . . . . . . . . . . . . . . . . . 212<br />
8. Phosphorus Uptake . . . . . . . . . . . . . . . . . . . . . . . . . . . . . . . . . . . . . . . . . . . . . . . . . . . . . . . . . . . . . . . . : . . . . . . . . . . . . . . . . . . . . . . . . . . . . . 212<br />
9. Lipolysis. . . . . . . . . . . . . . . . . . . . . . . . . . . . . . . . . . . . . . . . . . . . . . . . . . . . . . . . . . . . . . . . . . . . . . . . . . . . . . . . . . . . . . . . . . . . . . . . . . . . . . . . . . . . 212<br />
10. ChitinoJysis . . . . . . . . . . . . . . . . . . . . . . . . . . . . . . . . . . . . . . . . . . . . . . . . . . . . . . . . . . . . . . . . . . . . . . . . . . . . . . . . . . . . . . . . . . . . . . . . . . . . . . . . 213<br />
I1 . Cellulolysis. . . . . . . . . . . . . . . . . . . . . . . . . . . . . . . . . . . . . . . . . . . . . . . . . . . . . . . . . . . . . . . . . . . . . . . . . . . . . . . . . . . . . . . . . . . . . . . . . . . . . . . . . . 213<br />
12. Proteolysis . . . . . . . . . . . . . . . . . . . . . . . . . . . . . . . . . . . . . . . . . . . . . . . . . . . . . . . . . . . . . . . . . . . . . . . . . . . . . . . . . . . . . . . . . . . . . . . . . . . . . . . . . 213<br />
V.<br />
E. Recommendations for Further Studies . . . . . . . . . . . . . . . . . . . . . . . . . . . . . . . . . . . . . . . . . . . . . . . . . . . . . . . . . . . . . . . . . . . . . . . . . . . . . . 213<br />
CONCLUSIONS . . . . . . . . . . . . . . . . . . . . . . . . . . . . . . . . . . . . . . . . . . . . . . . . . . . . . . . . . . . . . . . . . . . . . . . . . . . . . . . . . . . . . . . . . . . . . . . . . . . . . . . . . . . . . . . . . 215<br />
VI . ACKNOWLEDGEMENTS . . . . . . . . . . . . . . . . . . . . . . . . . . . . . . . . . . . . . . . . . . . . . . . . . . . . . . . . . . . . . . . . . . . . . . . . . . . . . . . . . . . . . . . . . . . . . . . . . . . . 217<br />
VII. LITERATURE CITED . . . . . . . . . . . . . . . . . . . . . . . . . . . . . . . . . . . . . . . . . . . . . . . . . . . . . . . . . . . . . . . . . . . . . . . . . . . . . . . . . . . . . . . . . . . . . . . . . . . . . . . . . 219<br />
VIII . PUBLICATIONS RESULTING FROM THIS STUDY . . . . . . . . . . . . . . . . . . . . . . . . . . . . . . . . . . . . . . . . . . . . . . . . . . . . . . . . . . . . . . . . 223<br />
Page<br />
iv
LIST OF FIGURES<br />
Figure<br />
Page<br />
1 . Maps <strong>of</strong> the study area - (Top) Location <strong>of</strong> study area . (Bottom) Study area showing sampling sites . . . . . . . . . 126<br />
2. Counts <strong>of</strong> aerobic heterotrophs obtained at control sites during Cruises I, II, and III . . . . . . . . . . . . . . . . . . . . . . . . . . . . 136<br />
3. Counts <strong>of</strong> aerobic heterotrophs obtained during Cruise II . . . . . . . . . . . . . . . . . . . . . . . . . . . . . . . . . . . . . . . . . . . . . . . . . . . . . . . . . . . . . . 138<br />
4. Total aerobic plate-based on correlated t-test . . . . . . . . . . . . . . . . . . . . . . . . . . . . . . . . . . . . . . . . . . . . . . . . . . . . . . . . . . . . . . . . . . . . . . . . . . . . . . 139<br />
S. Effect <strong>of</strong> freezing on total aerobic heterotrophic bacteria in marine sediments. . . . . . . . . . . . . . . . . . . . . . . . . . . . . . . . . . . . . 140<br />
6. Counts <strong>of</strong> bacteria on oil agar obtained at control sites during Curisos I, II, and III . . . . . . . . . . . . . . . . . . . . . . . . . . . . . . 142<br />
7. Aerobic hydrocarbonoclasts based on Duncan's Multiple Range Test (SPSS) . . . . . . . . . . . . . . . . . . . . . . . . . . . . . . . . . . . . . . 144<br />
8. Distribution <strong>of</strong> bacteria from Cruise I cultured on oil agar expressed as percentage <strong>of</strong> the bacteria cultured<br />
on marine agar . . . . . . . . . . . . . . . . . . . . . . . . . . . . . . . . . . . . . . . . . . . . . . . . . . . . . . . . . . . . . . . . . . . . . . . . . . . . . . . . . . . . . . . . . . . . . . . . . . . . . . . . . . . . . . . . . . . . 146<br />
9. Distribution <strong>of</strong> bacteria from Cruise II cultured on oil agar expressed as a percentage <strong>of</strong> the bacteria cultured<br />
on marine agar . . . . . . . . . . . . . . . . . . . . . . . . . . . . . . . . . . . . . . . . . . . . . . . . . . . . . . . . . . . . . . . . . . . . . . . . . . . . . . . . . . . . . . . . . . . . . . . . . . . . . . . . . . . . . 147<br />
10. Subsets <strong>of</strong> sulfate-reducing, hydrocarbon-utilizing bacteria based on Duncan's Multiple Range Teat<br />
(SPSS) . . . . . . . . . . . . . . . . . . . . . . . . . . . . . . . . . . . . . . . . . . . . . . . . . . . . . . . . . . . . . . . . . . . . . . . . . . . . . . . . . . . . . . . . . . . . . . . . . . . . . . . . . . . . . . . . . . . . ... . . . . . . . . 152<br />
11 . Oxygen utilization by sediments during incubation with oil at 27 C in BOD bottles . . . . . . . . . . . . . . . . . . . . . . . . . . . . . . . 159<br />
12. Effect <strong>of</strong> temperature on oxygen utilization by sediments taken from platform areas (Cruise II) during<br />
incubation with oil in BOD botdes . . . . . . . . . . . . . . . . . . . . . . . . . . . . . . . . . . . . . . . . . . . . . . . . . . . . . . . . . . . . . . . . . . . . . . . . . . . . . . . . . . . . . . . . . . . . 160<br />
13 . Oxygen consumption and carbon dioxide production by a sediment sample from the gulf <strong>of</strong> Mexico . . . . . . . . 162<br />
14. Percent alkanes (heptadecane through eicosane, and pristane and phytane) as a percent <strong>of</strong> the total oil during<br />
the microbial degradation <strong>of</strong> Empire Mix crude oil . . . . . . . . . . . . . . . . . . . . . . . . . . . . . . . . . . . . . . . . . . . . . . . . . . . . . . . . . . . . . . . . . . 163<br />
15 . Changes in the ratios <strong>of</strong> heptadecane (o-C17) to pristane and octadecane (rrC,B) W phytane (straight-to<br />
branched-chars) during the microbial degradation <strong>of</strong> Empire Mix crude oil . . .. . . . . . . . . . . . . . . . . . . . . . . . . . . . . . . . . . . . 164<br />
16. Oxygen consumption and carbon dioxide production during the microbial metabolism <strong>of</strong> Empire Mix<br />
crude oil by enrichments prepared from samples taken on Cruise I . . . . . . . . . . . . . . . . . . . . . . . . . . . . . . . . . . . . . . . . . . . . . . . . . . . 165<br />
17. Gas chromatography tracings <strong>of</strong> the aliphatics before and after microbial degradation by a control enrichment<br />
culture and a platform enrichment culture . . . . . . . . . . . . . . . . . . . . . . . . . . . . . . . . . . . . . . . . . . . . . . . . . . . . . . . . . . . . . . . . . . . . . . . . . . . 166<br />
18. Liquid chromatography tracings <strong>of</strong> the aromatics in Empire Mix crude oil before and after microbial dogradation<br />
by a control enrichment culture and a platform enrichment culture . . . . . . . . . . . . . . . . . . . . . . . . . . . . . . . . . . . . . . 167<br />
19. Oxygen consumption and carbon dioxide production during the microbial metabolism <strong>of</strong> Empire Mix<br />
crude oil by enrichments prepared from samples taken on Cruise II . . . . . . . . . . . . . . . . . . . . . . . . . . . . . . . . . . . . . . . . . . . . . . . . . . 168<br />
m. Oxygen consumption and carbon dioxide production by Pseudomonas sp -l daring the metabolism <strong>of</strong> Empire<br />
Mix crude oil . . . . . . . . . . . . . . . . . . . . . . . . . . . . . . . . . . . . . . . . . . . . . . . . . . . . . . . . . . . . . . . . .. . . . . . . . . . . . . . . . . . . . . . . . . . . . . . . . . . . . . . . . . . . . . . . . 169<br />
21 . Oxygen consumption and carbon dioxide production by Flavobacterium sp i during the metabolism <strong>of</strong><br />
Empire Mix crude oil . . . . . . . . . . . . . . . . . . . . . . . . . . . . . . . . . . . . . . . . . . . . . . . . . . . . . . . . . . . . . . . . . . . . . . . . . . . . . . . . . . . . . . . . . . . . . . . . . . . . . . . . . . . . 171<br />
22 . Oxygen consumption and carbon dioxide production by Pseudomonas sp 2 during the metabolism <strong>of</strong> Empire<br />
Mix crude oil . . . . : . . . . . . . . . . . . . . . . . . . . . . . . . . . . . . . . . . . . . . . . . . . . . . . . . . . .. . . . . . . . . . . . . . . . . . . . . . . . . . . . . . . . . . . . . . . . . . . . . . . . . . . . . . . . 172<br />
23 . Oxygen consumption and carbon dioxide production by Flavobacterinm sp 2 during the metabolism <strong>of</strong><br />
Empire Mix crude oil . . . . . . . . . . . . . . . . . . . . . . . . . . . . . . . . . . . . . . . . . . . . . . . . . . . . . . . . . :. . . . . . . . .» . . . . .. . . . . . . . . . . . . . . . . . . . . . . . . . . . . . . . . . 173<br />
24 . Concentrations <strong>of</strong> water-soluble 3sS at weeks 0, 1, 2, and 3 in Test (0), Control (O), IxOil (o), and 10KOii<br />
(") inoculated with sediment microorganisms from platforms and controls ., . . . . . . . . . . . . . . . . . . . . . . .. . . . . . . . . . . . . . . . 177<br />
25 . Percent 14C02 produced from "C-glucose by Platform 2 sediment microorganisms collected during<br />
Cruises I, II, and III . . . . . . . . . . . . . . . . . . . . . . . . . . . . . . . . . . . . . . . . . . . . . . . . . .. . . . . . . . . . . . . . . . . . . . . . . . . . . . . . . . . . . . . . . .. . . . . . . . . . . . . . . . . . . . 181<br />
26 . Production <strong>of</strong> COZ from chitin in Test (o), Control (O), lxOil (d), and lOxOiI (+) systems . . . . . . . . . . . . . . . . . . . . 189<br />
27 . Impact <strong>of</strong> oil on the rate <strong>of</strong> COZ produced from proteolytic activity by Pseodomonas sp 3 . . . . . . . . . . . . . . . . . . . . . . 197<br />
28 . Impact <strong>of</strong> oil on the heterotrophic activity <strong>of</strong> Enterobscter sp 1 as determined by measuring C02 trains<br />
GLC . . . . . . . . . . . . . . . . . . . . . . . . . . . . . . . . . . . . . . . . . . . . . . . . . . . . . . . . . . . . . . . . . . . . . . . . . . . . . . . . . . . . . . . . . . . . . . . . . . . . . . . . . . . . . . . . . . . . . . . . . . . . . . . . . 198<br />
29 . Impact <strong>of</strong> oil on cellulose utilization by measuring 14COZ produced by Cellulomoaas sp 1 . . . . . . . . . . . . . . . . . . . . . . 199<br />
30 . Impact <strong>of</strong> oil on the rate <strong>of</strong> 14COZ produced during lipolysis by Psendomonas sp S . . . . . . . . . . . . . . . . . . . . . . . . . . . . . . . 200<br />
31 . Impact <strong>of</strong> oil on chitin utilization by Pseudomonas sp 6 . . . . . . . . . . . . . . . . . . . . . . . . . . . . . . . . . . . . . . . . . . . . . . . . . . . . . . . . . . . . . . . . . 201<br />
32 . Nitrate-reducing, hydrocarbon-utilizing bacteria . . . . . . . . . . . . . . . . . . . . . . . . . . . . . . . . . . . . . . . . . . . . . . . . . . . . . . . . . . . . . . . . . . . . . . . . . 209<br />
33 . Subsets <strong>of</strong> ammonia-nitrogen concentration based on Duncan's Multiple Range Test. . . . . . . . . . . . . . . . . . . . . . . . . . . . 210
LIST OF TABLES<br />
Table<br />
Page<br />
1 . List <strong>of</strong> primary platforms (P), secondary platforms (S), and control sites (C) selected for this study . . . . . . . . . . 125<br />
2. Medium for nitrate-reducing, hydrocarbon-utilizing microorganisms. . . . . . . . . . . . . . . . . . . . . . . . . . . . . . . . . . . . . . . . . . . . . . . . 128<br />
3. Composition <strong>of</strong> synthetic seawater (400 percent) . . . . . . . . . . . . . . . . . . . . . . . . . . . . . . . . . . . . . . . . . . . . . . . . . . . . . . . . . . . . . . . . . . . . . . . . . . 129<br />
4. Composition <strong>of</strong> crude oil/water emulsion used in test media . . . . . . . . . . . . . . . . . . . . . . . . . . . . . . . . . . . . . . . . . . . . . . . . . . . . . . . . . . . 129<br />
S. Rosenfeld's sulfate-reducing medium for hydrocarbon-utilizing microorganisms . . . . . . . . . . . . . . . . . . . . . . . . . . . . . . . . . 129<br />
6 . Test systems for determining oil-degrading potential <strong>of</strong> sediment microorganisms . . . . . . . . . . . . . . . . . . . . . . . . . . . . . . . . 130<br />
7. Number <strong>of</strong> sediment samples analyzed . . . . . . . . . . . . . . . . . . . . . . . . . . . . . . . . . . . . . . . . . . . . . . . . . . . . . . . . . . . . . . . . . . . . . . . . . . . . . . . . . . . . . . 135<br />
8 . Total colony-forming units (CFU) <strong>of</strong> aerobic heterotrophic bacteria cultured on marine agar per ml <strong>of</strong><br />
sediment collected at the control sites, expressed as K CFU X 10-3 t SA . . . . . . . . . . . . . . . . . . . . . . . . . . . . . . . . . . . . . . . . . . . . . . . 135<br />
9. Total aerobic heterotrophic bacterial CFU (x 10 .3) per ml <strong>of</strong> sediment collected at the primary platforms . . . 137<br />
10 . Total aerobic heterotrophic bacterial CFU (x 10-3) per ml <strong>of</strong> sediment collected at the secondary platforms<br />
during Cruise II . . . . . . . . . . . . . . . . . . . . . . . . . . . . . . . . . . . . . . . . . . . . . . . . . . . . . . . . . . . . . . . . . . . . . . . . . . . . . . . . . . . . . . . . . . . . . . . . . . . . . . . . . . . . . . . . . . . 137<br />
11 . Counts <strong>of</strong> aerobic heterotrophic bacteria in fresh and frozen sediments expressed as CFU (x 10-x) per ml <strong>of</strong><br />
sediment . . . . . . . . . . . . . . . . . . . . . . . . . . . . . . . . . . . . . . . . . . . . . . . . . . . . . . . . . . . . . . . . . . . . . . . . . . . . . . . . . . . . . . . . . . . . . . . . . . . . . . . . . . . . . . . . . . . . . . . . 141<br />
12 . Average number <strong>of</strong> aerobic bacterial CFU (x 10-3) cultured on oil agar per ml <strong>of</strong> sediment collected at the<br />
control sites . . . . . . . . . . . . . . . . . . . . . . . . . . . . . . . . . . . . . . . . . . . . . . . . . . . . . . . . . . . . . . . . . . . . . . . . . . . . . . . . . . . . . . . . . . . . . . . . . . . . . . . . . . . . . . . . . . . . . . . . 141<br />
13 . Average number <strong>of</strong> aerobic bacterial CFU (X 10-3) cultured on oil agar per ml <strong>of</strong> sediment collected at the<br />
primary platforms . . . . . . . . . . . . . . . . . . . . . . . . . . . . . . . . . . . . . . . . . . . . . . . . . . . . . . . . . . . . . . . . . . . . . . . . . . . . . . . . . . . . . . . . . . . . . . . . . . . . . . . . . . . . . . . . 143<br />
14 . Average number <strong>of</strong> aerobic bacterial CFU (X 10-3) cultured on oil agar per ml sediment collected at the<br />
secondary platform during Cruise II . . . . . . . . . . . . . . . . . . . . . . . . . . . . . . . . . . . . . . . . . . . . . . . . . . . . . . . . . . . . . . . . . . . . . . . . . . . . . . . . . . . . . . . . . 145<br />
15 . Distribution <strong>of</strong> bacteria cultured on oil agar expressed as a percentage <strong>of</strong> the aerobic heterotrophic bacteria<br />
cultured on marine agar . . . . . . . . . . . . . . . . . . . . . . . . . . . . . . . . . . . . . . . . . . . . . . . . . . . . . . . . . . . . . . . . . . . . . . . . . . . . . . . . . . . . . . . . . . . . . . . . . . . . . 145<br />
16. Total number <strong>of</strong> yeast and fungal CFU cultured on Cooke's Rose Bengal Agar per ml <strong>of</strong> sediment collected<br />
at the control sites . . . . .. . . . . . . . . . . . . . . . . . . . . . . . . . . . . . . . . . . . . . . . . . . . . . . . . . . . . . . . . . . . . . . . . . . . . . . . . . . . . . . . . . . . . . . . . . . . . . . . . . . 148<br />
17 . Total number <strong>of</strong> yeast and fungal CFU cultured on Cooke's Rose Bengal Agar per ml <strong>of</strong> sediment collected<br />
at the primary platforms . . . . . . . . . . . . . . . . . . . . . . . . . . . . . . . . . . . . . . . . . . . . . . . . . . . . . . . . . . . . . . . . . . . . . . . . . . . . . . . . . . . . . . . . . . . . . . . . 148<br />
18 . Total number <strong>of</strong> yeast and fungal CFU cultured on Cooke's Rose Bengal Agar per ml <strong>of</strong> sediment col-<br />
19.<br />
lected at the secondary platforms during Cruise II . . . . ., . . . . . . . . . . . . . . . . . . . . . . . . . . . . . . . . . . . . . . . . . . . . . . . . ., . . . . . . . . . . . . . . . . 148<br />
Total number <strong>of</strong> microorganisms cultured in Rosenfeid's nitrate-hydrocarbon medium per ml <strong>of</strong> sediment<br />
collected at the control sites . . . . . . . . . . . . . . . . . . . . . . . . . . . . . . . . . . . . . . . . . . . . . . . . . . . . . . . . . . . . . . . . . . . . . . . . . . . . . . . . . . . . . . . . . . . . . . . . . . . . 149<br />
20. Total number <strong>of</strong> microorganisms cultured in Rosenfeld's nitrate-hydrocarbon medium per ml <strong>of</strong> sediment<br />
collected at the primary platforms . . . . . . . . . . . . . . . . . . . . . . . . . . . . . . . . . . . . . . . . . . . . . . . . . . . . . . . . . . . . . . . . . . . . . . . . . . . . . . . . . . . . . . . . . . . . 149<br />
21 . Total number <strong>of</strong> microorganisms cultured in Rosenfeld's nitrate-hydrocarbon medium per ml <strong>of</strong> sediment<br />
collected at the secondary platforms during Cruise II . . . . . . . . . . . . . . . . . . . . . . . . . . . . . . . . . . . . . . . . . . . . . . . . . . . . . . . . . . . . . . : . . . . . 149<br />
22. Total number <strong>of</strong> microorganisms cultured on Rosenfeld's sulfate-hydrocarbon medium per ml <strong>of</strong> sediment<br />
collected at the control sites . . . . . . . . . . . . . . . . . . . . . . . . . . . . . . . . . . . . . . . . . . . . . . . . . . . . . . . . . . . . . . . . . . . . . . . . . . . . . . . . . . . . . . . . . . . . . 150<br />
23 . Total number <strong>of</strong> microorganisms cultured in Rosenfeld's sulfate-hydrocarbon medium per ml <strong>of</strong> sediment<br />
collected at the primary platforms . . . . . . . . . . . . . . . . . . . . . . . . . . . . . . . . . . . . . . . . . . . . . . . . . . . . . . . . . . . . . . . . . . . . . . . . . . . . . . . . . . . . . . . . . . . . ISO<br />
24 . Total number <strong>of</strong> microorganisms cultured in Rosenfeld's sulfate-hydrocarbon medium per ml <strong>of</strong> sediment<br />
collected at the secondary platforms during Cruise II . . . . . . . . . . . . . . . . . . . . . . . . . . . . . . . . . . . . . . . . . . . . . . . . . . . . . . . . . . . . . . . . . . . . 151<br />
25 . Concentrations <strong>of</strong> inorganic nutrients (Ng atom/kg dry weight sediment) in sediments collected from control<br />
sites during Cruise I . . . . . . . . . . . . . . . . . . . . . . . . . . . . . . . . . . . . . . . . . . . . . . . . . . . . . . . . . . . . . . . . . . . . . . . . . . . . . . . . . . . . . . . . . . . . . . . . . . . . . . . . . 151<br />
26 . Concentrations <strong>of</strong> inorganic nutrients (fig atom/kg dry weight sediment) in sediments collected from con-<br />
27 .<br />
trol sites during Cruise II . . . . . . . . . . . . . . . . . . . . . . . . . . . . . . . . . . . . . . . . . . . . . . . . . . . . . . . . . . . . . . . . . . . . . . . . . . . . . . . . . . . . . . . . . . . . . . . . . . . . . . . . 151<br />
Concentrations <strong>of</strong> inorganic nutrients (ug atom/kg dry weight sediment) in sediments collected from control<br />
sites during Cruise III . . . . . . . . . . . . . . . . . . . . . . . . . . . . . . . . . . . . . . . . . . . . . . . . . . . . . . . . . . . . . . . . . . . . . . . . . . . . . . . . . . . . . . . . . . . . . . . . . . . . . . 153<br />
28 . Concentrations <strong>of</strong> inorganic nutrients (fig atom/kg dry weight sediment) in sediments collected from primary<br />
platforms during Cruise I . . . . . . . . . . . . . . . . . . . . . . . . . . . . . . . . . . . . . . . . . . . . . . . . . . . . . . . . . . . . . . . . . . . . . . . . . . . . . . . . . . . . . . . . . . . . . . . . 153<br />
29 . Concentrations <strong>of</strong> inorganic nutrients (Ng atom/kg dry weight sediment) in sediments collected from primary<br />
platforms during Cruise II . . . . . . . . . . . . . . . . . . . . . . . . . . . . . . . . . . . . . . . . . . . . . . . . . . . . . . . . . . . . . . . . . . . . . . . . . . . . . . . . . . . . . . . . . . . . . . 154<br />
30 . Concentrations <strong>of</strong> inorganic nutrients (fig atom/kg dry weight sediment) in sediments collected from primary<br />
platforms during Cruise III . . . . . . . . . . . . . . . . . . . . . . . . . . . . . . . . . . . . . . . . . . . . . . . . . . . . . . . . . . . . . . . . . . . . . . . . . . . . . . . . . . . . . . . . . . . . . 154<br />
31 . Concentrations <strong>of</strong> inorganic nutrients (fig atom/kg dry weight sediment) in sediments collected from secondary<br />
platforms during Cruise II . . . . . . . . . . . . . . . . . . . . . . . . . . . . . . . . . . . . . . . . . . . . . . . . . . . . . . . . . . . . . . . . . . . . . . . . . . . . . . . . . . . . . . . . . . . 155<br />
32 . Purpose <strong>of</strong> test systems shown in TABLE 6 . . . . . . . . . . . . . . . . . . . . . . . . . . . . . . . . . . . . . . . . . . . . . . . . . . . . . . . . . . . . . . . . . . . . . . . . . . . . . . . . 155<br />
33 . Oxygen consumption ('x t S) by microorganisms from Cruise I control site sediments in test systems 1-8<br />
(see TABLE 6) . . . . . . . . . . . . . . . . . . . . . . . . . . . . . . . . . . . . . . . . . . . . . . . . . . . . . . . . . . . . . . . . . . . . . . . . . . . . . . . . . . . . . . . . . . . . . . . . . . . . . . . . . . . . . . . . . . . . . 156<br />
34 . Oxygen consumption (x- t S) by microorganisms from Cruise I platform site sediments in test systems 1-8<br />
(see TABLE 6) . . . . . . . . . . . . . . . . . . . . . . . . . . . . . . . . . . . . . . . . . . . . . . . . . . . . . . . . . . . . . . . . . . . . . . . . . . . . . . . . . . . . . . . . . . . . . . . . . . . . . . . . . . . . . . . . . . . . . 156<br />
35 . Oxygen consumption ('x * S) by microorganisms from Cruise II control site sediments in test systems 1-8<br />
(see TABLE 6) . . . . . . . . . . . . . . . . . . . . . . . . . . . . . . . . . . . . . . . . . . . . . . . . . . . . . . . . . . . . . . . . . . . . . . . . . . . . . . . . . . . . . . . . . . . . . . . . . . . . . . . . . . . . . . . . . . . . . 157<br />
vi
LIST OF TABLES (coat'd)<br />
Page<br />
36.<br />
37 .<br />
38 .<br />
39 .<br />
40 .<br />
41 .<br />
42 .<br />
43 .<br />
44 .<br />
45 .<br />
46 .<br />
47 .<br />
48 .<br />
49 .<br />
50 .<br />
51 .<br />
52 .<br />
53 .<br />
54.<br />
SS .<br />
56 .<br />
57 .<br />
58 .<br />
59.<br />
60.<br />
61 .<br />
62.<br />
63 .<br />
64.<br />
65 .<br />
66.<br />
Oxygen consumption (T t S) by microorganisms from Cruise II platform site sediments in test systems 1-8<br />
(see TABLE 6) . . . . . . . . . . . . . . . . . . . . . . . . . . . . . . . . . . . . . . . . . . . . . . . . . . . . . . . . . . . . . . . . . . . . . . . . . . . . . . . . . . . . . . . . . . . . . . . . . . . . . . . . . . . . . . . . . . . . . 157<br />
Oxygen consumption ('x t S) by microorganisms from Cruise III control site sediments in test systems 1-8<br />
(see TABLE 6) . . . . . . . . . . . . . . . . . . . . . . . . . . . . . . . . . . . . . . . . . . . . . . . . . . . . . . . . . . . . . . . . . . . . . . . . . . . . . . . . . . . . . . . . . . . . . . . . . . . . . . . . . . . . . . . . . . . . . 158<br />
Oxygen consumption (X :t S) by microorganisms from Cruise III platform site sediments in test systems 1-8<br />
(see TABLE 6) . . . . . . . . . . . . . . . . . . . . . . . . . . . . . . . . . . . . . . . . . . . . . . . . . . . . . . . . . . . . . . . . . . . . . . . . . . . . . . . . . . . . . . . . . . . . . . . . . . . . . . . . . . . . . . . . . . . . . 158<br />
Respiration rates for enrichment cultures <strong>of</strong> primary platform and control site sediment microorganisms<br />
during oxidation <strong>of</strong> Empire Mix crude oil . . . . . . . . . . . . . . . . . . . . . . . . . . . . . . . . . . . . . . . . . . . . . . . . . . . . . . . . . . . . . . . . . . . . . . . . . . . . . . . . . . . 161<br />
Respiration rate for pure cultures during oxidation <strong>of</strong> Empire Mix crude oil . . . . . . . . . . . . . . . . . . . . . . . . . . . . . . . . . . . . . . . 170<br />
Concentrations <strong>of</strong> NH4-N, N03-N, and N02-N in systems inoculated with sediment from Primary Platform<br />
1 collected during Cruise I and tested for nitrification . . . . . . . . . . . . . . . . . . . . . . . . . . . . . . . . . . . . . . . . . . . . . . . . . . . . . . . . . . . . 174<br />
Concentration <strong>of</strong> nitrogen (N2) in test, control, and oil-supplemented systems inoculated with sediment<br />
from Primary Platform 1 collected during Cruise I and tested for nitrogen fixation . . . . . . . . . . . . . . . . . . . . . . . . . . . . . . 174<br />
Concentration <strong>of</strong> nitrogen (N2) in systems inoculated with sediment from Primary Platform I collected<br />
during Cruise I and tested for denitrification . . . . . . . . . . . . . . . . . . . . . . . . . . . . . . . . . . . . . . . . . . . . . . . . . . . . . . . . . . . . . . . . . . . . . . . . . . . . . . . 174<br />
Concentrations <strong>of</strong> insoluble (I) and soluble (S) 35S in test, control, and oil-supplemented systems inoculated<br />
with sediment and tested for sulfate reduction . . . . . . . . . . . . . . . . . . . . . . . . . . . . . . . . . . . . . . . . . . . . . . . . . . . . . . . . . . . . . . . . . . . . . . 175<br />
Concentrations <strong>of</strong> insoluble (I) and soluble (S) ;SS in test, control, and oil-supplemented systems inoculated<br />
with sediment from replicate 1, Primary Platform 1, and tested for sulfur oxidation . . . . . . . . . . . . . . . . . . . . . . 176<br />
Change in dissolved oxygen concentration (DO) in systems inoculated with sediment collected during<br />
Cruise I and tested for photosynthesis (PP) and metabolic activity (MA) . . . . . . . . . . . . . . . . . . . . . . . . . . . . . . . . . . . . . . . . . . . . 176<br />
COZ produced from glucose (expressed as percent C02-C/Total C) in systems inoculated with sediment<br />
collected during Cruise I and tested for heterotrophic activity. . . . . . . . . . . . . . . . . . . . . . . . . . . . . . . . . . . . . . . . . . . . . . . . . . . . . . . . . . 178<br />
COZ produced from glucose (expressed as percent C02-C/Total C) in systems inoculated with sediment<br />
collected during Cruise II and tested for heterotrophic activity . . . . . . . . . . . . . . . . . . . . . . . . . . . . . . . . . . . . . . . . . . . . . . . . . . . . . . . . 179<br />
COZ produced from glucose (expressed as percent C02-C/Total C) in systems inoculated with sediment<br />
collected during Cruise III and tested for heterotrophic activity . . . . . . . . . . . . . . . . . . . . . . . . . . . . . . . . . . . . . . . . . . . . . . . . . . . . . . . 180<br />
Concentrations <strong>of</strong> insoluble (I) and soluble (S) 32P in systems inoculated with sediment collected from Primary<br />
Platform 1 during Cruise I and tested for phosphate uptake . . . . . . . . . . . . . . . . . . . . . . . . . . . . . . . . . . . . . . . . . . . . . . . . . . . . 182<br />
COZ produced from tripalmitin (expressed as percent C02-C/Total C) in systems inoculated with sediment<br />
collected during Cruise I and tested for lipolysis . . . . . . . . . . . . . . . . . . . . . . . . . . . . . . . . . . . . . . . . . . . . . . . . . . . . . . . . . . . . . . . . . . . . . . . . . . . 183<br />
COZ produced from tripalmitin (expressed as percent C02-C/Total C) in systems inoculated with sediment<br />
collected during Cruise II and tested for lipolysis . . . . . . . . . . . . . . . . . . . . . . . . . . . . . . . . . . . . . . . . . . . . . . . . . . . . . . . . . . . . . . . . . . . . . . . . . . 184<br />
COZ produced from tripalmitin (expressed as percent C02-C/Total C) in systems inoculated with sediment<br />
collected during Cruise III and tested for lipolysis . . . . . . . . . . . . . . . . . . . . . . . . . . . . . . . . . . . . . . . . . . . . . . . . . . . . . . . . . . . . . . . . . . . . . . . . 185<br />
Quantity <strong>of</strong> COZ produced from chitin in systems inoculated with sediment from Cruise I . . . . . . . . . . . . . . . . . . . . . . 186<br />
Quantity <strong>of</strong> COZ produced from chitin in systems inoculated with sediment from Cruise II . . . . . . . . . . . . . . . . . . . . . 187<br />
Quantity <strong>of</strong> COZ produced from chitin in systems inoculated with sediment from Cruise III . . . . . . . . . . . . . . . . . . . . 188<br />
COZ produced from cellulose (expressed as percent C02-C/Total C) in systems inoculated with sediment<br />
collected during Cruise I . . . . . . . . . . . . . . . . . . . . . . . . . . . . . . . . . . . . . . . . . . . . . . . . . . . . . . . . . . . . . . . . . . . . . . . . . . . . . . . . . . . . . . . . . . . . . . . . . . . . . . . . 190<br />
COZ produced from cellulose (expressed as percent CO.-C/Total C) in systems inoculated with sediment<br />
collected during Cruise II . . . . . . . . . . . . . . . . . . . . . . . . . . . . . . . . . . . . . . . . . . . . . . . . . . . . . . . . . . . . . . . . . . . . . . . . . . . . . . . . . . . . . . . . . . . . . . . . . . . . . . . 191<br />
COZ produced from cellulose (expressed as percent C02-C/Total C) in systems inoculated with sediment<br />
collected during Cruise III . . . . . . . . . . . . . . . . . . . . . . . . . . . . . . . . . . . . . . . . . . . . . . . . . . . . . . . . . . . . . . . . . . . . . . . . . . . . . . . . . . . . . . . . . . . . . . . . . . . . . . 192<br />
COZ produced from bovine serum albumin (expressed as percent C02-C/Total C) in systems inoculated<br />
with sediment collected during Cruise I and tested for proteolysis . . . . . . . . . . . . . . . . . . . . . . . . . . . . . . . . . . . . . . . . . . . . . . . . . . . . . 193<br />
COZ produced from bovine serum albumin (expressed as percent C02-C/Total C) in systems inoculated<br />
with sediment collected during Cruise II and tested for proteolysis . . . . . . . . . . . . . . . . . . . . . . . . . . . . . . . . . . . . . . . . . . . . . . . . . . . . 194<br />
COZ produced from bovine serum albumin (expressed as percent C02-C/Total C) in systems inoculated<br />
with sediment collected during Cruise III and tested for proteolysis . . . . . . . . . . . . . . . . . . . . . . . . . . . . . . . . . . . . . . . . . . . . . . . . . . 195<br />
Impact <strong>of</strong> oil on metabolic activity and photosynthesis <strong>of</strong> Nostoc muscorum ATCC p 27347 . . . . . . . . . . . . . . . . . . . 196<br />
Rank <strong>of</strong> primary platform (P1-P4), secondary platforms (SS-S20) and control sites (C21-C24) sampled<br />
during Cruise II . . . . . . . . . . . . . . . . . . . . . . . . . . . . . . . . . . . . . . . . . . . . . . . . . . . . . . . . . . . . . . . . . . . . . . . . . . . . . . . . . . . . . . . . . . . . . . . . . . . . . . . . . . . . . . . . . . . 204<br />
Rank and Duncan subsets <strong>of</strong> sites as established by microbial enumerations . . . . . . . . . . . . . . . . . . . . . . . . . . . . . . . . . . . . . . . . 204<br />
Rank <strong>of</strong> primary platform and control sites for Cruises I, II, and III from highest to lowest based on<br />
ABOA as a percentage <strong>of</strong> the total aerobic heterotrophic bacterial population . . . . . . . . . . . . . . . . . . . . . . . . . . . . . . . . . . . . . 205<br />
vii
ABSTRACT<br />
The objectives <strong>of</strong> this investigation were (1) to make comparisons between platform areas and control sites in terms<br />
<strong>of</strong> various microbial populations and nutrient chemicals, (2) to estimate the hydrocarbon-oxidizing potential <strong>of</strong> sediments<br />
from the sampling sites, and (3) to obtain information on the occurrence and magnitude <strong>of</strong> microbial processes<br />
in the sediments, and to determine the impact <strong>of</strong> oil on these processes .<br />
While at times there were statistically significant differences between platform sites and control sites in terms <strong>of</strong><br />
some parameters, it was concluded that nature's activities masked man's activities to such an extent that meaningful<br />
cause and effect relationships were obscured .<br />
The sediments demonstrated cellulolytic, chitinolytic, heterotrophic, lipolytic, and proteolytic processes, as well as<br />
sulfur oxidation, which were not adversely affected by low levels <strong>of</strong> crude oil . The following processes did not occur at<br />
demonstrable levels : denitrification, nitrification, nitrogen fixation, phosphorus uptake, photosynthesis, and sulfate<br />
reduction.<br />
The maximum oil-degrading potential <strong>of</strong> the sediments was 56 Mg hydrocarbon-carbon oxidized to carbon dioxide<br />
per ml <strong>of</strong> sediment per twenty-four hours .<br />
Sediment samples could be frozen at 20 C and then analyzed within seven days without causing a statistically significant<br />
difference in microbial counts .<br />
Overall, it was concluded that :<br />
(1) The transient nature <strong>of</strong> the surficial sediments and the impact <strong>of</strong> nature's activity precluded drawing any<br />
meaningful conclusions in regard to cause and effect relationships between micr<strong>of</strong>lora and chemical nutrients<br />
in the sediments and the presence <strong>of</strong> oil production platforms,<br />
(2) those microbial processes in the sediments which demonstrated activity were not adversely affected by low levels<br />
<strong>of</strong> oil, and<br />
(3) the surf icial sediments in the entire area have similar oil-degrading potentials .<br />
ix
I . INTRODUCTION<br />
Microorganisms are responsible for the degradation<br />
<strong>of</strong> much <strong>of</strong> the organic matter that enters estuarine and<br />
marine environments . Pollutants entering the marine<br />
environment may cause several changes in the microbial<br />
community including : (I) inhibiting desirable microbes,<br />
(2) enhancing the growth <strong>of</strong> undesirable microbes, (3)<br />
shifting the protozoan populations (Coler and Gunner,<br />
1969), (4) producing toxic metabolic by-products<br />
(Brown et al ., 1969), and (5) promoting biological magnification<br />
<strong>of</strong> materials toxic to higher members <strong>of</strong> the<br />
food chain .<br />
Since the earliest recorded oil spill in 1907 (Bourne,<br />
1968), the number <strong>of</strong> reports concerning oil pollution<br />
has increased significantly to the point where it is no<br />
longer possible for one individual to be an expert on all<br />
aspects <strong>of</strong> oil pollution . Published information concerning<br />
oil pollution includes at least 2500 scientific manuscripts<br />
(Moulder and Varley, 1971, 1975 ; Samson et al .,<br />
1980) as well as popular articles and books (Marx, 1971 ;<br />
Nelson-Smith, 1973 ; Boesch, Hershner, and Milgram,<br />
1974) . A number <strong>of</strong> symposia directed at the problem <strong>of</strong><br />
oil pollution have been organized (Carthy and Arthur,<br />
1968 ; Anon ., 1969, 1971, 1973, 1974, 1975, 1976, 1977,<br />
1979, 1981 ; Hoult, 1969 ; Holmes and Dewitt, 1970;<br />
Cowell, 1971 ; Hepple, 1971 ; D'Emidio, 1972) . Textbooks<br />
on petroleum microbiology have been published<br />
(Sharpley, 1966 ; Davis, 1967) and several reviews on the<br />
subject are available (ZoBell, 1969; Friede et al., 1972 ;<br />
Atlas and Bartha, 1973 ; Crow, Meyers, and Ahearn,<br />
1974 ; Colwell and Walker, 1977) . Workshops have been<br />
conducted on the general (National Academy <strong>of</strong> Sciences,<br />
1975) and microbiological aspects <strong>of</strong> oil pollution<br />
(Ahearn and Meyers, 1973) .<br />
Despite the plethora <strong>of</strong> information that has been<br />
written on oil pollution, the long-term (chronic) effects<br />
<strong>of</strong> oil pollution resulting from seeps, spills, and especially<br />
from exploratory and developmental drilling are<br />
uncertain . In order to provide information on the chronic<br />
effects <strong>of</strong> oil pollution, studies are being and have been<br />
performed by Woods Hole Oceanographic Institute<br />
(WHOI) to examine the chronic effects <strong>of</strong> oil spilled<br />
from the barge Florida (Blumer et al ., 1972 ; Blumer and<br />
Sass, 1972a,6; Zafiriou, Blumer and Myers, 1972) . One<br />
<strong>of</strong> the earliest and reportedly exhaustive studies <strong>of</strong> the<br />
effects <strong>of</strong> chronic exposure to oil was the two-year <strong>of</strong>fshore<br />
Ecology Investigation (OEI), sponsored by the<br />
Gulf Universities Research Consortium (GURC) . This<br />
research, funded by 80 petroleum and petroleum-related<br />
industries, was initiated to assess the environmental impact<br />
<strong>of</strong> petroleum drilling and production <strong>of</strong>f the coast<br />
<strong>of</strong> Louisiana . Based on OEI data, it was concluded that<br />
79% <strong>of</strong> the investigations demonstrated either a beneficial<br />
or at least no harmful impact from exploratory and<br />
developmental drilling . The other 21016 <strong>of</strong> the investigations<br />
required further study but did not demonstrate<br />
harmful effects. Recently, evaluations <strong>of</strong> the OEI data<br />
(Ward, Bender, and Reish, 1979) and other studies suggest<br />
that chronic exposure to petroleum may indeed be<br />
harmful to certain marine organisms . Thus, after many<br />
years <strong>of</strong> exploratory and developmental drilling for petroleum,<br />
we still may not be able to identify harmful<br />
effects to marine organisms resulting from chronic exposure<br />
to oil .<br />
In an attempt to correct this deficiency, federal<br />
agencies-in <strong>part</strong>icular the De<strong>part</strong>ment <strong>of</strong> Commerce's<br />
National Oceanic and Atmospheric Administration<br />
(NOAA) and the De<strong>part</strong>ment <strong>of</strong> Interior's Bureau <strong>of</strong><br />
Land Management (BLM) have funded studies to : (1)<br />
collect baseline data at potential <strong>of</strong>fshore drilling sites<br />
and (2) determine the impact <strong>of</strong> exploratory and developmental<br />
drilling .<br />
Even before the first <strong>of</strong> these studies was contemplated,<br />
investigations were done specifically to collect<br />
baseline data in the South Atlantic Bight (Colwell et al .,<br />
1976 ; Conrad, Walker, and Colwell, 1976 ; Seesman,<br />
Walker, and Colwell, 1976) . After these studies were<br />
done, the federal agencies mentioned above initiated<br />
studies to collect baseline data in northeastern U . S . waters,<br />
George's Bank ; in central eastern waters, Baltimore<br />
Canyon ; in southeastern waters, South Atlantic<br />
Bight (Texas Instruments, 1979) ; in south central waters,<br />
South Texas Outer Continental Shelf (OCS) (University<br />
<strong>of</strong> Texas Marine Science Institute, 1979) ; and in<br />
northwestern waters [Alaskan Continental Shelf (OCS<br />
Environmental Assessment Program, 1979)] .<br />
In the absence <strong>of</strong> baseline data, research to determine<br />
the impact <strong>of</strong> exploratory and developmental petroleum<br />
drilling has focused on the need to compare the<br />
biological, chemical, and physical properties <strong>of</strong> petroleumdrilling<br />
environments with similar properties <strong>of</strong> nonpetroleum-drilling<br />
environments (control sites) . In addition<br />
to the present study, at least three other studies<br />
have been done to assess the ecological impact <strong>of</strong> exploratory<br />
and developmental drilling . Templeton et al .<br />
(1975) examined several sites in Lake Maracaibo, Venezuela,<br />
in an attempt to evaluate the effects <strong>of</strong> 60 years <strong>of</strong><br />
exploratory and developmental drilling . Although they<br />
did not designate any <strong>of</strong> the sites as controls and did not<br />
report any microbiology studies, they concluded that<br />
the drilling operation did not cause discernible ecological<br />
damage, but that discharge <strong>of</strong> domestic and industrial<br />
waste into the lake may contribute to the deterioration<br />
<strong>of</strong> water quality and reduce the biological resources<br />
<strong>of</strong> the lake . The OEI (briefly described above) has been<br />
the subject <strong>of</strong> some controversy, since many <strong>of</strong> the studies<br />
managed to evade the process <strong>of</strong> peer-review publication<br />
; and when papers describing these studies were finally<br />
published, many <strong>of</strong> the conclusions appeared to<br />
disqualify statements made in earlier reports (Walton,<br />
1981) . The third study focused on one active production<br />
platform and its satellites in the Buccaneer oil and gas<br />
field, and a nearby control site. Sizemore and Olsen<br />
(1980) examined the bacterial communities <strong>of</strong> the oil<br />
field and control area . They concluded that similar<br />
numbers and types <strong>of</strong> bacteria existed at both the Buccaneer<br />
field and the control site, except for some seasonal<br />
differences and increases in oil-degrading and sulfuroxidizing<br />
bacteria :in the producing field . Recently, Hada<br />
and Sizemore (1981) reported an increase in plasmidbearing<br />
strains <strong>of</strong> marine Vibrio spp . at the oil and gas<br />
field, and concluded that the increase in plasm incidence<br />
and diversity may have resulted from platform discharges<br />
. In a rather extensive Environmental Protection<br />
123
Agency (EPA) sponsored project, a number <strong>of</strong> chronic<br />
effects <strong>of</strong> low level oil pollution were reported, including<br />
an increased incidence <strong>of</strong> fin rot in fish caused by a<br />
Vi6rio spp . (tiles, Brown, and Minchew, 1978 ; Brown,<br />
1980) .<br />
The present study was designed, using appropriate<br />
controls, to assess the ecological impact resulting from a<br />
number <strong>of</strong> <strong>of</strong>fshore production operations . It appears<br />
to be the first study designed to obtain detailed information<br />
on the microbial communities at several production<br />
platforms and control sites during different seasons .<br />
The objectives <strong>of</strong> this investigation were to obtain :<br />
(1) a sufficient amount <strong>of</strong> information on the cell densities<br />
<strong>of</strong> several types <strong>of</strong> microorganisms and the quantities<br />
<strong>of</strong> certain chemical nutrients in order to make comparisons<br />
between Platform areas and Control Sites, (2)<br />
a sufficient amount <strong>of</strong> information to approximate the<br />
hydrocarbon-oxidizing potential <strong>of</strong> sediments from the<br />
sampling areas, and (3) information on the occurrence<br />
and magnitude <strong>of</strong> various microbial processes in the<br />
sediments and to determine the effect <strong>of</strong> oil on these<br />
processes .<br />
Toward achieving these objectives, five groups <strong>of</strong><br />
sediment microorganisms were enumerated : aerobic<br />
heterotrophic bacteria ; aerobic molds and yeasts ;<br />
nitrate-reducing, hydrocarbon-utilizing microorganisms;<br />
and sulfate-reducing, hydrocarbon-utilizing microorganisms<br />
. Twelve selected sediment microbial processes<br />
were examined : nitrification, nitrogen fixation,<br />
denitrification, sulfate reduction, sulfur oxidation, photosynthesis,<br />
heterotrophic activity, phosphorus uptake,<br />
lipolysis, chitinolysis, cellulolysis, and proteolysis, and<br />
studies concurrently performed to examine the effects<br />
<strong>of</strong> crude oil on these twelve processes . Concentrations<br />
<strong>of</strong> six sediment nutrients were determined : total nitrogen,<br />
ammonium, nitrate, nitrite, total phosphorus<br />
and phosphate . During studies to evaluate rates <strong>of</strong><br />
petroleum degradation, variations in temperature and<br />
concentrations <strong>of</strong> nitrogen, phosphorus, and crude oil<br />
were made . In addition to the studies prescribed by the<br />
original contract, studies were also performed to determine<br />
the effect <strong>of</strong> freezing and thawing on microbial<br />
populations and on the magnitude <strong>of</strong> selected microbial<br />
metabolic processes .<br />
At this time, some <strong>of</strong> the rationale employed in designing<br />
the overall microbiological aspects <strong>of</strong> this project<br />
should be explained . The first issue addressed in the<br />
overall project was the experimental design <strong>of</strong> the sampling<br />
program . Obviously, the greater the number <strong>of</strong><br />
replications, the greater the probability <strong>of</strong> statistical validation<br />
<strong>of</strong> the results . Cost effectiveness, however, dictated<br />
that the number <strong>of</strong> replications should be the minimum<br />
number required for statistical analysis . The microbiological<br />
sampling program was designed to achieve<br />
scientifically meaningful data at a minimal cost .<br />
The next issue considered was whether to conduct the<br />
analyses on-board ship or in a shore facility . The magnitude<br />
<strong>of</strong> the microbiological analyses required, coupled<br />
with the uncertainties <strong>of</strong> weather, argued strongly<br />
against on-board analyses, <strong>part</strong>icularly when costs were<br />
considered . Another possibility was to refrigerate the<br />
samples on-board ship and carry out the analyses at a<br />
shore laboratory . In order to ensure comparability <strong>of</strong><br />
results between cruises, the length <strong>of</strong> time <strong>of</strong> refrigeration<br />
had to be both minimal and constant . Once again,<br />
the uncertainties <strong>of</strong> weather and the cost <strong>of</strong> this method<br />
tended to rule it out as a viable option . All things considered,<br />
the only practical method <strong>of</strong> handling the sediment<br />
samples was to freeze them immediately after collection<br />
and maintain them in the frozen state until analyzed<br />
. It is noteworthy to point out that Stewart and<br />
Marks (1978) have shown that freezing for a period <strong>of</strong><br />
seven days does not significantly alter the microbial<br />
counts <strong>of</strong> marine sediments .<br />
124
II . METHODS AND MATERIALS<br />
A. Study Area and Sampling Design<br />
Samples for this program were collected at 20 platforms<br />
and four control sites located on the Louisiana<br />
OCS . These sites are contained in a roughly rectangular<br />
area lying west <strong>of</strong> the Mississippi Delta and extending<br />
from 5 km (3 miles) to 120 km (75 miles) <strong>of</strong>fshore and<br />
about 320 km (200 miles) west . Location <strong>of</strong> the study<br />
area is shown in Fig . 1 and characteristics <strong>of</strong> the study<br />
sites are given in Table 1 . The criteria used in the selection<br />
process included :<br />
" geographical location-only platforms in the<br />
north central Gulf <strong>of</strong> Mexico were considered ;<br />
" type <strong>of</strong> petroleum produced-gas and oil fields<br />
were considered, and designated control sites<br />
were selected because they had never been exposed<br />
to any exploratory, developmental, or production<br />
activities (Table 1) ;<br />
" age <strong>of</strong> platforms-platform age ranged from 4-24<br />
years (Table 1) ;<br />
" water depth and distance from shore-platforms<br />
and controls ranged in water depth from 4-98 meters<br />
and in distance from shore from 5-160 km<br />
(Table 1) ;<br />
" benthic sediment type-sediment was assigned a<br />
low priority because <strong>of</strong> the non-specific<br />
nature <strong>of</strong> the sediment texture, but most <strong>of</strong> the<br />
platforms exist in areas which are clayey-silt,<br />
sandy-silt, or silty-sand ;<br />
high production <strong>of</strong> commercial or recreational<br />
finfish or shellfish ;<br />
previous examination by other studies ;<br />
influence by documented oil spills .<br />
Many <strong>of</strong> these criteria are described in Table 1 .<br />
However, there are a few facts which distinguish some<br />
<strong>of</strong> these platforms and controls that were considered<br />
during the sampling design and which may influence<br />
populations or activities <strong>of</strong> sediment microbes .<br />
Primary Platform l-Dissolved oxygen (DO)<br />
depletion occurs during the late summer ; conditions<br />
appear to exist which would favor the<br />
accumulation <strong>of</strong> petroleum hydrocarbons<br />
Primary Platform 2-DO depletion and brine<br />
production<br />
Primary Platform 3-Influenced by oceanic currents<br />
Secondary Platform 7-Conditions do not favor accumulation<br />
<strong>of</strong> hydrocarbons<br />
Secondary Platform 9-Relatively clean<br />
Secondary Platforms 10 and 11-DO depletion ; included<br />
in GURC's OEI<br />
Secondary Platform 12-1971 spill <strong>of</strong> 53,000 barrels<br />
<strong>of</strong> crude oil<br />
TABLE 1 . List <strong>of</strong> primary platforms (P), secondary platforms (S),<br />
and control sites (C) selected for this study<br />
Studya<br />
LOCATION<br />
Water<br />
Depth Year No . <strong>of</strong><br />
Distance<br />
from<br />
Lease<br />
Site Lat . N Long . W m Installed Wells Shore km Area<br />
P1 (0) 29007'42" 89°41'25" 18 1961 15 19 West Delta<br />
P2 (0) 29°02'50" 90009'46" 12 1954 24 5 Bay Marchand<br />
P3 (O/G) 28°39'25" 90014'08" 35 1968 11 42 South Timbalier<br />
P4 (O/G) 28°34'09" 90°24'32" 46 1964 9 53 South Timbalier<br />
SS (O/G) 29° 12'32'.' 89°32'23" 9 1962 1 6 West Delta<br />
S6 (O/G) 28057'08" 89041'02" 52 1965 24 42 West Delta<br />
S7 (O/G) 28°48'34" 89047'17" 65 1965 12 56 West Delta<br />
S8 (O/G) 28°57'37" 90001'25" 27 1957 10 27 Grand Isle<br />
S9 (O) 28044'04" 89044'07" 85 1965 7 64 West Delta<br />
S10 (O/G) 28049'53" 90°23'18" 20 1955 16 20 South Timbalier<br />
S11 (O/G) 28°49'3" 92°22'36" 20 1957 12 21 South Timbalier<br />
S12(0) 28°59'07" 90°09'41" 17 1965 17 11 South Timbalier<br />
S13(0) 28°56'48" 89042'23" 51 1968 24 41 West Delta<br />
S14 (G) 28°41'51" 91°37'21" 29 1973 12 68 Eugene Island<br />
S15 (G) 28° 10'02" 91 °29'39" 98 1974 2.1 115 Eugene Island<br />
S16 (G) 28028'28" 91 0 16'45" 45 1971 18 97 Ship Shoal<br />
S17(0) 280 13'35" 91041'05" 75 1972 18 120 Eugene Island<br />
S18(0) 28°48'50" 91'44'20" 25 1970 13 52 Eugene Island<br />
S19 (O) 28°51'34" 91°07'52" 6 1960 9 27 Ship Shoal<br />
S20 (G) 28o48'19" 90°36'29" 18 1969 9 21 Eugene Island<br />
C21 29° 12' 89°44' 3 - -- 9 West Delta<br />
C22 28°53' 90° 16' 21 - -- 10 South Timbalier<br />
C23 28°27' 90°38' 37 - -- 32 South Timbalier<br />
C24 28°SO' 91 °27' 18 - -- 39 Eugene Island<br />
a0 = oil production, G = gas production<br />
125
105 100° 95° 90° 85° BO° 75°<br />
35°<br />
30 San Antonio Houston New Orleans<br />
I<br />
e<br />
Coiuus Christi " ~<br />
~l/Ul~l/'<br />
STUDY AREA<br />
Ft. Myers<br />
25<br />
MEXICO<br />
~ n vana<br />
D<br />
CVB A<br />
YUCATAN<br />
20 SCALE<br />
0 100 200<br />
Nautical Miles<br />
30' ~ g1° 3p' gp° 9p<br />
Marsh I . i ¢ Jca<br />
'30' q Q ~f~ e o<br />
eat 41.<br />
11l<br />
r-4<br />
o, _<br />
9<br />
v v ~ c ~<br />
v<br />
Pt. Au Fer I . C~<br />
Ca~~o<br />
Terebonne<br />
p ~ `` ~ a~ ~ ~ 21<br />
Bay<br />
oe o.d ~ °~' 02<br />
zs°<br />
Timbalier Bay 12"; ' ~ 8 _<br />
" 18-<br />
M<br />
18<br />
14<br />
0<br />
13006<br />
19 22<br />
24 0<br />
20 10<br />
~ ~ 9 . . . . . . --9F<br />
-- -- -------------<br />
3<br />
.. ~<br />
. , r.<br />
5<br />
30' 18 23<br />
m<br />
V<br />
"<br />
.<br />
-------<br />
15 -- - - -- ---------------- ' ", ~<br />
0 PRIMARY SITES<br />
SECONDARY SITES<br />
A CONTROL SITES<br />
SCALE (kilometers)<br />
0 10 20 30 40<br />
FIG. 1 . Maps <strong>of</strong> the study area - (Top) Location <strong>of</strong> study area . (Bottom) Study area showing sampling sites .<br />
126
Secondary Platform 13-1967 spill <strong>of</strong> 160,000 barrels<br />
<strong>of</strong> crude oil<br />
Secondary Platform 14-Gas field<br />
Secondary Platform IS-Insignificant pollution<br />
Secondary Platform 19-Sandy sediment<br />
Control Site 21-Adjacent to Primary Platform 1<br />
and similar depth to Primary Platform 2 and<br />
Secondary Platform 5<br />
Control Site 22-Similar depth to Primary Platform<br />
2, and Secondary Platforms 8, 10, 11, and 12<br />
Control Site 23-Similar depth to Primary Platforms<br />
3 and 4, and Secondary Platform 16<br />
Control Site 24-Similar depth to Secondary Platforms<br />
14, 16, 18, 19, and 20 .<br />
Sediment samples were collected during three sampling<br />
cruises : Cruise I, May 1978 ; Cruise II, August-<br />
September 1978 ; and Cruise III, January 1979 . Four<br />
Primary Platforms (PI-P4) and four Control Sites<br />
(C21-C24) were sampled during each Cruise . During<br />
Cruise II, an additional 16 Secondary Platforms<br />
(SS-S20) were sampled . Four transects, one along each<br />
compass heading, were established at each primary site,<br />
a north transect was established at each secondary site,<br />
and a single sampling station was established at each<br />
control site . Samples collected at primary platforms<br />
were obtained at a distance <strong>of</strong> 500 m from the platform<br />
along each transect . Samples collected at secondary<br />
platforms were obtained at a distance <strong>of</strong> 500 m from the<br />
platform along the north transect .<br />
B. Sample Collection and Preparation<br />
Sampling methodology was maintained constant<br />
throughout the study, utilizing a modified Kahlsico0<br />
stainless steel Smith-McIntyre grab . All samples (at least<br />
200 ml) were scraped from the top 2 cm <strong>of</strong> each grab<br />
using a sterile wooden tongue depressor and placed in<br />
autoclaved sampling jars . All sample jars were contained<br />
in Styr<strong>of</strong>oam trays which were color-coded to<br />
expedite sample collection and identification . Additionally,<br />
each jar lid was color-coded, with the sample<br />
number painted on top . Appropriate labels preprinted<br />
and coded were placed on each jar immediately after the<br />
sample was collected . Sediments not used during shipboard<br />
sample processing were frozen at -20 C until processed<br />
. Samples were processed after 7-14 days <strong>of</strong> frozen<br />
storage .<br />
1 . Primary Platforms<br />
Four grabs were obtained at each 500-m sampling<br />
location N, S, E and W <strong>of</strong> the platforms . A total<br />
<strong>of</strong> 192 samples were collected (4 sediment samples x 4<br />
compass points x 4 platforms X 3 seasons) . Each <strong>of</strong> the<br />
192 samples was analyzed in triplicate for microbial<br />
populations using 6 different types <strong>of</strong> media (1,152<br />
analyses) and for 6 chemical nutrients (1,152 analyses) .<br />
For the on-board photosynthesis experiments,<br />
two 160-m1 composites were prepared for each primary<br />
platform by combining 20-m1 samples from two grabs at<br />
each <strong>of</strong> the four compass points and repeating the procedure<br />
for the remaining eight grabs . Twenty-four samples<br />
were analyzed for photosynthesis (2 composites X 4<br />
platforms x 3 seasons) .<br />
For the remaining microbial processes two 600-m1<br />
composite samples were prepared for each platform<br />
by combining 75-m1 samples from two grabs at each<br />
compass point, and repeating the procedure for the<br />
remaining eight grabs (2 composites x 4 platforms X 2<br />
seasons = 16 samples X 11 microbial processes = 176<br />
analyses for Cruises I and II) . However, results from<br />
Cruises I and II indicated that nitrogen fixation, denitrification,<br />
nitrification, sulfate reduction and phosphate<br />
uptake were not detected by the methods employed . An<br />
experiment was designed to determine if freezing and<br />
thawing <strong>of</strong> sediments might affect these processes . Ten<br />
150-m1 sediment samples from Primary Platform P2<br />
were collected and composited during Cruise III . Subsamples<br />
were removed, held at 0-4 C for 8-36 hours, and<br />
tested for the microbial processes indicated as well as<br />
for sulfur oxidation since the results on this process<br />
from Cruises I and II were not available at the time the<br />
change was initiated . The composite sample was frozen<br />
for 7 days at -20 C, thawed and re-tested . Samples for<br />
the processes that demonstrated activity were collected<br />
during Cruise III as described for Cruises I and II (2<br />
composites X 4 platforms = 8 samples x 5 processes =<br />
40 analyses) .<br />
To estimate the oil-degrading potential <strong>of</strong> sediment<br />
microorganisms, 7 .5 ml from each <strong>of</strong> the 64 grab<br />
samples (4 grabs x 4 compass points X 4 primary platforms)<br />
were used to prepare one composite sample for<br />
each cruise . A suspension <strong>of</strong> 3 .5 ml sediment/10 ml artificial<br />
seawater was made for each composite .<br />
2. Control Sites<br />
Eight grabs were obtained at each control site (8<br />
sediment samples x 4 controls X 3 seasons = 96 samples) .<br />
Four <strong>of</strong> the eight samples from each site were analyzed<br />
for microbial population using 6 different types <strong>of</strong><br />
media (288 analyses) and for 6 nutrients (288 analyses) .<br />
For the on-board photosynthesis experiments,<br />
two 40-m1 composites were prepared for each control<br />
site by combining 20-m1 samples from the first two<br />
grabs and repeating the procedure for the next two<br />
grabs . Twenty-four samples were analyzed for photosynthesis<br />
(2 composites x 4 controls X 3 seasons) .<br />
For the remaining microbial processes two 600-m1<br />
composites were prepared for each control site (2 composites<br />
X 4 controls X 2 seasons = 16 samples X 11 microbial<br />
processes = 176 analyses for Cruises I and II) . During<br />
Cruise III, ten 150-m1 sediment samples from Control<br />
Site C22 were composited and subsamples were<br />
removed, held at 0-4 C for 18-36 hours and tested for<br />
the microbial processes described above that may have<br />
been susceptible to freezing and thawing (also including<br />
sulfur oxidation) . Samples for the carbonaceous processes<br />
were collected as described for Cruises I and II (2<br />
composites x 4 platforms = 8 samples x 5 processes =<br />
40 analyses) .<br />
To estimate the oil-degrading potential <strong>of</strong> sediment<br />
microorganisms, 15 ml from each <strong>of</strong> the 32 grab<br />
samples (8 grabs X 4 controls) were used to prepare one<br />
composite sample for each cruise . A suspension <strong>of</strong> 3 .5 ml<br />
sediment/10 ml artificial seawater was made for each<br />
composite .<br />
3. Secondary Platforms<br />
Four grabs were obtained at the N500 station <strong>of</strong><br />
each secondary platform and the resulting sediment<br />
samples were analyzed for microbial populations and<br />
inorganic nutrients (4 sediment samples x 16 platforms<br />
= 64 samples) . Each <strong>of</strong> the 64 samples was enumerated<br />
in triplicate for microorganisms using 6 different types<br />
127
<strong>of</strong> media (384 analyses) and for 6 chemical nutrients<br />
(384 analyses) . Microorganisms from secondary platform<br />
samples were not evaluated for their contribution<br />
to the nitrogen, sulfur, phosphorus or carbon cycles, or<br />
for their oil-degrading potential .<br />
C. Materials<br />
All water used in this project was glass distilled . All<br />
inorganic chemicals were reagent grade, and all organic<br />
solvents were analytical grade .<br />
Except where specifically noted in the text, all artificial<br />
seawater was made with Rila Marine MixO (Rila<br />
Products, Teaneck, NJ) to a final measured salinity <strong>of</strong><br />
30 <strong>part</strong>s per thousand (ppt) .<br />
All <strong>of</strong> the oil produced in the Gulf Coastal Area is<br />
typified by Empire Mix crude oil (parafinic 70-75%,<br />
API 30-35°) which was kindly supplied by Standard Oil<br />
Co . (KY), Pascagoula Refinery, Pascagoula, MS .<br />
Radioisotopes (elemental 33S, Na233S04, KZH32P04,<br />
"°C-glucose, '°Gtripalmiun, "IC-cellulose, and '°C-bovine<br />
serum albumin) were obtained from ICN, Irvine, CA .<br />
The counting cocktail used for the water-soluble<br />
fractions <strong>of</strong> the radioisotopic processes was Scinti-<br />
VerseO Universal Cocktail obtained from Fisher Scientific<br />
Co ., Atlanta, GA, while the cocktail used for the<br />
gas phase and insoluble (oxidized) fractions was Permafluor<br />
VO obtained from Packard Instrument Company,<br />
Downers Grove, IL .<br />
D .<br />
Sample Analysis<br />
1 . Aerobic Heterotrophic Bacteria<br />
Total numbers <strong>of</strong> marine aerobic heterotrophic<br />
bacteria were enumerated on spread plates <strong>of</strong> Bacto-<br />
Marine Agar (DifcoO) . Plates were incubated for 5-7<br />
days at 20 C . An additional 40 samples (20 from a platform<br />
and 20 from a control site) taken during Cruise<br />
III, analyzed immediately for aerobic heterotrophic<br />
bacteria, and then frozen . After 7, 45, and 90 days <strong>of</strong><br />
freezing, an aliquot <strong>of</strong> each sample was thawed and<br />
replated as above .<br />
2. Oil-Degrading Bacteria<br />
Oil-degrading bacteria were enumerated using<br />
the spread plate technique and modified ZoBell Marine<br />
Agar (ZoBell, 1946) with 0.58% Empire Mix crude oil<br />
substituted for the carbon sources (peptones, yeast<br />
extract, and ferric citrate) and supplemented with<br />
1 % (w/v) ammonium nitrate as a nitrogen source . Previous<br />
experience has demonstrated that the oil adequately<br />
disperses without emulsifying agents in the<br />
reconstituted marine agar plates when the sterilized medium<br />
is overlayed prior to use with the same medium<br />
prepared using oil-saturated water but without oil .<br />
Modified ZoBell Marine Agar without oil was used as a<br />
control medium to monitor the growth <strong>of</strong> non-oildegrading<br />
bacteria which could utilize agar and/or any<br />
organic contaminants as a carbon source . Numbers <strong>of</strong><br />
non-oil-degrading bacteria were subtracted from the<br />
number <strong>of</strong> bacteria appearing on the oil-agar plates to<br />
provide an indication <strong>of</strong> the total number <strong>of</strong> oil-degrading<br />
bacteria . Plates were incubated for 5-7 days at 20 C .<br />
3 . Yeasts and Fungi<br />
Enumeration <strong>of</strong> yeasts and fungi was achieved<br />
by plating appropriate dilutions <strong>of</strong> each sample onto<br />
two different selective media (DifcoO Potato Dextrose<br />
Agar and DifcoO Cooke Rose Bengal Agar) . Both<br />
media were prepared with RilaO Sea Salts at a salinity<br />
<strong>of</strong> 30 ppt . The spread-plate technique was used, and the<br />
plates were incubated for 5-7 days at 20 C .<br />
4. Nitrate-Reducing, Hydrocarbon-Utilizing Microorganisms<br />
Most Probable Number (MPN) tubes (3 per inoculum)<br />
containing nitrate-reducing medium (Rosenfeld's<br />
Patent No . 2,921,007, Tables 2, 3, and 4) were inoculated<br />
with 1/10,1/100, and 1/1000-m1 sediment and<br />
incubated for 3 weeks at 20 C . After 21 days, positive<br />
tubes were determined by spot tests for nitrite employing<br />
sulfanilic acid and a-naphthylamine reagents using<br />
the procedure described in Standard Methods for the<br />
Examination <strong>of</strong> Water and Wastewater, 14th edition,<br />
hereinafter referred to as Standard Methods (American<br />
Public Health Association, 1975) . Negative tubes were<br />
retested after 120 days incubation .<br />
S. Sulfate-Reducing, Hydrocarbon-Utilizing Microorganisms<br />
MPN tubes (3 per inoculum) containing Rosenfeld's<br />
sulfate-reducing medium (Table 5) were inoculated<br />
with 1/10, 1/100, and 1/1000-m1 sediment and<br />
incubated for 3 weeks at 20 C . Blackening <strong>of</strong> the agar<br />
was indicative <strong>of</strong> sulfate reduction . Negative tubes were<br />
re-examined after 120 days .<br />
TABLE 2 . Medium for nitrate-reducing, hydrocarbon-utilizing microorganismsa<br />
Component<br />
Amount<br />
FeS04 . . . . . . . . . . . . . . . . . . . . . . . . . . . . . . . . . . . . . . . . . . . . . . . . . . . . . . . . . . . . . . . . . . . . . . . . . . . . . . . . . . . . . . . . . . . . . . . . . . . . . . . . . . . . . . . . . . . . . . 0 .1 g<br />
KZHPO4 . . . . . . . . . . . . . . . . . . . . . . . . . . . . . . . . . . . . . . . . . . . . . . . . . . . . . . . . . . . . . . . . . . . . . . . . . . . . . . . . . . . . . . . . . . . . . . . . . . . . . . . . . . . . . . . . . . . 0 .5 g<br />
KN03 . . . . . . . . . . . . . . . . . . . . . . . . . . . . . . . . . . . . . . . . . . . . . . . . . . . . . . . . . . . . . . . . . . . . . . . . . . . . . . . . . . . . . . . . . . . . . . . . . . . . . . . . . . . . . . . . . . . . . . . 1 .O g<br />
Synthetic seawater (400 percent)b . . . . . . . . . . . . . . . . . . . . . . . . . . . . . . . . . . . . . . . . . . . . . . . . . . . . . . . . . . . . . . . . . . . . . . . . . . . . . . . . . . . . 25 .0 ml<br />
Distilled water . . . . . . . . . . . . . . . . . . . . . . . . . . . . . . . . . . . . . . . . . . . . . . . . . . . . . . . . . . . . . . . . . . . . . . . . . . . . . . . . . . . . . . . . . . . . . . . . . . . . . . . . . . . . 975 .0 ml<br />
pH Adj . to 7 .8 with KOH Bacto-agar . . . . . . . . . . . . . . . . . . . . . . . . . . . . . . . . . . . . . . . . . . . . . . . . . . . . . . . . . . . . . . . . . . . . . . . . . . . . . . . 2 .0 g<br />
Crude oil/water emulsionc . . . . . . . . . . . . . . . . . . . . . . . . . . . . . . . . . . . . . . . . . . . . . . . . . . . . . . . . . . . . . . . . . . . . . . . . . . . . . . . . . . . . . . . . . . . . . 50 .0 ml<br />
aTubed and sterilized in an autoclave at 121 C for IS min<br />
bSee TABLE 3<br />
See TABLE 4<br />
128
TABLE 3 . Composition <strong>of</strong> synthetic seawater (400 percent)<br />
Component<br />
Amount<br />
NaCl . . . . . . . . . . . . . . . . . . . . . . . . . . . . . . . . . . . . . . . . . . . . . . . . . . . . . . . . . . . . . . . . . . . . . . . . . . . . . . . . . . . . . . . . . . . . . . . . . . . . . . . . . . . . . . . . . . . . . . . . 778 .00 g<br />
Na2S04 . . . . . . . . . . . . . . . . . . . . . . . . . . . . . . . . . . . . . . . . . . . . . . . . . . . . . . . . . . . . . . . . . . . . . . . . . . . . . . . . . . . . . . . . . . . . . . . . . . . . . . . . . . . . . . . . . . . . . 130 .00 g<br />
MgC12.6H20 . . . . . . . . . . . . . . . . . . . . . . . . . . . . . . . . . . . . . . . . . . . . . . . . . . . . . . . . . . . . . . . . . . . . . . . . . . . . . . . . . . . . . . . . . . . . . . . . . . . . . . . . . . . . . . 352 .00 g<br />
CaC12.2H20 . . . . . . . . . . . . . . . . . . . . . . . . . . . . . . . . . . . . . . . . . . . . . . . . . . . . . . . . . . . . . . . . . . . . . . . . . . . . . . . . . . . . . . . . . . . . . . . . . . . . . . . . . . . . . . 36 .00 g<br />
KCl . . . . . . . . . . . . . . . . . . . . . . . . . . . . . . . . . . . . . . . . . . . . . . . . . . . . . . . . . . . . . . . . . . . . . . . . . . . . . . . . . . . . . . . . . . . . . . . . . . . . . . . . . . . . . . . . . . . . . . . . . 11 .OOg<br />
Na HC0 3 . . . . . . . . . . . . . . . . . . . . . . . . . . . . . . . . . . . . . . . . . . . . . . . . . . . . . . . . . . . . . . . . . . . . . . . . . . . . . . . . . . . . . . . . . . . . . . . . . . . . . . . . . . . . . . . . . . 3 .20 g<br />
Z<br />
KBr . . . . . . . . . . . . . . . . . . . . . . . . . . . . . . . . . . . . . . . . . . . . . . . . . . . . . . . . . . . . . . . . . . . . . . . . . . . . . . . . . . . . . . . . . . . . . . . . . . . . . . . . . . . . . . . . . . . . . . . . . 1 .60g<br />
SnCI z .6HZ0 . . . . . . . . . . . . . . . . . . . . . . . . . . . . . . . . . . . . . . . . . . . . . . . . . . . . . . . . . . . . . . . . . . . . . . . . . . . . . . . . . . . . . . . . . . . . . . . . . . . . . . . . . . . . . . . 0.67 g<br />
H3B03 . . . . . . . . . . . . . . . . . . . . . . . . . . . . . . . . . . . . . . . . . . . . . . . . . . . . . . . . . . . . . . . . . . . . . . . . . . . . . . . . . . . . . . . . . . . . . . . . . . . . . . . . . . . . . . . . . . . . . . 0 .41 g<br />
Na 2 Si03.9H20 . . . . . . . . . . . . . . . . . . . . . . . . . . . . . . . . . . . . . . . . . . . . . . . . . . . . . . . . . . . . . . . . . . . . . . . . . . . . . . . . . . . . . . . . . . . . . . . . . . . . . . . . . . . 0.08 g<br />
NaF . . . . . . . . . . . . . . . . . . . . . . . . . . . . . . . . . . . . . . . . . . . . . . . . . . . . . . . . . . . . . . . . . . . . . . . . . . . . . . . . . . . . . . . . . . . . . . . . . . . . . . . . . . . . . . . . . . . . . . . . . 0 .05 g<br />
NH a N0 3 . . . . . . . . . . . . . . . . . . . . . . . . . . . . . . . . . . . . . . . . . . . . . . . . . . . . . . . . . . . . . . . . . . . . . . . . . . . . . . . . . . . . . . . . . . . . . . . . . . . . . . . . . . . . . . . . . . . 0 .03 g<br />
FeP04.4HZ0 . . . . . . . . . . . . . . . . . . . . . . . . . . . . . . . . . . . . . . . . . . . . . . . . . . . . . . . . . . . . . . . . . . . . . . . . . . . . . . . . . . . . . . . . . . . . . . . . . . . . . . . . . . . . . . 0 .02 g<br />
Distilled water . . . . . . . . . . . . . . . . . . . . . . . . . . . . . . . . . . . . . . . . . . . . . . . . . . . . . . . . . . . . . . . . . . . . . . . . . . . . . . . . . . . . . . . . . . . . . . . . . . . . . . . . . . . . 8000 ml<br />
TABLE 4 . Composition <strong>of</strong> crude oil/water emulsion used in test media<br />
Component<br />
Amount<br />
Empire Mix crude oil . . . . . . . . . . . . . . . . . . . . . . . . . . . . . . . . . . . . . . . . . . . . . . . . . . . . . . . . . . . . . . . . . . . . . . . . . . . . . . . . . . . . . . . . . . . . . . . . . . . 5 .0 ml<br />
Distilled water . . . . . . . . . . . . . . . . . . . . . . . . . . . . . . . . . . . . . . . . . . . . . . . . . . . . . . . . . . . . . . . . . . . . . . . . . . . . . . . . . . . . . . . . . . . . . . . . . . . . . . . . . . . . 45 .0 ml<br />
Gum arabic . . . . . . . . . . . . . . . . . . . . . . . . . . . . . . . . . . . . . . . . . . . . . . . . . . . . . . . . . . . . . . . . . . . . . . . . . . . . . . . . . . . . . . . . . . . . . . . . . . . . . . . . . . . . . . . 0 .1 g<br />
TABLE S . Rosenfeld's sulfate-reducing medium for hydrocarbon-utilizing microorganisms"<br />
Component<br />
Amount<br />
FeS04.(NH4)ZS046H20 . . . . . . . . . . . . . . . . . . . . . . . . . . . . . . . . . . . . . . . . . . . . . . . . . . . . . . . . . . . . . . . . . . . . . . . . . . . . . . . . . . . . . . . . . . . . . . . . 0 .1 g<br />
Ascorbic acid . . . . . . . . . . . . . . . . . . . . . . . . . . . . . . . . . . . . . . . . . . . . . . . . . . . . . . . . . . . . . . . . . . . . . . . . . . . . . . . . . . . . . . . . . . . . . . . . . . . . . . . . . . . . . 0 .2 g<br />
KZHPO4 . . . . . . . . . . . . . . . . . . . . . . . . . . . . . . . . . . . . . . . . . . . . . . . . . . . . . . . . . . . . . . . . . . . . . . . . . . . . . . . . . . . . . . . . . . . . . . . . . . . . . . . . . . . . . . . . . . . 0 .5 g<br />
(NH4)ZSO4 . . . . . . . . . . . . . . . . . . . . . . . . . . . . . . . . . . . . . . . . . . . . . . . . . . . . . . . . . . . . . . . . . . . . . . . . . . . . . . . . . . . . . . . . . . . . . . . . . . . . . . . . . . . . . . . . 1 .0 g<br />
Crude oil emulsionb . . . . . . . . . . . . . . . . . . . . . . . . . . . . . . . . . . . . . . . . . . . . . . . . . . . . . . . . . . . . . . . . . . . . . . . . . . . . . . . . . . . . . . . . . . . . . . . . . . . . . 50 ml<br />
Synthetic seawater (400 percent)c . . . . . . . . . . . . . . . . . . . . . . . . . . . . . . . . . . . . . . . . . . . . . . . . . . . . . . . . . . . . . . . . . . . . . . . . . . . . . . . . . . . . 25 ml<br />
Distilled water . . . . . . . . . . . . . . . . . . . . . . . . . . . . . . . . . . . . . . . . . . . . . . . . . . . . . . . . . . . . . . . . . . . . . . . . . . . . . . . . . . . . . . . . . . . . . . . . . . . . . . . . . . . . 975 ml<br />
BTubed and sterilized in an autoclave at 121 C for IS min<br />
bSee Table 3<br />
cSce Table 2<br />
129
6. Nitrogen, Ammonium, Nitrate, Nitrite, Phosphate<br />
and Phosphorus<br />
Total nitrogen, ammonium, nitrate, nitrite,<br />
ortho-phosphate and total phosphorus analyses were<br />
done as described in the following sections <strong>of</strong> Standard<br />
Methods : 421 (total Kjeldahl nitrogen), 418B ammonia,<br />
nesslerization), 419D (nitrate, brucine), 420 (nitritenitrogen),<br />
425E (phosphate), and 425C .I . and E (total<br />
phosphorus) .<br />
7. Oil-Degradation<br />
a . Oxygen Consumption<br />
Eight test systems were employed to assess<br />
the oil-degrading potential <strong>of</strong> sediment microorganisms<br />
(Table 6) . Empire Mix crude oil was thoroughly mixed<br />
with the sediment sample, and 7-ml subsamples were<br />
placed in 300-m1 Biochemical Oxygen Demand (BOD)<br />
bottles . Twelve bottles were prepared for each test system<br />
. Appropriate amounts <strong>of</strong> inorganic nutrients were<br />
placed in the BOD bottles (Table 6) . Bottles were filled<br />
with air-saturated synthetic sea salts (30 ppt salinity),<br />
stoppered, tested immediately for dissolved oxygen<br />
using a YSI model No . S 1 B oxygen meter, and plated on<br />
oil agar.<br />
composites from Cruises I and II by incubating 5 ml <strong>of</strong><br />
the composite sample in 100 ml <strong>of</strong> synthetic sea salts solution<br />
supplemented with 1 % (w/v) Empire Mix crude<br />
oil (10,000 ppm), 0 .1 % (w/v) KN03, and 0.038% (w/v)<br />
KZHPO4 at 20 C for SO days . The synthetic sea salts consisted<br />
<strong>of</strong> the following inorganic salts : sodium chloride,<br />
19 .45 g ; magnesium chloride, 8 .8 g ; sodium sulfate,<br />
3 .24 g ; calcium chloride, 1 .8 g ; potassium chloride, 0 .55 g ;<br />
sodium bicarbonate, 0.16 g ; potassium bromide, 0 .08 g;<br />
strontium chloride, 0 .034 g ; boric acid, 0.022 g ; sodium<br />
silicate, 0.004 g ; sodium fluoride, 0.0024 g ; ammonium<br />
nitrate, 0 .0016 g ; disodium hydrogen phosphate, 0 .008 g ;<br />
and distilled water, 1 liter .<br />
Warburg respirometers with 125-m1 BOD<br />
flasks were employed to assess the potential <strong>of</strong> sediment<br />
enrichment cultures and pure cultures to oxidize oil .<br />
Flasks containing 25 ml synthetic sea salts supplemented<br />
with 0 .1 % (w/v) potassium nitrate and 0.038% (w/v)<br />
dipotassium hydrogen phosphate, a 10% inoculum <strong>of</strong> a<br />
sediment sample, an enrichment culture or a pure culture,<br />
and 20 yl <strong>of</strong> Empire Mix crude oil were shaken at<br />
20 C . Oxygen consumption and carbon dioxide production<br />
were monitored manometrically, and respiratory<br />
quotients were calculated . At the termination <strong>of</strong> the experiment<br />
the contents <strong>of</strong> the flasks were analyzed by<br />
TABLE 6 . Test systems for determining oil-degrading potential <strong>of</strong> sediment microorganisms<br />
Test Empire Mix Incubation<br />
System NH4CI KN03 KZHPO4 Crude Oil Temperature<br />
No . (ppm) (ppm) (ppm) (ppm) (C)<br />
1 X X X 0 .58 IS<br />
2 X X X 0 .58 20<br />
3 X X X 0 .58 27<br />
0 .7a X 0 .78 0 .58 27<br />
5 6 .6 X 4 .0 0 .58 27<br />
6 X 6 .6 4 .0 0 .58 27<br />
7 6 .6 X 4 .0 5 .80 27<br />
8 X - 6 .6 4 .0 5 .80 27<br />
X - Concentration found in sediment sample being employed in the experiment .<br />
a - Maximum amount found in any sample .<br />
After incubation, the streak plates were examined<br />
for the number <strong>of</strong> colonial types . Representative,<br />
predominant colonial types were purified for<br />
axenic cultures studies . The contents <strong>of</strong> three bottles<br />
from each test system were analyzed for hydrocarbons<br />
by both gas chromatography (GC) and high pressure<br />
liquid chromatography (HPLC) as described below .<br />
Dissolved oxygen (DO) was routinely monitored on all<br />
<strong>of</strong> the bottles from each test system . After 20 days<br />
incubation, three bottles from each test system were<br />
removed, aliquots were plated on oil agar, and the remaining<br />
contents <strong>of</strong> the bottles were analyzed for hydrocarbons<br />
. Similarly, three bottles from each test system<br />
were removed after 40 and 60 days <strong>of</strong> incubation<br />
and analyzed as described above . Thus, DO readings for<br />
the 20, 40, and 60 day readings were made on 9, 6, and 3<br />
bottles, respectively . To insure an adequate supply <strong>of</strong><br />
DO in the bottles, each bottle was re-aerated after each<br />
DO reading .<br />
b . Respirometry<br />
Four pure cultures were selected from the oxygen<br />
consumption studies . Four enrichment cultures<br />
were prepared from the two platform and two control<br />
GC and HPLC for alkanes and aromatics, respectively .<br />
Ten samples were sent to Southwest Research Institute<br />
for gas chromatography-mass spectrometry (GC-MS)<br />
analysis .<br />
c. Hydrocarbon Analyses<br />
The 300-m1 mixture <strong>of</strong> water and sediment<br />
from each BOD bottle was placed in a S00-ml separatory<br />
funnel and extracted three times with 50 ml <strong>of</strong><br />
n-hexane . The n-hexane was evaporated in vacuo to<br />
near dryness, and the sample was then transferred to a<br />
storage vial with S ml <strong>of</strong> ethyl ether . The sample was<br />
dried under a stream <strong>of</strong> nitrogen to remove the ether,<br />
and frozen at -20 C until analyzed .<br />
The samples were analyzed on a 0 .32 cm x<br />
183 cm OD stainless steel column containing 3% 5E-30<br />
on 80-100 mesh Chromasorb W using a Beckman GC-45<br />
equipped with a flame ionization detector . Injector and<br />
detector temperatures were 300 C and the column temperature<br />
was programmed from 100 to 300 C at a rate <strong>of</strong><br />
3 C per min . Qualitative identification <strong>of</strong> the components<br />
was achieved by comparing the retention times <strong>of</strong><br />
oil components with known standards . Quantitation <strong>of</strong><br />
peaks was accomplished with a 3380A Hewlett-Packard<br />
130
ecording integrator . Total oil was quantified from the<br />
area <strong>of</strong> the n-C,6 peak on the gas chromatograms by<br />
comparison to a standard curve prepared with fresh<br />
Empire Mix crude oil .<br />
Each sample was also analyzed using a Waters<br />
Associates Model 200/401 HPLC with UV detector<br />
(wavelength, 277 nm) . A 0 .63 X 25 .4 1A Bondapak Cue/<br />
corasil column was employed with a methanol :water<br />
(70:30) solvent system at a flow rate <strong>of</strong> 2 .0 ml/min .<br />
Analyses for total hydrocarbons were conducted<br />
using a Waters Associates ALC/GPC-502<br />
HPLC fitted with an FS-770 Schoeffel fluorometer,<br />
with an excitation wavelength <strong>of</strong> 274 nm and an emission<br />
wavelength <strong>of</strong> 370 nm . The analyses were carried<br />
out using a methanol :water solvent system on samples<br />
dissolved in a known quantity <strong>of</strong> o-hexane (Brown and<br />
Minchew, 1978) .<br />
Petrogenic hydrocarbons were analyzed<br />
using the HPLC described above but with an excitation<br />
wavelength <strong>of</strong> 403 nm and an emission wavelength <strong>of</strong><br />
418 nm (Miles, Coign, and Brown, 1977) . For these<br />
analyses the samples were dissolved in chlor<strong>of</strong>orm, and<br />
a chlor<strong>of</strong>orm solvent system was employed .<br />
8. Nitrification<br />
For every set <strong>of</strong> four bottles that was used to<br />
monitor the activity <strong>of</strong> sediment microbial processes<br />
(except photosynthesis) and assess the impact <strong>of</strong> oil on<br />
these processes, the following scheme was used .<br />
Eight ml Sediment from each Composite<br />
40 ml normal strength synthetic seawater<br />
10 ml 10 ml 10 ml 10 ml<br />
TEST 1 ppt HgC12 20 ppm Oil 200 ppm Oil<br />
CONTROL IX Oil lox Oil<br />
In all cases, the TEST, 1X OIL, and lOX OIL bottles received<br />
HgC12 (1 ppt) prior to terminal analysis in order<br />
to insure sample uniformity .<br />
For nitrification 16 ten-ml samples were placed<br />
in 8-oz prescription bottles containing 65-m1 synthetic<br />
seawater supplemented with NH4Cl (approximate final<br />
concentration <strong>of</strong> 1 g/liter) . Immediately after preparation,<br />
the contents <strong>of</strong> one set <strong>of</strong> bottles (TEST, CON-<br />
TROL, 1X OIL, and lOX OIL) were subjected to analysis<br />
for substrate (ammonia) and products (nitrite and<br />
nitrate) using colorimetric procedures in Standard<br />
Methods. Suspensions were incubated quiescently at 20 C .<br />
After one, two, and three weeks <strong>of</strong> incubation, subsequent<br />
sets <strong>of</strong> bottles were analyzed for ammonia, nitrite,<br />
and nitrate .<br />
9. Nitrogen Fixation<br />
Four ten-ml samples were placed in 6-oz prescription<br />
bottles and closed with rubber serum stoppers .<br />
The atmosphere <strong>of</strong> each bottle was replaced with a gas<br />
mixture composed <strong>of</strong> 65% argon, 30% N2, and 5%<br />
CO2 . Samples were injected into a Fisher Gas Partitioner<br />
Model 1200 GC to detect decreases in NZ . Samples<br />
were incubated quiescently at 20 C . All systems<br />
were monitored at time zero, one week, two weeks, and<br />
three weeks . Total Kjeldahl nitrogen content <strong>of</strong> the<br />
3-week samples was determined as described in Standard<br />
Methods.<br />
10. Denitrification<br />
Four ten-ml samples were placed in 6-oz prescription<br />
bottles . Forty ml <strong>of</strong> synthetic seawater supplemented<br />
with KN03 (5 g/liter) was added to each bottle .<br />
A serum stopper was placed in each bottle and the atmosphere<br />
was replaced with argon . Incubation was at 20 C<br />
for three weeks without agitation . Gas composition was<br />
monitored weekly using a Fisher Gas Partitioner Model<br />
1200 GC to determine the amount <strong>of</strong> NZ produced .<br />
Analyses for nitrite using colorimetric procedures in<br />
Standard Methods were done at the beginning and at the<br />
termination <strong>of</strong> the experiment .<br />
11 . Sulfate Reduction<br />
Sixteen ten-ml samples were placed in 2-oz prescription<br />
bottles and supplemented with 50 mg NaZ"SO,<br />
(0 .02 ;ACi/mg) . Immediately after preparation, the<br />
contents <strong>of</strong> one set <strong>of</strong> bottles (TEST, CONTROL, 1X<br />
OIL, and lOX OII,) were filtered through 0 .45 ;Am pore<br />
size membrane filters, and washed twice . Increases in<br />
water-insoluble 'S (material on the filter) were<br />
monitored using a Tennelec Model TC-545A countertimer<br />
. Decreases in water-soluble 'SS were determined<br />
on the filtrate using a Packard Model 2650 Liquid<br />
Scintillation Spectrometer . The remaining suspensions<br />
were incubated quiescently at 20 C . After one, two, and<br />
three weeks <strong>of</strong> incubation, subsequent sets <strong>of</strong> bottles<br />
were analyzed as described above .<br />
12. Sulfur Oxidation<br />
Sixteen ten-ml samples were placed in 2-oz prescription<br />
bottles and supplemented with 50 mg elemental<br />
S containing 35S (0 .02 yCi/mg) . Immediately<br />
after preparation, the contents <strong>of</strong> one set <strong>of</strong> bottles<br />
(TEST, CONTROL, 1X OIL, and lOX OIL) were filtered<br />
through 0 .45-gym pore size membrane filters, and<br />
rinsed twice . Decreases in water-insoluble 33S (material<br />
on the filter) and increases in water-soluble 33S were<br />
monitored as described in the sulfate reduction section .<br />
The remaining bottles were incubated quiescently at 20 C .<br />
After one, two, and three weeks <strong>of</strong> incubation, subsequent<br />
sets <strong>of</strong> bottles were analyzed as described above .<br />
13. Photosynthesis<br />
The test for photosynthesis was always done<br />
aboard ship on fresh samples . Five-ml subsamples from<br />
each sample were transferred to each <strong>of</strong> eight BOD bottles,<br />
four <strong>of</strong> which were painted black for determining<br />
the dark reaction . One pair <strong>of</strong> bottles (1 light reaction,<br />
1 dark reaction) was treated with HgCIZ and designated<br />
as CONTROL BOTTLES . Concurrently, tests were<br />
conducted in the presence <strong>of</strong> Empire Mix crude oil at the<br />
1X and l OX concentrations . The bottles were then filled<br />
with a solution <strong>of</strong> 30 ppt Rila Sea Salts (pre-cooled to<br />
20 C) and incubated at 20 C for 8-24 hours beneath<br />
three 20-watt fluorescent light bulbs . Dissolved oxygen<br />
was determined both initially and after incubation,<br />
using a model YSI-54B oxygen meter .<br />
14 . Heterotrophic Activity<br />
Sixteen ten-ml subsamples were placed in 2-oz<br />
prescription bottles and supplemented with 50 mg UL<br />
"C-glucose (0 .01 uCi/mg) . A serum stopper was placed<br />
in each bottle . Immediately after preparation the contents<br />
<strong>of</strong> one set <strong>of</strong> bottles (TEST, CONTROL, 1X OIL,<br />
and lOX OIL) were analyzed for 1°COZ by acidifying the<br />
131
medium, flushing the bottle with air, and trapping the<br />
1°COZ in Carbosorb0 (obtained from Packard Instrument<br />
Company) . The contents <strong>of</strong> each bottle were then<br />
filtered through a 0 .45 Nm pore size membrane filter and<br />
rinsed twice, and the insoluble portion remaining on the<br />
filter was oxidized in a Packard Model B306 sample oxidizer<br />
. Radioactivity <strong>of</strong> the three fractions was determined<br />
using a Packard Model 2650 Liquid Scintillation<br />
Spectrometer . The remaining bottles were incubated<br />
quiescently at 20 C . For Cruise I, subsequent sets <strong>of</strong> bottles<br />
were analyzed as described above after two, four,<br />
and six days <strong>of</strong> incubation . Since these data indicated<br />
the cultures had entered stationary phase, the protocol<br />
was changed for Cruises II and III to analyze after one,<br />
three, and five days <strong>of</strong> incubation .<br />
15. Phosphorus Uptake<br />
Sixteen ten-ml samples were placed in 2-oz prescription<br />
bottles and supplemented with 50 mg<br />
KZH3ZP0a (0 .02 MCi/mg) . Immediately after preparation<br />
the contents <strong>of</strong> one set <strong>of</strong> bottles (TEST, CON-<br />
TROL, 1 X OIL, and I OX OIL) were analyzed for 32P04 3<br />
by filtering the contents <strong>of</strong> each bottle through a 0 .45 Mm<br />
pore size membrane filter with two rinses . Water-soluble<br />
32P was determined using a Beckman Model LS 100<br />
liquid scintillation counter . Water-insoluble 3zP on the<br />
filter was also determined using a Tennelec model TC-<br />
545A counter-timer . The remaining bottles were incubated<br />
quiescently at 20 C . After five, ten, and fifteen<br />
days <strong>of</strong> incubation, subsequent sets <strong>of</strong> bottles were analyzed<br />
as described above .<br />
16. Lipolysis<br />
Sixteen ten-ml samples were placed in 2-oz prescription<br />
bottles and supplemented with SO mg uniformly<br />
labeled '°C-tripalmitin (0 .01 MCi/mg) . Samples<br />
were analyzed as described in the heterotrophic activity<br />
section at zero time and after one, two, and three weeks<br />
<strong>of</strong> incubation .<br />
17. Chitinolysis<br />
Sixteen ten-ml samples were placed in 2-oz prescription<br />
bottles and supplemented with 0 .1 g chitin . A<br />
serum stopper was placed in each bottle, and the atmosphere<br />
was replaced with a mixture <strong>of</strong> 5% argon, 20%<br />
oxygen, and 75% nitrogen . Immediately after preparation<br />
the contents <strong>of</strong> one set <strong>of</strong> bottles (TEST, CON-<br />
TROL, 1X OIL, and lOX OIL) were analyzed for COz<br />
using a Fisher Gas Partitioner Model 1200 GC . The remaining<br />
bottles were incubated quiescently at 20 C .<br />
After one, two, and three weeks <strong>of</strong> incubation, subsequent<br />
sets <strong>of</strong> bottles were analyzed as described above .<br />
18. Cellulolysis<br />
Sixteen ten-ml samples were placed in 2-oz prescription<br />
bottles and supplemented with 50 mg uniformly<br />
labeled '°C-cellulose (0.01 NCi/mg) . Samples<br />
were analyzed weekly as described in the heterotrophic<br />
activity section .<br />
19. Proteolysis<br />
Sixteen ten-ml samples were placed in 2-oz<br />
prescription bottles and supplemented with SO mg UL<br />
1°C-acetylated bovine serum albumin (0 .6 kCi/g) . Samples<br />
were analyzed weekly as described in the heterotrophic<br />
activity section .<br />
E. Pure Culture Studies<br />
The experimental design for assessing the impact <strong>of</strong><br />
oil on pure cultures was essentially identical to that employed<br />
for the sediment processes, except that a pure<br />
culture was added (to the test bottles) instead <strong>of</strong> sediment<br />
. All cultures except those obtained commercially<br />
were isolated from sediments collected during Cruise II<br />
at Platforms P1 or P2, and identified by cellular morphology,<br />
colonial morphology, gram reaction, and substrate<br />
utilization, according to Skerman (1967) .<br />
Two cultures were employed to determine the effect<br />
<strong>of</strong> Empire Mix crude oil on the process <strong>of</strong> nitrification .<br />
Nitrosomonas europea [American Type Culture Collection<br />
(ATCC) #19718, non-marine] and a nitrifying enrichment<br />
culture (non-marine, prepared from a nitrifying<br />
soil sample) were tested for the ability to grow in<br />
synthetic seawater . Satisfactory growth was not observed,<br />
so the tests were conducted using distilled water<br />
instead <strong>of</strong> seawater .<br />
The activity <strong>of</strong> ammonia-oxidizing bacteria was determined<br />
by monitoring the disappearance <strong>of</strong> ammonia<br />
and appearance <strong>of</strong> nitrite or nitrate . The composition <strong>of</strong><br />
the atmosphere <strong>of</strong> each culture was monitored weekly<br />
for a period <strong>of</strong> 30 days to correlate OZ and COZ consumption<br />
with the rate <strong>of</strong> nitrification .<br />
Studies to assess the impact <strong>of</strong> oil on photosynthesis<br />
were done with Nostoc muscorum (ATCC X127347) . The<br />
alga was grown in 1-liter culture flasks containing CHU<br />
q10 medium (ATCC Catalogue M241) amended to 10 ppt<br />
salinity with Rila Sea Salts . This inoculum was incubated<br />
in a lighted BOD incubator (Precision 31214) at<br />
20 C for 1 week . The cells were then added to 201 <strong>of</strong> aerated<br />
medium and dispensed into 300-m1 BOD bottles .<br />
The final cell concentration was 42 .6 Mg dry weight <strong>of</strong><br />
cells/ml . The experimental design was the same as in the<br />
sediment studies except that there were five replications<br />
<strong>of</strong> each test . Metabolic activity and photosynthesis were<br />
determined after 12 hours <strong>of</strong> incubation by measuring<br />
DO using a YSI Model 51 B oxygen meter .<br />
Activity <strong>of</strong> proteolytic bacteria was monitored by<br />
measuring the amount <strong>of</strong> COZ produced using a Fisher<br />
Model 1200 GC as described in the section on chitinolysis<br />
. The two pure cultures (Pseudomonas sp . 3 and<br />
sp . 4) employed were isolated on Difco-Nutrient Gelatin<br />
Agar prepared with Rila Sea Salts .<br />
One culture capable <strong>of</strong> utilizing glucose (Enterobacter<br />
sp . 1) was isolated from sediments on Rila Sea<br />
Salts amended with 1 % glucose . Two methods (gas<br />
chromatographic and radioisotopic) <strong>of</strong> monitoring COZ<br />
production were employed to determine the impact <strong>of</strong><br />
crude oil on glucose utilization .<br />
Two pure cultures <strong>of</strong> cellulose-utilizing bacteria<br />
(Cellulomonas sp . 1 and sp . 2) were isolated from sediments<br />
by streaking enrichments onto Dubos Cellulose<br />
Agar (Dubos, 1928) amended with Rila Sea Salts . The<br />
impact <strong>of</strong> oil on cellulose utilization was determined by<br />
monitoring COZ production using UL 14C-cellulose .<br />
The impact <strong>of</strong> oil on two pure cultures (Pseudomonas<br />
sp . 5 and sp . 7) capable <strong>of</strong> lipolytic activity was<br />
determined by monitoring the rate <strong>of</strong> COZ production<br />
from 1°C-tripalmitin . These cultures were isolated on<br />
Difco Spirit Blue Agar prepared with Rila Sea Salts<br />
mixture<br />
Two pure cultures <strong>of</strong> chitin-utilizing bacteria<br />
(Pseudomonas sp . 6 and sp . 8) were isolated by incubating<br />
the sediment in 30 ppt Rila Sea Salts amended<br />
132
with 1 % finely ground chitin for 3 weeks . Pure cultures<br />
were selected after streaking the enrichments onto Rila<br />
Sea Salts agar containing 1 % chitin .<br />
F. Statistical Analyses<br />
All statistical procedures were carried out on a Univac<br />
1180 computer using the SPSS integrated system <strong>of</strong><br />
computer programs . Analyses <strong>of</strong> data for sediment<br />
chemistry and microbial enumerations included oneway<br />
analysis <strong>of</strong> variance, Duncan's multiple range test,<br />
and Student's t-test . Analysis <strong>of</strong> microbial processes<br />
and oil degradation were carried out using multiple regression,<br />
while comparisons between fresh and frozen<br />
samples were made using a correlated t-test .<br />
133
III . RESULTS<br />
A. Sample Analysis<br />
All <strong>of</strong> the samples for microbiological analysis were<br />
collected aseptically from each grab sample . All <strong>of</strong> the<br />
samples were accounted for using the color-coding system<br />
described in I1 . METHODS AND MATERIALS . A<br />
total <strong>of</strong> 304 sediment samples were analyzed during<br />
Cruises I, II, and III (Table 7) .<br />
i . Aerobic Heterotrophic Bacteria<br />
A total <strong>of</strong> 304 sediment samples from Cruises I,<br />
II, and III were plated in triplicate, resulting in 912<br />
plates <strong>of</strong> marine agar that were enumerated for aerobic<br />
heterotrophic bacteria . Insignificant differences<br />
between counts <strong>of</strong> aerobic heterotrophs at control sites<br />
were observed for each cruise (Table 8) . However, the<br />
counts for aerobic heterotrophs obtained during Cruise<br />
II were significantly lower than those obtained for<br />
Cruises I or III (Table 8, Fig . 2) . Similar results were obtained<br />
for counts <strong>of</strong> aerobic heterotrophs at the primary<br />
platforms, except that the counts for Cruise I were<br />
higher at the primary platforms than at the control sites<br />
(Table 9) . Counts <strong>of</strong> aerobic heterotrophs at the secondary<br />
platforms were similar to those obtained at the primary<br />
platforms and control sites during Cruise II (Table<br />
10, Fig . 3), but appeared to decrease along an east-west<br />
transect (Fig . 4) .<br />
The effect <strong>of</strong> the freezing <strong>of</strong> sediments and its<br />
relationship to total bacterial counts can be seen in<br />
Table 11 . There was no statistically significant effect (at<br />
the 0 .01 probability level) <strong>of</strong> freezing in sediments that<br />
were frozen for 7 days (60 .5 :j- 14 .8 X 10' vs (54.It14 .0 x<br />
10° cfu/ml) . However, after 45 days <strong>of</strong> freezing, the<br />
total bacterial population was reduced 50% (to<br />
30.216 .7 x 10°) from that <strong>of</strong> fresh sediments . This reduction<br />
was increased to 81% (to 9.811 .5 X 10°) after<br />
90 days <strong>of</strong> freezing (Fig . 5) . These results indicate,<br />
therefore, that sediments can be frozen without affecting<br />
the total plate count if analysis is initiated within one<br />
week <strong>of</strong> freezing .<br />
2 . Aerobic Bacteria on Oil Agar<br />
A total <strong>of</strong> 304 sediment samples from Cruises I,<br />
II, and III were plated in triplicate resulting in 912 plates<br />
<strong>of</strong> oil agar that were enumerated for aerobic oil-degrading<br />
bacteria . Insignificant differences were observed between<br />
counts <strong>of</strong> bacteria from different control sites and<br />
different cruises except for counts from Control Site<br />
C22 during Cruise III, which were significantly higher<br />
than all other counts, (Table 12, Fig . 6) . Differences<br />
were observed between counts <strong>of</strong> bacteria on oil agar<br />
from primary platforms for Cruises 1, II, and III (Table<br />
13) . Most counts were higher for Cruises I and III than<br />
TABLE 7 . Number <strong>of</strong> sediment samples analyzed<br />
Analysis<br />
(P = Primary, C = Control, Cruise I Cruise II Cruise III<br />
S =Secondary) P C P C S P C Total<br />
Microbial enumeration<br />
and sediment chemistry 64 16 64 16 64 64 16 304<br />
Photosynthesis 8 8 8 8 0 8 8 48<br />
Sediment processesa 8 8 8 8 0 8b 8b 48<br />
Oil degradationa 1 1 1 1 0 1 1 6<br />
Total 81 33 81 33 64 81 33 406<br />
BComposite samples<br />
bOnly 4 sample composites for nitrification, nitrogen fixation, denitrification, sulfur oxidation, sulfate reduction, and phosphate uptake<br />
TABLE 8 . Total colony-forming units (CFU) <strong>of</strong> aerobic heterotrophic bacteria<br />
cultured on marine agar per ml <strong>of</strong> sediment collected at the control sites,<br />
expressed as z CFU x 10-3 t Sz<br />
Control Site Cruise I Cruise II Cruise III<br />
C21 770 t 440 4100 t 8000 380 t 150<br />
(990 ± 100)8 (85 ± 34)a<br />
C22 880 t 64 51 t 3 680 ± 430<br />
(970 t 140)'<br />
C23 810 f 75 40 ± 13 540 t 90<br />
C24 2000 ± 1900 44 t 30 600 t 110<br />
(57 ± 17)a<br />
x 1100 ± 590 1000 ± 4000 550 ± 240<br />
50 ± 30)a<br />
°x t Sx calculated after eliminating outliers<br />
135
n,.,<br />
T<br />
f+<br />
C<br />
41<br />
N<br />
G<br />
d<br />
d<br />
r<br />
x<br />
.`<br />
d<br />
V<br />
U<br />
U<br />
t<br />
d<br />
O<br />
r<br />
O<br />
N<br />
r+<br />
N<br />
t<br />
U<br />
O<br />
N<br />
Q<br />
21 22 23 24 21 22 23 24 21 22 23 24<br />
II<br />
Control Site and Cruise<br />
IIL<br />
FIG 2 . Counts <strong>of</strong> aerobic heterotrophs obtained at control sites during Cruises I, Ii, and III .<br />
136
TABLE 9. Total aerobic heterotrophic bacterial CFU (x 10-3)<br />
per ml <strong>of</strong> sediment collected at the primary platforms<br />
Primary<br />
Site<br />
Compass<br />
Point Cruise I Cruise II Cruise III<br />
P 1 N 2700 ± 1500 66 f 14 260 t S0<br />
E 3775 t 380 74 t 19 520 t 340<br />
S 4000± 1200 350 t 560 850 t 130<br />
(72 f 19)'<br />
W 4100 1 346 77 1 8 8001 260<br />
z 3600 t 1100 140 t 280 600 t 320<br />
P2 N 2100 t 2400 93 t 15 890 t 30<br />
(4100 t 710)8<br />
E 3300 ± 2000 84 t 23 680 t 440<br />
(4300 t 120)8<br />
S 1800 t 2100 66 t 12 1200 t 470<br />
(3600 t 140)8<br />
W 4000 ± 1400 85 t 31 1600 t 640<br />
z 2800 f 2000 82 t 22 1100 f S60<br />
P3 N 6100 ± 3300 140 t 120 820 t 480<br />
(1100 t 75)"<br />
E 3800 ±500 43 t 84 1800 ±170<br />
S 4800 t 860 52 t 33 1200 ±560<br />
W 4600± 1200 61 t 14 S50 t 45<br />
z 4800 :t:1800 74 t 70 1100 f 610<br />
P4 N 3600 ± 280 42 f 9 530 1 130<br />
E 4000± 580 42 t 13 360 ±230<br />
(480 t 26)8<br />
S 3800 ±260 30 14 480 1 93<br />
W 3200±410 3616 7301200<br />
z 3700 ±480 37 1 9 530 1 210<br />
z 3700 ±1600 84 t 150 840 :t520<br />
66141 a<br />
ax t Sx calculated after eliminating outliers<br />
TABLE 10 .<br />
Total aerobic heterotrophic bacterial CFU (X 10-3) per ml <strong>of</strong> sediment<br />
collected at the secondary platforms during Cruise II<br />
Secondary<br />
Site<br />
CFU ± SR<br />
Secondary<br />
Site<br />
CFU, t SR<br />
SS 320 t 150 S13 86 t 13<br />
S6 200 t 95 S14 18 t 11<br />
S7 1001 17 S15 1214<br />
S8 71 f 33 S16 42 t 8<br />
S9 74 ± 8 S17 25 1 6<br />
S10 34 f 26 S18 70 t 100<br />
(20 t 14)"<br />
S11 73127 S19 St2<br />
S12 52 ± 4 S20 76 t 64<br />
xtSx= 78190<br />
ax t Si calculated after eliminating outliers<br />
137
300<br />
41<br />
200<br />
m<br />
E<br />
as<br />
H<br />
I-25X<br />
m<br />
a<br />
X<br />
U<br />
F+<br />
V<br />
t0<br />
U<br />
L<br />
100<br />
90<br />
80<br />
70<br />
60<br />
50,<br />
a<br />
o qp~<br />
..<br />
0<br />
r<br />
m<br />
L 30-<br />
U<br />
O<br />
m<br />
Q<br />
5 21 1 6 13 7 9 8 2 12 22 3 11 10 4 20 23 19 16 24 14 15 17 18<br />
Site<br />
FIG. 3. Counts <strong>of</strong> aerobic heterotrophs obtained during Cruise II .<br />
138
I O<br />
O<br />
0<br />
D<br />
" ; c~s<br />
eo<br />
v°<br />
21 . 5 1f<br />
I 1<br />
e ~~4p~ 2<br />
D o p ~/~'y 120 8<br />
13<br />
0 19 20 0 100<br />
o I 8 o24 I I<br />
22 0<br />
7 m<br />
w<br />
0 14<br />
9<br />
3<br />
4 0<br />
16 0<br />
230<br />
LEGEND<br />
0 0 - 50%ile<br />
" 51 -100 %ile<br />
0 17<br />
0 15<br />
Scale<br />
0 10 20<br />
Now= -<br />
30<br />
=1<br />
FIG . 4. Total aerobic plate - based on correlated t-test .
T<br />
0<br />
,o<br />
20<br />
30<br />
O<br />
r<br />
X<br />
.`<br />
V<br />
m<br />
40<br />
W<br />
m<br />
50 C<br />
C<br />
m<br />
v<br />
60 m a<br />
70<br />
80<br />
90<br />
sv qr 5u 60 70 80 90<br />
Days Frozen Storage<br />
100<br />
100<br />
FIG . 5 . Effect <strong>of</strong> freezing on total aerobic heterotrophic bacteria in marine sediments .
TABLE 11 . Counts <strong>of</strong> aerobic heterotrophic bacteria in fresh and frozen sediments<br />
expressed as CFU (x 10-4) per ml <strong>of</strong> sediment<br />
Frozen Sediments<br />
Samp le Fresh Sediments 7 days 45 day s 90 da ys<br />
Pla 70 69 33 -<br />
Plb 56 61 33 -<br />
P2a 81 70 29 12 .0<br />
P2b 79 53 33 11 .0<br />
P3a 31 43 25 12 .0<br />
P3b 40 62 25 12 .0<br />
P4a S 8 39 24 9 .6<br />
PO 76 53 13 7.0<br />
PSa 59 64 36 11 .0<br />
PSb 64 65 31 11 .0<br />
P6a 79 61 26 11 .0<br />
P6b 63 64 22 9.1<br />
Ma 58 66 21 7 .7<br />
P7b 65 59 27 8.1<br />
P8a 55 36 35 9 .1<br />
P8b 55 46 24 8.8<br />
P9a 49 38 22 9 .7<br />
P9b 50 85 31 8 .7<br />
PIOa 37 47 21 9 .1<br />
P10b 40 61 24 9.0<br />
Cla 73 58 39 9 .7<br />
C 1 b 59 42 39 8.2<br />
C2a 52 49 37 11 .0<br />
C2b 86 40 31 10 .0<br />
C3a 73 46 39 10 .0<br />
Cab 65 47 27 11 .0<br />
CSa 51 51 34 11 .0<br />
CSb 55 52 41 10 .0<br />
C6a 73 63 35 8.1<br />
C6b 64 54 29 7.5<br />
C7a 54 63 44 13 .0<br />
C7b 42 63 35 12 .0<br />
C8a 62 57 28 9 .0<br />
C8b 65 59 22 8.4<br />
C9a 60 52 32 8 .7<br />
C9b 57 43 36 9.1<br />
C10a 71 54 29 9 .2<br />
C10b 70 61 35 9 .6<br />
z 60 .45 t 14.78 54.08±14 .02 30.18±6.72 9 .76 f 1 .46<br />
TABLE 12 . Average number <strong>of</strong> aerobic bacterial CFU (x 10-3) cultured on oil agar<br />
per ml <strong>of</strong> sediment collected at the control sites<br />
Control Site Cruise I Cruise II Cruise III<br />
C21 34 t 20 15 t 13 220 t 240<br />
C22 8 1 12 3 1 4 500 1 220<br />
(2 f 1)a<br />
C23 110 .5 311 1117<br />
C24 1 10.8 St7 1914<br />
z 11117 619 1901260<br />
Ii :t Si calculated after eliminating outliers<br />
141
C<br />
m<br />
E<br />
E<br />
X<br />
OD<br />
N<br />
O<br />
C<br />
O<br />
t0 .y<br />
d<br />
U<br />
v<br />
O<br />
u<br />
a<br />
w<br />
U<br />
21 22 23 24 21 22 23 24 21 22 23 24<br />
a<br />
Control Site and Cruise<br />
nr<br />
FIG. 6. Counts <strong>of</strong> bacteria on oil agar obtained at control sites during Cruises I, II, and III .<br />
142
TABLE 13 . Average number <strong>of</strong> aerobic bacterial CFU(x 10- ;) cultured on oil agar<br />
per ml <strong>of</strong> sediment collated at the primary platforms<br />
Primary<br />
Site Transect Cruise I Cruise II C ruise III<br />
P1 N 1100±480 4±3 310193<br />
E 1300 ± 800 5 ± 2 3401 250<br />
S 2300 ± 500 5 1 2 560 1 86<br />
W 1100 ± 670 6 1 2 420 1 85<br />
z 1400 1 770 5 ± 2 410 ± 160<br />
P2 N 2100 ± 2300 19 ± 11 860 t 130<br />
(4100 ± 560)a<br />
E 4500 ±1300 6 1 3 930 1 520<br />
S 1400 ± 1600 13 ± 5 1400 1 700<br />
(2700 t 710)a<br />
W 1600 ± 1100 8 t 4 2900 ± 1000<br />
z (2100 ± 460)8<br />
2400 ±2000 12 ± 8 1500 t 1000<br />
P3 N 2900 ± 1900 3 1 2 990 ± 640<br />
E 2900 ± 750 4 ± 5 1600 1 250<br />
S 4200 ± 970 3 ± 1 1200 ±1100<br />
W 3200 ± 1200 4 ± 4 350 ± 320<br />
z 3300 ±1300 4 ± 3 1000 ±740<br />
P4 N 1500 ± 260 2 1 1 350 1 230<br />
E 1700 1 310 2 ± 1 170 1 170<br />
(315 f 21)g<br />
S 2400 ± 2400 3 ± 2 580 1 250<br />
W 1400 ± 140 3 1 1 310 ±330<br />
(600 t 64)8<br />
z 1800 ± 1200 2 1 1 350 1 270<br />
z 2200± 1500 5 1 6 820 1 800<br />
ax t Sx calculated after eliminating outliers<br />
for Cruise II . Counts <strong>of</strong> bacteria on oil agar for the secondary<br />
platforms were similar to those reported for primary<br />
platforms during Cruise II, and to those reported<br />
for most control sites during all three cruises (Table 14) .<br />
Counts <strong>of</strong> aerobic bacteria were distributed along an<br />
east-west transect with the highest count in the eastern<br />
portion <strong>of</strong> the study area (Fig . 7) .<br />
When the ratio <strong>of</strong> bacteria cultured on oil agar :marine<br />
agar was expressed as a percentage and used to compare<br />
primary platforms and control sites from Cruises I, II,<br />
and III, only Cruise I results provided significant differences<br />
between primary platforms and control sites<br />
(Table 15, Fig . 8) . A similar trend was observed for<br />
Cruise III, but only for Control Sites C23 and C24<br />
(Table 15) . For Cruise II only Secondary Platforms S15<br />
and S17 had significantly high ratios <strong>of</strong> bacteria on oil<br />
agar :marine agar (Fig . 9) .<br />
3. Yessts and Fungi<br />
Yeasts and fungi were enumerated for 304 sediment<br />
samples collected during Cruises I, II, and III on<br />
triplicate plates <strong>of</strong> Cooke Rose Bengal (RB) agar and<br />
potato dextrose agar (PDA) resulting in 1824 plates .<br />
Only counts on RB agar are reported in Tables 16-18 ;<br />
counts on PDA were one or two orders <strong>of</strong> magnitude<br />
lower . For the control sites, generally higher counts <strong>of</strong><br />
yeasts and fungi were observed during Cruises II and III<br />
than during Cruise I (Table 16) . The opposite results<br />
were observed for the primary platforms ; that is, the<br />
highest counts <strong>of</strong> yeasts and fungi were observed during<br />
Cruise I (Table 17) . Counts <strong>of</strong> yeasts and fungi for the<br />
secondary platforms were similar to those reported for<br />
primary platforms and control sites during Cruise II<br />
(Table 18) .<br />
4. Nitrate-Reducing, Hydrocarbon-Utilizing Microorganisms<br />
Microorganisms from 304 sediment samples collected<br />
during Cruises I, II, and III were cultured in triplicate<br />
tubes <strong>of</strong> Rosenfeld's Nitrate-Hydrocarbon Medium<br />
(RNHM), and numbers <strong>of</strong> microorganisms capable<br />
<strong>of</strong> growing in this medium were quantified by the<br />
most probable number (MPN) method . Results from<br />
this quantification revealed the numbers <strong>of</strong> microbes capable<br />
<strong>of</strong> growing in RNHM were significantly lower<br />
than aerobic bacteria cultured on marine or oil agar or<br />
than yeasts and fungi (Tables 19-21) . The highest leastvariable<br />
counts <strong>of</strong> microbes capable <strong>of</strong> growth in<br />
RNHM were obtained during Cruise Il at Control Sites<br />
C22 and C24 (Table 19) . Most other counts appeared to<br />
be within at least cane order <strong>of</strong> magnitude <strong>of</strong> each other .<br />
S . Sulfate-Reducing, Hydrocarbon-Utilizing Microorganisms<br />
Microorganisms from 304 sediment samples<br />
collected during Cruises I, II, and III were cultured in<br />
143
s°<br />
O<br />
Q<br />
0 18 * 24<br />
0 14<br />
e<br />
o ~o<br />
O° 0 °°° 2<br />
0 19 20 0 111 o<br />
22 0<br />
12 . 8<br />
yin a o<br />
V<br />
21 . 5 8<br />
. .<br />
13<br />
?o<br />
6<br />
9 0<br />
3<br />
4 0<br />
17<br />
0 15<br />
16 ° 230<br />
LEGEND<br />
0 0-38,500 cells /ml<br />
46,000-125,000 cells/ml<br />
145,000-712,500 cells/ml<br />
Scale<br />
- ~ -: ,<br />
FIG . 7 . Aerobic hydrocarbonoclasts based on Duncan's Multiple Range Test (SPSS) .
TABLE 14. Average number <strong>of</strong> aerobic bacterial CFU (X 10-3)<br />
cultured on oil agar per ml sediment collected at<br />
the secondary platform during Cruise II<br />
Secondary I<br />
I Secondary<br />
Site CFU ± SR Site CFU t Si<br />
SS 71±8 S13 22±11<br />
S6 8tl S14 2t2<br />
S7 12±4 S15 8±2<br />
S8 9±3 S16 12±5<br />
S9 15±4 S17 15±5<br />
S10 5±4 S18 2±2<br />
S11 I 4±1 S19 110 .1<br />
S12 i 14±4 S20 3±1<br />
z±Sz=1 3±17<br />
TABLE 15 . Distribution <strong>of</strong> bacteria cultured on oil agar expressed<br />
as a percentage <strong>of</strong> the aerobic heterotrophic bacteria<br />
cultured on marine agar<br />
Secondary<br />
Site<br />
Transect<br />
Cruise I<br />
R .-t 2Sx<br />
Cruise II<br />
z t 2Sz<br />
Cruise III<br />
z ± 2Sz<br />
P 1 N 47 1 19 6 ± 4 130 1 63<br />
E 33123 713 64115<br />
S 59116 6±5 67117<br />
W 26±15 813 SSt14<br />
P2 N 100 ± 34 20 ± 11 96 t 16<br />
E 96±31 714 114149<br />
S S0 t32 1916 108±12<br />
W 38±26 12±8 178±41<br />
P3 N 46115 312 109138<br />
E 79±30 11±13 85±20<br />
S 92129 5±3 92165<br />
W 75±37 7±7 84±61<br />
P4 N 43±9 5±3 99148<br />
E 42±13 5±3 99±57<br />
S 64±66 9±7 127±66<br />
W 44±8 8±4 67± 12<br />
C21 - 7±5 14118 72144<br />
C22 - 1 1 1 5 f 8 56 ± 24<br />
C23 - 0.1 ±0 .05 9±4 2t 1<br />
C24 - 0.1±0 .05 13±12 310 .5<br />
145
100<br />
80<br />
J=257<br />
60<br />
40<br />
20<br />
i<br />
0<br />
1 N 1 E 1 S 1 W 2N 2E 2S 2W 3N 3E 3S 3W 4N 4E 4S 4W 21 22 23 24<br />
Site and Direction<br />
FIG. 8.<br />
Distribution <strong>of</strong> bacteria from Cruise I cultured on oil agar expressed as<br />
percentage <strong>of</strong> the bacteria cultured on marine agar .
60<br />
I= 25 - x<br />
40<br />
20<br />
0<br />
-111117, 1<br />
1 1 1 1 2 22 2333 34444 567 89101112131415161718192021<br />
N E S W N E S W N E S W N E S W N N N N N N N N N N N N N N N N<br />
2324<br />
FIG . 9 .<br />
Distribution <strong>of</strong> bacteria from Cruise II cultured on oil agar expressed as<br />
a percentage <strong>of</strong> the bacteria cultured on marine agar .<br />
147
TABLE 16 . Total number <strong>of</strong> yeast and fungal CFU cultured on<br />
Cooke's Rose Bengal Agar per ml <strong>of</strong> sediment<br />
collected at the control sites<br />
Control Site Cruise I Cruise II Cruise III<br />
C21 50 ± 50 7800 ±14000 450 ±360<br />
(430 ± 250)a<br />
C22 2200± 1200 1300 ±1500 680 f 270<br />
C23 1600 ±2100 1200 ±900 58 ±56<br />
C24 50 t 50 1400 :t- 440 250 :t320<br />
x 980 f 1450 3000 ± 7200 360 f 340<br />
(1200 ± 910)a<br />
ex t Sx calculated after eliminating outliers<br />
TABLE 17 . Total number <strong>of</strong> yeast and fungal CFU cultured on<br />
Cooke's Rose Bengal Agar per ml <strong>of</strong> sediment<br />
collected at the primary platforms<br />
Primary<br />
Site Transect Cruise I Cruise II Cruise III<br />
PI N 23,000 400 350<br />
E 45,000 1,300 510<br />
S 45,000 780 330<br />
W 45,000 1,300 980<br />
z 39,000 940 540<br />
P2 N 190 1,800 1,100<br />
E 17,000 720 450<br />
S 2,700 150 150<br />
W 16,000 550 1,900<br />
x 8,800 810 890<br />
P3 N 15,000 1,800 320<br />
E 20,000 780 130<br />
S 16,000 830 320<br />
W 9,600 970 25<br />
z 15,000 1,100 200<br />
P4 N 17,000 620 1,200<br />
E 24,000 680 880<br />
S 8,700 800 740<br />
W 23,000 420 2,200<br />
z 18,000 630 1,300<br />
z ± Si 20,000 ± 19,000 860 ± 670 720 f 910<br />
TABLE 18 . Total number <strong>of</strong> yeast and fungal CFU cultured on<br />
Cooke's Rose Bengal Agar per ml <strong>of</strong> sediment<br />
collected at the secondary platforms during Cruise II<br />
Secondary<br />
Site<br />
CFU<br />
Secondary<br />
Site<br />
CFU<br />
S5 820 S13 2200<br />
S6 900 S14 1700<br />
S7 750 S15 920<br />
S8 1100 S16 400<br />
S9 1700 S17 1800<br />
S10 1100 S18 840<br />
S11 1800 S19 580<br />
S12 900 S20 360<br />
z t Si = 1300 ±1400<br />
148
TABLE 19 . Total number <strong>of</strong> microorganisms cultured in<br />
Rosenfeld's nitrate-hydrocarbon medium per ml <strong>of</strong> sediment<br />
collected at the control sites<br />
Control Site Cruise I Cruise II Cruise III<br />
C21 16 1 8 2 1 1 290 1 540<br />
(15 t 11)8<br />
C22 8 t 10 50 t 41 25 t 45<br />
C23 8 1 10 6 1 4 150 1 100<br />
C24 10 t 9 51 t 41 160 t 200<br />
z 11 ± 9 27 ± 35 160 1 280<br />
(95 t 130)'<br />
"x t Si calculated after eliminating outliers<br />
TABLE 20 . Total number <strong>of</strong> microorganisms cultured in<br />
Rosenfeld's nitrate-hydrocarbon medium per ml <strong>of</strong> sediment<br />
collected at the primary platforms<br />
Primary<br />
Site Transect Cruise I Cruise II Cruise III<br />
P1 N 35140 10110 4201510<br />
E 614 5 t3 40f39<br />
S 36138 3t1 1201220<br />
W 10 :t 10 6 1 4 260 1 240<br />
z 22 1 29 6 ± 6 200 1 300<br />
P2 N 1.50 t110 33151 5±3<br />
E 19118 614 37138<br />
S 1401210 5±3 36138<br />
W 801110 3±1 617<br />
z 98 ± 130 12 ± 26 21 1 29<br />
P3 N 48±52 713 841110<br />
E 614 1451220 19118<br />
S 3±4 15118 14120<br />
W 28143 5±4 613<br />
z 22136 43±110 31161<br />
P4 N 3501510 612 815<br />
E S t2 814 14119<br />
S 4t1 2801550 819<br />
W 5±3 S t3 14tH<br />
z 91 t 280 74 t 2.70 11 f 11<br />
z t Si 57 t 150 34 t 150 68 t 170<br />
TABLE 21 . Total number <strong>of</strong> microorganisms cultured in<br />
Rosenfeld's nitrate-hydrocarbon medium per ml <strong>of</strong> sediment<br />
collected at the secondary platforms during Cruise II<br />
Secondary<br />
Site<br />
z f Si<br />
Secondary<br />
Site<br />
z t SR<br />
SS 910 S13 58160<br />
S6 18±18 S14 813<br />
S7 15121 S15 211<br />
S8 31153 S16 212<br />
S9 38 1 48 S17 1 :1- 1<br />
SIO 261 15 S18 614<br />
S11 13±7 S19 2± 1<br />
S12 33151 S20 6±2<br />
ztSz=16 129<br />
149
triplicate tubes <strong>of</strong> Rosenfeld's Sulfate-Hydrocarbon<br />
Medium (RSHM) . The number <strong>of</strong> microorganisms capable<br />
<strong>of</strong> growing in this medium were quantified by the<br />
MPN method . Results from this quantification produced<br />
numbers similar to those derived for microbes<br />
capable <strong>of</strong> growing in RNHM (Tables 22-24) . Counts <strong>of</strong><br />
these microbes could be described on an east-west transect<br />
(Fig . 10) .<br />
6. Chemical Nutrients<br />
Sediment samples (304) collected from control<br />
sites, primary platforms and secondary platforms during<br />
Cruises I, II, and III were analyzed for phosphate<br />
phosphorus (P04-P), ammonia nitrogen (NH4-N), nitrate<br />
nitrogen (N03-N), nitrite nitrogen (N02-N), total<br />
Kjeldahl nitrogen (TN), and total phosphorus (TP) .<br />
Concentrations <strong>of</strong> P04-P and NH4-N at control sites<br />
were lowest during Cruise I and highest during Cruise II<br />
(Tables 25-27) . Concentrations <strong>of</strong> TP at control sites<br />
were highest during Cruise I and lowest during Cruise<br />
III . Similar concentrations <strong>of</strong> N03-N, and TN were detected<br />
in control site sediments during all three cruises .<br />
Concentrations <strong>of</strong> P04-P in sediments collected<br />
at Primary Platform PI were lowest during Cruise I and<br />
highest during Cruises II and III . The opposite results<br />
were observed for Primary Platforms P2, P3, and P4<br />
(Tables 28-30) . Concentrations <strong>of</strong> NH4-N in sediments<br />
collected at primary platforms were lower during Cruise<br />
I than during Cruises lI and III . Concentrations <strong>of</strong><br />
NO3-N and TN were similar for primary platform sediments<br />
collected during Cruises I, II, and III . Concentrations<br />
<strong>of</strong> TP at primary platforms were somewhat lower<br />
during Cruise III .<br />
Concentrations <strong>of</strong> P04-P in sediments collected<br />
from Secondary Platforms SS and S6 were similar to<br />
concentrations reported for control sites and for<br />
TABLE 22 . Total number <strong>of</strong> microorganisms cultured on<br />
Rosenfeld's sulfate-hydrocarbon medium per ml <strong>of</strong> sediment<br />
collected at the control sites<br />
Control Site Cruise I Cruise II Cruise III<br />
C21 2017 5±3 35±17<br />
C22 9±10 3t1 9t9<br />
C23 7±3 3±1 5±3<br />
C24 3±1 2±0 6t2<br />
x 10±8 3±2 13116<br />
TABLE 23 . Total number <strong>of</strong> microorganisms cultured<br />
in Rosenfeld's sulfate-hydrocarbon medium per ml <strong>of</strong> sediment<br />
collected at the primary platforms<br />
Primary<br />
Site Transect Cruise I Cruise II Cruise III<br />
P1 N 15±9 311 8±2<br />
E 33±12 8±11 1819<br />
S 28±10 4±4 18±19<br />
W 10±9 3±1 29112<br />
z 21±13 4±6 18±13<br />
P2 N 140 ± 120 4±1 2017<br />
E 20±7 2±2 18119<br />
S 23±16 3±1 10±9<br />
W 1218 4±4 4±1<br />
x 48±76 3±2 13112<br />
P3 N 7±3 3±1 311<br />
E 18±10 3±1 6±6<br />
S 15110 3±2 25±14<br />
W 16±8 3±1 37141<br />
z 14±8 3±1 18±24<br />
P4 N 20±7 8±11 3±2<br />
E 9±10 2±0 .4 3±1<br />
S 13±7 3±1 5±3<br />
W 6±4 3±1 4±1<br />
x 12±9 4±5 4±2<br />
z±Sz 24±41 4±5 13±16<br />
150
TABLE 24 . Total number <strong>of</strong> microorganisms cultured in<br />
Rosenfeld's sulfate-hydrocarbon medium per ml <strong>of</strong> sediment<br />
collected at the secondary platforms during Cruise II<br />
Secondary I I Secondary<br />
Site R :t SR Site I x t SR<br />
S5 10±8 S13 10 t9<br />
S6 10±9 S14 2t0<br />
S7 14± 12 S15 2t0<br />
S8 6±2 S16 2t0<br />
S9 8±5 S17 2t0<br />
S10 2±0 S18 2t0<br />
S11 3± 1 S19 0 t0<br />
S12 10 :t- 10 S20 2t0<br />
ztSx=5 t6<br />
TABLE 25 . Concentrations <strong>of</strong> inorganic nutrients (Ng atom/kg dry weight sediment)<br />
in sediments collected from control sites during Cruise I<br />
Control<br />
Site P04-P NH4 -N N03-N<br />
Total N<br />
(X 10-2)<br />
Total P<br />
(X 10-°)<br />
C21 4.1 t 5 .3 130 ± 12 330 t 230 230 t 150 160 f 57<br />
C22 4.616 .8 77111 3101140 3801230 210118<br />
C23 43 .0 t 75 .0 91 f 14 1000 ± 170 340 t 210 180 t 23<br />
(5 .7 f 7 .7)<br />
C24 4 .4 ± 5 .6 1100 t 1500 490 ± 82 250 t 150 130 f 7<br />
(380 t 430)8<br />
x 14 t 38 350 ± 820 540 t 330 300 t 180 172 t 41<br />
4.615.6$ 16012208<br />
ax t Sx calculated after eliminating outlier<br />
TABLE 26 .<br />
Concentrations <strong>of</strong> inorganic nutrients (Ng atom/kg dry weight sediment)<br />
in sediments collected from control sites during Cruise II<br />
Control<br />
Site P04-P NH4 -N N03-N<br />
Total N<br />
(X 10'Z)<br />
Total P<br />
(X 10-2)<br />
C21 380 :t260 1500 t 140 850 t 160 130 t 49 96 t 45<br />
C22 220 ± 140 1100 ± 580 530 t 200 110 t 40 97 t 7<br />
C23 260 t 310 1400 t 500 960 t 170 150 f 83 85 t 20<br />
C24 140 t 50 1300 ± 400 400 ± 250 170 t 86 94 t 16<br />
x 250 t 210 1300 ± 420 690 ± 290 140 t 65 93 t 24<br />
151
O V ~ ~J<br />
o v n<br />
--<br />
0<br />
`'' e g 21 ~ 5 0<br />
O 1<br />
o0<br />
O op ~ e ~V "" o ° " 2<br />
120<br />
6<br />
13 ~<br />
u<br />
18 024<br />
22 0<br />
019 200 100<br />
~ .<br />
N<br />
14<br />
9<br />
160 23 ~<br />
4 ~<br />
LEGEND<br />
0 0,000-5 .550 cells/ml<br />
2 .300-9 .975 cells/ml<br />
2 ;800-10 .475 cells/ml<br />
8 .225-13 .650 cells/ml<br />
Scale<br />
17 0 10 20 30<br />
15<br />
FIG. 10 . Subsets <strong>of</strong> sulfate-reducing, hydrocarbon-utilizing bacteria based on Duncan's Multiple Range Test (SPSS) .
TABLE 27 . Concentrations <strong>of</strong> inorganic nutrients (pg atom/kg dry weight sediment)<br />
in sediments collected from control sites during Cruise III<br />
Control<br />
Site P04 -P NH4-N N03-N<br />
Total N<br />
(x 10-Z)<br />
Total P<br />
(x 10-Z)<br />
C21 170 ± 59 1300 ± 670 460 ± 310 79 ± 77 150 t 54<br />
C22 39 t 46 1200 f 160 670 ± 230 260 t 130 140 t 6<br />
C23 73 t 34 1100 ± 310 570 f 230 70 ± 40 130 t 17<br />
C24 75 ± 19 940 ± 290 810 ± 40 920 ± 1300 120 f 12<br />
(270 t 54)a<br />
z 90 t 64 1100 ± 390 630 t 240 330 ± 690 130 ± 27<br />
(160 ± 120 8<br />
°x t Sx calculated after eliminating outliers .<br />
TABLE 28 . Concentrations <strong>of</strong> inorganic nutrients (fig atoms/kg dry weight sediment)<br />
in sediments collected from the primary platforms during Cruise I<br />
Primary<br />
Site Transect P04-P NH4-N N03-N<br />
Total N<br />
(X 10-2)<br />
Total P<br />
(X 10-Z)<br />
P 1 N 8 1 1 180 1 160 270 ± 180 100 1 60 100 1 43<br />
E 55 ± 87 180 ± 100 330 ± 240 220 ± 220 150 :j- 23<br />
S 13 1 1 330 ± 140 220 ± 240 340 f 230 160 t 150<br />
W 33 ± 37 490 t 300 190 t 120 190 t 110 140 f 230<br />
x 27 ± 46 300 f 220 250 ± 190 210 f 170 140 t 230<br />
P2 N 86± 11 140±88 310±89 2201 110 1101 16<br />
E 180 ± 130 190 ± 180 310 t 78 380 t 430 220 t 61<br />
S 110 ± 28 130 ± 130 420 ± 350 150 f 52 100 f 53<br />
W 210±47 25±4 330162 130178 180140<br />
z 150 ± 81 120 ± 120 340 ± 170 220 t 220 150 ± 81<br />
P3 N 120 ± 33 28 ± 8 370 ± 260 140 ± 150 260 t 96<br />
E 180 :t 200 77 ± 82 480 t 250 210 ± 230 340 t 180<br />
S 340 t 95 120 ± 130 510 ± 151) 360 ± 81 350 ± 120<br />
W 340 ± 90 380 t 260 890 ± 590 430 t 160 330 t 170<br />
z 240 ± 150 150 t 190 560 ± 380 290 t 190 320 t 130<br />
P4 N 150 ± 58 270 ± 340 290 ± 120 360 t 170 170 ± 160<br />
E 120 t 22 250 t 150 720 ± 310 300 f 100 190 t 250<br />
S 95 ± 21 98 :t 150 250 f 76 250 f 150 150 t 270<br />
W 130 ± 47 210 t 220 880 ± 330 450 t 540 180 t 480<br />
z 120 ± 42 210 t 210 530 ± 350 340 ± 280 170 t 330<br />
x 140 ± 120 190 ± 200 420 t 310 260 ± 220 200 t 110<br />
153
TABLE 29 . Concentrations <strong>of</strong> inorganic nutrients (fig atoms/kg dry weight sediment)<br />
in sediments collected from primary platforms during Cruise II<br />
Primary<br />
Site Transect P04-P NH4-N N03-N<br />
Total N<br />
(x 10-z)<br />
Total P<br />
(X 10-2)<br />
P 1 N 130 t 20 1400 ± 470 690 ± 100 140 ± 79 81 ± 21<br />
E 150 f 58 880 f 250 570 t 130 180 t 180 74 t 8<br />
S 240 ± 83 1400 f 310 690 ± 70 270 ± 400 87 ± 19<br />
W 210 t 67 1500 ± 420 840 .t 150 130 t 110 110 f 21<br />
x 180 t 69 1300 ± 410 700 ± 150 180 t 210 88 t 21<br />
P2 N 12 ± 5 480 ± 190 430 ± 160 120 ± 160 74 ± 32<br />
E 17 :t 17 910 ± 840 440 t 310 110 t 160 91 ± 66<br />
S 10 f 7 530 t 280 520 t 290 150 ± 170 99 f 68<br />
W 33 ± 21 2000 ±1900 1200 ± 1200 150 t 140 280 ± 340<br />
x 18 t 16 970 f 1100 650 t 660 130 t 140 140 ± 180<br />
P3 N 35 ± 52 1500 ± 1700 1200 ± 1300 180 t 230 240 ± 320<br />
E 40 t 46 670 ± 550 610 t 300 90 t 44 150 t 79<br />
S 52 f 40 820 ± 500 650 ± 220 85 t 69 89 ± 56<br />
W 9 ± 5 380 ± 150 430 1 230 43 ± 24 67 ± 34<br />
z 34 ± 40 850 t 960 710 t 690 100 ± 120 140 t 160<br />
P4 N 14 ± 2 900 t 300 1100 t 250 130 t 75 95 t 16<br />
E 14 ± 2 1000 ± 150 720 t 84 100 ± 25 110 t 33<br />
S 1312 9401120 730182 63±28 110112<br />
W 14±1 1100196 9201180 74150 110112<br />
z 1412 980±180 8601210 93±52 110119<br />
z t Si 62 ± 81 1000 t 770 730 f 490 130 ± 140 120 f 120<br />
TABLE 30 . Concentrations <strong>of</strong> inorganic nutrients (fig atoms/kg dry weight sediment)<br />
in sediments collected from the primary platforms during Cruise III<br />
Primary<br />
Site Transect P04-P NH4-N N03-N<br />
Total N<br />
(x 10-z)<br />
Total P<br />
(X 10-2)<br />
P1 N 130±31 1400182 670±70 813 12015<br />
E 150 ± 22 1200 t 130 770 t 53 30 t 29 140 t 24<br />
S 180 ± 59 1000 t 200 750 ± 170 15 t 3 120 t 33<br />
W 140 ± 22 1000 ± 130 620 t 210 200 ± 120 140 t 7<br />
x 150 t 37 1100 ± 200 700 t 140 62 t 97 130 t 21<br />
P2 N 27 ± 24 260 t 150 430 ± 99 25 ± 7 140 t 45<br />
E 9 1 3 280 1 43 270 ± 120 33 ± 35 81 t42<br />
S 27±17 510±320 410±150 28±24 130147<br />
W 39 ± 23 300 ± 120 550 ± 250 110 ± 67 120 t 41<br />
z 26 ± 20 340 ± 200 410 ± 180 48 ± 50 120 ± 45<br />
P3 N 68 ± 36 1900 ± 590 1000 ± 190 51 t25 240 ± 30<br />
E 45 ± 23 1800 ± 970 680 ± 260 57 ± 18 190 t 76<br />
S 100± 39 2100 ± 740 750± 200 140 ± 100 140 ± 26<br />
W 77 ± 41 1600 ± 290 760 ± 190 95 ± 130 130 t 15<br />
z 73 ± 38 1900± 650 800 :t230 86± 85 170 t 60<br />
P4 N 15± 5 1100 ± 420 460 ± 180 150 t 27 110 ± 21<br />
E 13 ± 2 1100 ± 280 360 ± 230 220 ± 50 110 t 23<br />
S 12 t 2 830 ± 150 330 ± 210 190 ± 35 110 t 22<br />
W 13 t 2 940 ± 180 260 ± 48 190 t 55 120 t 21<br />
x 13 ± 3 1000 ± 280 350 t 180 180 t 46 120 t 20<br />
x 66 t 61 1100 ± 660 570±260 93 ± 88 130 t 46<br />
154
Primary Platform P1 during Cruise II (Table 31) . Concentrations<br />
<strong>of</strong> P04-P in sediments collected from Secondary<br />
Platforms S7-S9 and S12-S20 were similar to<br />
concentrations reported for Primary Platforms P2-P4<br />
during Cruise II . Concentrations <strong>of</strong> NH4 N, N03-N,<br />
TN and TP in sediments collected from secondary platforms<br />
were similar to concentrations reported for control<br />
sites and primary platforms during Cruise II . Detectable<br />
levels <strong>of</strong> N02-N were not found at any site on<br />
any cruise .<br />
7. Oil Degradation<br />
a. Sediments<br />
For each <strong>of</strong> the three cruises, tests for oildegrading<br />
potential <strong>of</strong> sediments were done on one composite<br />
sample from the four primary platforms and on<br />
one composite sample from the four control sites . The<br />
eight different test systems employed in these studies<br />
were designed to test the effect <strong>of</strong> temperature, oil concentration,<br />
and added nutrients (nitrogen and phosphorus)<br />
on oil degradation (Table 32) . Oxygen consumption<br />
data are given in Tables 33-38 . In all test systems, the<br />
slopes <strong>of</strong> the curves prepared from the oxygen consumption<br />
data were essentially the same for both the platforms<br />
and the control sites on each cruise, but differed<br />
from cruise to cruise . The sediments from Cruise II<br />
showed a greater oil-degrading potential than samples<br />
collected during Cruises I and III . This was reflected not<br />
only in a more rapid rate <strong>of</strong> oxygen utilization but also<br />
in greater total oxygen utilization over the 60 day period<br />
<strong>of</strong> the test (Fig . 11) .<br />
The rate <strong>of</strong> oxygen utilization was essentially<br />
the same at 15 C, 20 C, and 27 C, as determined by the<br />
slope <strong>of</strong> the oxygen utilization curves (Fig . 12) . It took<br />
longer to reach the stationary phase at 15 C than it did<br />
at either 27 C or 20 C'. .<br />
Increasing the concentration <strong>of</strong> oil ten-fold in<br />
the sediments did not have any significant effect on the<br />
rate <strong>of</strong> oxygen utilization . Added nitrogen (ammonium<br />
chloride or potassium nitrate) and phosphorus (potassium<br />
phosphate) dill not enhance oxygen utilization by<br />
the sediments .<br />
The analysis data were erratic . In setting up<br />
the test systems, the crude oil was added to a slurry <strong>of</strong><br />
the sediments prior to dispensing into the BOD bottles<br />
and a majority <strong>of</strong> the oil was adsorbed onto <strong>part</strong>iculate<br />
matter . While every effort was made to dispense a representative<br />
amount <strong>of</strong> slurry into each bottle, the heterogeneity<br />
<strong>of</strong> the sediments themselves created problems<br />
in dispensing the same amount <strong>of</strong> sediment and oil into<br />
each bottle, even though the total volume placed in each<br />
bottle was the same. The problem was further aggravated<br />
by the presence <strong>of</strong> background hydrocarbons in<br />
the sediment samples .<br />
When the amount <strong>of</strong> oil in the sample was determined<br />
on the basis <strong>of</strong> the amount <strong>of</strong> o-C,6 present,<br />
TABLE 31 . Concentrations <strong>of</strong> inorganic nutrients (fig atoms/kg dry weight sediment)<br />
in sediments collected from the secondary platforms during Cruise II<br />
Secondary<br />
Site P04 -P NH4 -N N03-N<br />
Total N<br />
(x 10-Z)<br />
Total P<br />
(X 10-Z)<br />
a - samples lost<br />
S5 150t 36 550 t 170 430 t 88 42 t 33 72 t 19<br />
S6 170 t 75 1700 t 290 1100 t 150 330 t 120 96 t 20<br />
S7 130t 230 610 ± 49 800 t 340 210 t 140 93 t 44<br />
S8 55 ± 49 700 ± 360 860 ± 86 58 ± 13 93 t 8<br />
S9 95 ± 10 680 ± 230 1200 t 190 320 t 160 110 1- 9<br />
S10 a 2100 t 540 540 t 80 310 ± 150 200 t 21<br />
S11 a 1900 :1- 530 550 t 24 580 t 480 220 :j- 55<br />
S12 83176 490138 680131 44126 73128<br />
S13 33 ± 5 2400 ± 380 1400 :t 460 340 :t 340 150 :1- 9<br />
S14 89 ± 23 850 ± 240 480 t 190 150 t 46 120 f 40<br />
S15 35 t 16 980 t 390 1000 ± 270 120 t 48 83 ± 7<br />
S16 24 t 3 1400 t 330 1700 t 600 79 t 23 160 t 23<br />
S17 86 ± 64 1200 ± 540 1400 ± 450 54 f 24 230 t 35<br />
S18 62 t 36 1000 t 270 340 t 130 160 t 38 130 t 71<br />
S19 18 t 5 530 t 260 290± 140 24 t 16 160 :1- 5<br />
S20 54 t 12 670 ± 250 350 t 140 100 f 84 130 t 150<br />
xtS 78182 1100±660 810 480 1801210 130165<br />
TABLE 32 . Purpose <strong>of</strong> test systems shown in TABLE 6<br />
Test System<br />
Data Em p lo yed to Determine<br />
1 vs 2 vs 3 Effect <strong>of</strong> temperature on oil degradation<br />
S vs 7 and 6 vs 8<br />
Effect <strong>of</strong> oil concentration on oil degradation<br />
3 vs 4 vs 5 vs 6 Effect <strong>of</strong> added phosphorus and nitrogen on oil degradation<br />
155
TABLE 33 . Oxygen consumption (z t S) by microorganisms from Cruise I<br />
control site sediments in test systems 1-8 (see TABLE 6)<br />
Incubation<br />
Time<br />
Dissolved oxygen consumed (mg/1) in test system number<br />
(Days) 1 2 3 4 5 6 7 8<br />
4 0 .3 10 0 .3 10 0 .5 t0 0 .4 10 0.41 0 0.41 0 0.4 10 0 .4 10<br />
7 0 .6 1 0 0 .7 1 0 0 .8 f 0 .1 0 .9 1 0.1 0 .8 1 0 .1 0 .8 1 0 .1 0.9 f 0 0 .9 f 0 .1<br />
11 0 .8 f 0 .1 0 .7 t 0 1 .2 f 0 .1 1 .4 t 0.1 1 .4 t 0 .1 1 .5 t 0 .1 1 .5 f 0 .1 1 .5 t 0 .1<br />
14 1 .3 ± 0 .2 1 .0 t 0 .1 1 .5 t 0 .1 1 .9 t 0.2 1 .8 t 0.1 1 .8 t 0 .2 2 .0 t 0 .2 2 .0 t 0.2<br />
17 1 .5 f 0 .3 1 .1 t 0 .1 1 .9 t 0 .1 2 .3 t 0 .2 2 .1 t 0.2 2 .1 t 0 .2 2 .6 f 0 .1 2 .6 * 0 .2<br />
20 1 .5 t 0 .3 1 .2 f 0 .1 2 .1 f 0 .2 2 .4 f 0.2 2 .4 t 0.2 2 .2 t 0 .2 3 .0 f 0 .1 2.8 t 0.2<br />
24 1 .6 :t 0 .4 1 .1 f 0 .1 2 .3 t 0 .1 2 .9 t 03 3 .0 t 0.4 2 .3 t 0 .1 3 .5 t 0 3 .1 t 0 .3<br />
27 1 .8 t 0 .5 1 .2 t 0 .1 2 .6 f 0 .2 3 .3 t 0 .4 3 .4 t 0.5 2 .6 f 0.1 4 .2 f 0 .1 3 .6 t 0 .3<br />
31 2 .4 f 0 .6 1 .3 f 0 .1 2 .9 f 0 .3 3 .4 f 0 .4 3 .8 t 0.7 2 .9 t 0 .2 4 .4 t 0 .2 3 .9 f 0 .3<br />
34 2 .6 t 0 .6 1 .4 ± 0 .1 3 .0 ± 0 .3 3 .6 f 0 .4 3 .9 t 0.7 2 .9 t 0.2 4 .6 t 0 .4 4 .1 t 0 .3<br />
40 3 .1 f 0 .8 1 .5 f 0 .1 3 .4 ± 0.4 4 .0 f 0 .4 4 .1 t 0.8 3 .2 t 0.2 4 .9 t 0 .6 4 .9 t 03<br />
45 3 .3 t 0 .6 1 .9 f 0 .1 3 .8 :t 0.6 4 .4 t 0 .1 4 .7 t 0 .3 3 .4 f 0.2 5 .5 f 1 .2 5 .0 t 0 .5<br />
49 3 .5 t 0 .6 2 .1 f 0 .4 3 .9 t 0.7 4 .5 f 0 .1 5 .5 t 0.3 3 .6 t 0.2 5 .9 t 1 .4 5 .2 t 0 .5<br />
53 3 .7 ± 0 .7 2 .3 f 0 .6 4 .0 f 0.7 4 .6 t 0 .2 5 .7 t 0 .6 3 .6 t 0.2 6 .2 :t 1 .3 5 .5 f 0 .5<br />
60 4 .1 f 0 .9 2 .4 t 0 .7 4 .1 t 0 .7 4 .7 t 0 .2 6 .0 t 0 .7 3 .9 t 0.2 7 .1 t 1 .0 5 .8 f 0 .7<br />
TABLE 34 . Oxygen consumption (x t S) by microorganisms from Cruise I<br />
platform site sediments in test systems 1-8 (see TABLE 6)<br />
Incubation<br />
Time<br />
Dissolved oxygen consumed ,~m- g/1) in test system number<br />
- (Days) 1 2 3 4 1 5 6 7 8<br />
4 03 1 0 0 .4 1 0 0.5 f 0 0 .4 f 0 0 .4 1 0 0 .5 1 0 0 .4 1 0 0 .4 1 0<br />
7 0 .6 1 0 0 .9 f 0 1 .0 f 0.1 0 .9 1 0 0 .8 f 0 .1 0.1 f 0.1 1 .0 f 0 .1 0 .9 1 0 .1<br />
11 1 .0 t 0 .1 1 .2 f 0 .1 1 .5 f 0.2 1 .6 t 0 .1 1 .5 t 0 .2 1 .6 t 0.2 1 .6 f 0 .1 1 .5 f 0 .1<br />
14 1 .6 t 0 .2 1 .6 ± 0 .1 1 .9 ± 0 .2 2 .1 f 0 .2 1 .9 t 0 .2 2 .1 t 0 .2 2 .2 t 0 .2 2 .0 f 0 .1<br />
17 1 .9 t 0 .3 1 .8 f 0 .1 2 .3 f 0.1 2 .5 f 0 .2 2 .3 t 0 .2 2 .4 t 0.2 2 .8 t 0 .2 2 .9 t 0 .1<br />
20 1 .9 f 03 1 .8 t 0 .1 2 .4 f 0 .1 2 .7 t 0 .2 2 .5 f 0 .2 2 .5 t 0.2 3 .2 f 0 .2 2 .1 t 0 .2<br />
24 2 .2 f 0 .4 1 .9 t 0 .2 2 .7 ± 0 .2 2.9 f 0 .2 2 .8 f 0 .4 2 .9 t 0 .3 3 .8 f 0 .1 3 .6 t 0 .2<br />
27 2 .4 f 0 .5 2 .0 t 0 .2 2 .9 :t 0 .2 3 .2 t 0 .2 3 .1 t 0 .6 3 .1 t 0 .3 4 .5 f 0 .1 4 .2 t 0 .3<br />
31 3 .1 t 0 .5 2 .2 f 0.2 3 .2 t 0 .2 3 .3 t 03 3 .6 t 0 .9 3 .3 t 0 .3 4 .6 f 0.1 4 .4 t 03<br />
34 3 .3 f 0.5 2 .2 t 0.2 3 .2 t 0 .2 3 .5 f 0.3 3 .8 t 0 .8 3 .4 t 0 .4 4 .7 ± 0.1 4 .5 t 0 .3<br />
40 3 .7 t 0 .5 2 .3 f 0 .2 3 .6 t 0 .2 4 .0 t 0 .3 4 .4 f 0 .8 3 .7 t 0 .4 5 .0 f 0.1 4 .8 t 03<br />
45 4 .3 f 0.4 2 .6 t 0 .2 3 .8 t 0 .2 4.3 t 0.4 4 .8 t 0 .4 4 .0 t 03 5 .1 t 0.1 5 .3 t 0 .3<br />
49 4 .4 t 0 .6 2 .8 t 0 .4 3 .8 t 0 .3 4 .7 t 0 .3 5 .1 f 0 .4 4 .2 t 0 .4 5 .6 t 0 .3 5 .7 t 0 .3<br />
53 4 .6 f 0 .6 2 .9 t 0 .4 4 .2 t 0 .8 3 .0 f 0 .3 5 .2 t 03 4 .3 t 0 .4 6 .7 t 0 .3 6 .0 :t 03<br />
60 4 .8 t 1 .2 3 .0 t 0 .4 5 .2 t 0 .7 5 .3 t 0 .3 5 .5 t 0 .3 5 .0 t 0 .2 7 .5 f 0 .1 6 .6 t 0 .1<br />
156
TABLE 35 . Oxygen consumption (z t S) by microorganisms from Cruise II<br />
control site sediments in test systems 1-8 (see TABLE 6)<br />
Incubation<br />
I<br />
Time L Dissolved oxygen consumed (mg/1) in<br />
4 3 .6 f 1 .2 1 .9 t 0 .1 3 .2 f 0 .3 3 .5 t 0 .2 3 .1 ± 0 .3 4 .3 t 0.1 4 .6 f 0 .7 4 .6 t 0.1<br />
7 15 .2 t 4 .0 5 .5 ± 0 .4 15 .0 ± 0 .7 14.9 t 0 .8 13 .0 ± 0 .7 17 .3 f 1 .6 15 .8 t 1 .5 15 .8 t 0.6<br />
11 28 .5 t 7 .6 20 .2 t 2 .1 27 .8 ± 1 .8 30 .4 t 1 .4 27 .9 t 0 .7 25 .3 f 2 .0 31 .9 t 1 .6 26 .3 t 0.9<br />
14 39 .1 t 12 .2 23 .6 t 1 .4 34 .4 f 1 .3 36 .6 t 1 .9 34 .2 ± 1 .1 28 .3 f 2 .0 39 .2 t 1 .5 29 .0 ± 0.9<br />
17 45 .3 t 16 .3 27 .2 t 1 .5 38 .7 t 1 .2 40 .7 f 1 .9 37 .7 ± 1 .0 31 .8 t 2 .0 43 .4 t 2 .0 32 .5 t 0 .8<br />
20 53 .1 f 18 .7 30 .1 t 1 .6 41 .0 t 1 .2 43 .7 t 2 .2 39 .9 ± 0 .9 34 .5 t 1 .1 46 .9 t 2 .0 34 .3 t 0.7<br />
24 61 .2 t 21 .1 33 .2 f 1 .6 42 .5 t 1 .2 45 .5 ± 2 .2 41 .6 f 0 .9 36 .8 t 1 .4 48 .7 t 2 .1 35 .2 t 0 .7<br />
27 67 .0 ± 21 .8 34 .8 t 1 .7 44 .0 t 1 .2 47 .2 ± 2 .2 43 .2 t 0 .8 38 .7 t 1 .6 51 .0 f 1 .9 37 .7 t 0.6<br />
31 70 .3 f 23 .2 35 .3 ± 1 .9 44.0 t 1 .2 47 .2 t 2 .2 43 .2 t 0 .8 38 .8 f 1 .6 51 .0 t 1 .9 37 .7 t 0.6<br />
34 75 .3 f 24 .1 37 .0 t 2 .0 45 .1 f 1 .2 48 .5 t 2 .2 44 .7 ± 0 .8 40.6 :t 1 .7 52 .7 f 2 .0 40 .0 f 0.9<br />
40 86 .7 t 22 .6 37 .1 f 2.2 45 .5 t 0.8 49 .8 t 13 45 .0 :t 1 .1 41 .7 t 2.7 53 .2 f 2.8 40 .0 f 1 .2<br />
45 93 .7 t 24 .0 37 .2 t 2 .4 46 .3 ± 1 .1 51 .0 ± 1 .5 45 .9 ± 1 .1 42 .9 t 2 .7 53 .3 t 2 .8 40 .0 f 1 .0<br />
49 96 .8 f 26 .8 38 .0 :t 3 .1 46.4 :t 1 .0 51 .0 t 1 .5 45 .9 .-t 1 .1 43 .0 :t 2.9 53 .9 t 2,6 40 .7 f 0.7<br />
53 101 .2 t 27 .3 38 .3 :t 3 .1 47.3 t 0.8 52 .0 t 1 .7 46 .4 t 1 .3 43 .9 t 2.7 55 .1 f 2 .6 42.0 t 0.8<br />
60 103 .2 t 28 .0 38 .9 ± 3 .1 47 .5 t 0 .8 52 .0 ± 1 .8 47 .1 t 1 .3 44 .3 f 2 .4 55 .7 t 2 .6 42 .4 t 0 .7<br />
TABLE 36 . Oxygen consumption (z t S) by microorganisms from Cruise II<br />
platform site sediments in test systems 1-8 (see TABLE 6)<br />
Incubation<br />
Time<br />
Dissolved ox en consumed mg/1) in tests stem number<br />
(Days) 1 2 3 4 5 6 7 8<br />
4 2 .8 t 1 .6 1 .8 ± 0 .1 3 .1 t 0 .3 3 .6 t 0 .2 3 .6 t 0 .2 4 .5 t 0 .1 4 .5 t 0.5 4 .6 t 0 .2<br />
7 11 .3 t 3 .8 5 .2 f 0 .4 15 .1 t 0 .9 14 .4 f 0.7 14 .8 t 0 .7 15 .8 t 0 .6 14 .9 t 0.6 15 .2 t 0 .6<br />
11 21 .5 f 8 .4 17 .2 t 2 .3 303 t 0 .9 30 .3 t 0 .6 29 .9 t 0 .8 24 .4 t 1 .6 30 .5 t 0.7 25 .4 t 0 .6<br />
14 28 .8 f 15 .2 24 .6 t 2 .5 38 .3 f 0 .8 37 .1 t 0.8 38 .4 t 0 .9 28 .0 t 2 .0 38 .5 f 3 .1 29 .2 t 1 .1<br />
17 33 .4 t 17 .4 28 .6 t 2 .9 42 .5 t 1 .0 41 .9 t 0.8 43 .0 t 2 .0 31 .5 f 1 .9 44.2 ± 3 .5 32 .5 t 1 .0<br />
20 42 .9 t 22 .4 33 .8 t 2 .7 46 .2 t 0 .9 45 .1 t 0.8 45 .5 f 2 .5 34 .0 f 1 .7 47 .8 f 1 .6 34 .1 f 0 .5<br />
24 50.2f26 .5 37,6133 48310 .8 46.910 .7 47.3f2 .3 36.1f1 .8 49311 .7 35.6f0 .6<br />
27 54 .6 f 29 .2 39 .8 t 3 .4 50 .0 t 0 .8 48 .5 t 0.8 49 .0 t 23 37 .9 f 1 .9 51 .5 f 1 .8 38 .0 t 0 .6<br />
31 56 .5 t 30 .1 39 .8 ± 3 .4 50 .0 t 0 .8 48 .6 t 0 .8 49 .0 t 2 .3 38 .2 t 2 .1 51 .5 t 1 .8 38 .0 t 0 .6<br />
34 61 .0 t 32 .4 41 .4 ± 3 .4 51 .3 t 0 .9 50.1 ± 0.8 50 .5 ± 2 .3 40.0 t 2 .5 57 .6 t 1 .7 39 .8 t 0.6<br />
40 42 .3 f 12 .9 43 .2 :t 4 .1 50 .9 t 1 .1 50 .4 f 1 .1 51 .4 ± 3 .4 39 .0 t 1 .2 52 .5 :t 1 .7 40 .2 t 0 .9<br />
45 45 .2 t 13 .7 44.0 ± 3 .9 51 .6 t 1 .1 52.0± 1 .1 52 .7 t 3 .4 40.3 t 1 .2 52 .8 f 1 .8 40 .7 t 1 .2<br />
49 46 .1 t 13 .7 45 .8 ± 4 .2 52 .2 ± 1 .1 52 .0 ± 1 .1 52 .7 t 3 .4 40 .3 t 1 .2 53 .7 t 2 .0 41 .4± 1 .'1<br />
53 48 .1 t 14 .2 46 .6 t 4 .3 53 .1 t 1 .1 53 .0 t 1 .2 53 .4 ± 3 .5 40 .8 t 1 .9 54 .7 t 2 .0 42 .5 t 1 .4<br />
60 49 .3 t 14 .6 47 .3 ± 4 .4 53 .5 t 1 .0 53 .7 t 1 .2 54 .1 t 3 .4 41 .9 t 1 .9 55 .3 t 1 .9 42 .9 t 1 .5<br />
157
TABLE 37 . Oxygen consumption (z f S) by microorganisms from Cruise III<br />
control site sediments in test systems 1-8 (see TABLE 6)<br />
Incubation<br />
Time I Dissolved oxygen consumed (mg/1) in test system number<br />
-Ra y s) 1 2 3 4 5 6 7 8<br />
4 0 .2 10 0 .3 10 0.41 0 0 .3 10 0 .4 10 0 .4 10 10 .4 10 0.41 0<br />
7 0 .4 1 0 0 .7 1 0 .1 0.9 f 0 0 .7 1 0 0.7 1 0 .1 0 .7 1 0 0 .9 1 0 .1 0.8 f 0<br />
11 0 .7 t 0 0.9 t 0.1 1 .1 f 0 .1 0 .9 f 0 .1 0.9 t 0 .1 0 .8 f 0 1 .0 t 0 .1 0.9 t 0<br />
14 0.8 f 0 1 .1 f 0.1 1 .3 t 0 .6 1 .1 t 0 .1 1 .1 t 0 .2 0.9 t 0 1 .2 t 0 .1 1 .0 t 0<br />
17 1 .1 f 0 .1 1 .2 ± 0.1 1 .6 t 0 .8 1 .3 t 0.1 1 .3 f 0 .2 1 .0 t 0 .1 1 .3 f 0.1 1 .1 t 0<br />
20 1 .3 f 0 1 .2 f 0.2 1 .7 t 0 .7 1 .4 t 0.1 1 .4 t 03 1 .2 t 0 .1 1 .4 t 0.1 1 .2 f 0<br />
24 1 .5 f 0 .1 1 . t 0 .2 1 .8 f 0 .7 1 .5 f 0 .1 1 .5 f 0.3 1 .3 f 0 .1 1 .5 t 0 .1 1 .2 f 0<br />
27 1 .5 f 0 .1 1 .4 t 0 .2 1 .8 t 0.7 1 .5 t 0 .1 1 .7 t 0.3 1 .3 t 0 .1 1 .5 t 0 .1 1 .3 f 0<br />
31 1 .5 f 0 .1 1 .4 f 0 .2 1 .8 f 0.7 1 .5 f 0 .1 1 .7 t 0 .3 1 .3 f 0 .1 1 .7 t 0 .1 1 .4 t 0<br />
34 1 .6 t 0 .1 1 .4 t 0 .2 2 .0 t 0.1 1 .7 f 0 .1 1 .8 t 0 .4 1 .5 f 0 1 .9 t 0 .1 1 .6 f 0<br />
40 1 .8 t 0 .1 1 .4 t 0 .2 2 .0 t 0.1 1 .7 t 0 .1 1 .8 f 0 .2 1 .5 t 0.1 2 .0 t 0 .1 1 .6 t 0<br />
45 2 .0 t 0.1 1 .5 t 0.2 2 .0 t 0 .1 1 .7 t 0.1 1 .9 t 0 .2 1 .6 f 0 .1 2 .2 f 0.2 1 .7 t 0 .1<br />
49 2 .3 f 0.1 1 .5 f 0.2 2 .2 t 0 .1 1 .8 f 0.1 2 .0 t 0 .2 2 .0 f 0 .2 2 .3 f 0.1 1 .8 f 0 .1<br />
53 2 .5 f 0 1 .6 f 0 .2 2 .4 t 0 1 .9 t 0.1 23 f 0 .4 2 .5 f 03 2 .4 t 0 .2 2 .0 t 0 .1<br />
60 2 .6 t 0 .1 1 .6 f 0 .2 2.7 t 0 .3 1 .9 t 0.1 2 .7 t 0.9 2 .6 f 0 .3 2 .7 t 0 .3 2 .0 t 0.1<br />
TABLE 38 . Oxygen consumption (z t S) by microorganisms from Cruise III<br />
platform site sediments in test systems 1-8 (see TABLE 6)<br />
Incubation<br />
Time<br />
consumed (mg/1) in test<br />
(Da ys ) 1 2 3 4 5 6 7 8<br />
4 0 .2 1 0 0 .1 :to 0.4± 0 0 .4 1 0 0 .4 1 0 0 .4 1 0 0 .4 1 0 0 .4 :t 0<br />
7 0 .4 1 0 . : 0 .6 ± 0 1 .0 1 0 .1 0 .9 ± 0 0 .9 ± 0 .1 0 .8 f 0 0 .9 f 0 .1 0 .8 1 0.1<br />
11 0 .7 t 0 .2 0 .9 t 0 1 .1 f 0 .1 1 .1 t 0 1 .1 f 0.1 1 .0 t 0 1 .1 t 0 .1 1 .0 t 0.1<br />
14 0 .9 f 0 .4 1 .0 t 0 .1 1 .3 f 0 .1 1 .3 t 0 .1 1 .3 f 0.1 1 .1 ±0 .1 1 .3 f 0 .2 1 .1 ±o. 1<br />
17 1 .2 f 0 .5 1 .2 t 0 .1 1 .6 f 0.1 1 .5 t 0 .1 1 .5 t 0 .1 1 .3 f 0 .1 1 .5 t 0 .3 1 .2 f 0.1<br />
20 1 .3 t 0 .7 1 .3 ± 0 .1 1 .7 :t 0.2 1 .7 t 0 .2 1 .8 ± 0 .2 1 .4 t 0.1 1 .8 f 0 .3 1 .3 f 0.1<br />
24 1 .6 t 0 .6 1 .5 ± 0 .1 1 .8 t 0 .2 1 .8 f 0 .2 2 .0 :t 0 .4 1 .5 f 0.1 1 .8 t 0 .3 1 .4 t 0 .1<br />
27 1 .6 f 0 .6 1 .5 f 0.1 1 .8 t 0 .2 1 .9 f 0 .2 2 .2 f 0 .3 1 .5 f 0.1 1 .8 f 0 .3 1 .4 f 0 .1<br />
31 1 .6 f 0.6 1 .5 t 0.1 2 .0 t 0 .2 2 .0 f 0.3 2 .3 t 0 .4 1 .6 f 0 .1 1 .9 t 0 .3 1 .5 f 0 .1<br />
34 1 .7 t 0.7 1 .5 f 0 .1 2 .1 f 0 .3 2 .2 f 0.3 2 .8 t 0 .3 1 .8 f 0 .1 2 .1 t 0.2 1 .8 t 0 .1<br />
40 2 .1 f 1 .1 1 .4 ± 0 2 .1 f 0 .1 2 .1 ± 0 .1 3 .0 ± 0 .1 2 .0 t 0 .3 2 .2 t 0 .4 1 .8 f 0 .1<br />
45 2 .4 t 1 .2 1 .5 ± 0 2.2 ± 0 .3 2 .3 t 03 3 .5 t 0.3 2 .6 t 0 .5 2 .4 f 0 .5 1 .9 t 0 .1<br />
49 2 .7 t 1 .3 1 .6 t 0 2 .6 t 0.5 2 .6 t 0 .5 4 .0 f 0.5 3 .0 f 0 .3 2 .7 t 0 .8 1 .9 t 0.1<br />
53 2 .9 f 1 .4 1 .6 ± 0 3 .2 t 0.3 2 .9 t 0 .6 4 .3 t 0 .7 3 .3 t 0 .2 3 .0 ± 1 .3 2 .3 f 0.5<br />
60 2 .9 f 1 .4 1 .6 ± 0 3 .4 t 0 .4 3 .3 f 0 .3 4 .4 ± 0 .7 3 .4 t 0.2 3 .5 :1- 1 .6 2 .7 t 0 .4<br />
158
6 .02<br />
5.16<br />
PLATFORM<br />
w<br />
w<br />
E<br />
w<br />
a<br />
0<br />
W<br />
N<br />
J<br />
4.30<br />
3.44<br />
2.58<br />
CRUISE II ~<br />
CONTROL<br />
0-1 de<br />
~~ ~'<br />
CRUISE ~, / i<br />
PLATFORMS ~~~CONTROL<br />
le #100 e<br />
i<br />
.100<br />
i<br />
i loe<br />
CRUISE III<br />
loe . ., . . .<br />
PLATFORM ,,-`<br />
CONTROL<br />
0 1 .72<br />
E<br />
, .<br />
0.86<br />
10 20 30 40 50 60<br />
DAYS OF INCUBATION<br />
FIG. 11 . Oxygen utilization by sediments during incubation with oil at 27 C in BOD bottles .<br />
159
6.02<br />
/x 15C<br />
5.16<br />
~x27x x<br />
~x-x ~x<br />
-x<br />
ix'x<br />
x<br />
20C<br />
w<br />
0<br />
W<br />
E<br />
4.30<br />
3 .44<br />
- ,x<br />
x<br />
W<br />
a<br />
w<br />
N<br />
J<br />
H<br />
N<br />
2.58<br />
X / /<br />
x x<br />
X<br />
E<br />
1 .72 -<br />
0.86<br />
x<br />
x<br />
x<br />
x/ ~<br />
p 10 20 30 4p 5p 6p<br />
DAYS OF INCUBATION<br />
FIG . 12 . Effect <strong>of</strong> temperature on oxygen utilization by sediments taken from platform areas (Cruise II)<br />
during incubation with oil in BOD bottles .<br />
160
the data indicated that all <strong>of</strong> the oil was consumed<br />
within the first 20 days <strong>of</strong> incubation .<br />
The data obtained by measuring UV absorption<br />
at 277 nm were highly variable and sometimes the<br />
values increased with increasing time <strong>of</strong> incubation .<br />
Part <strong>of</strong> this observation may be explained on the basis<br />
<strong>of</strong> the production by the micr<strong>of</strong>lora <strong>of</strong> compounds that<br />
absorb 277 nm UV light .<br />
Samples were also analyzed by fluorescence<br />
using a 274 nm excitation wavelength and measuring<br />
emission at 370 nm . The values obtained by this method<br />
<strong>of</strong> analysis were low and decreased with increasing time<br />
<strong>of</strong> incubation .<br />
Analyses were also conducted by measuring<br />
fluorescence at 418 nm after excitation at 403 nm . This<br />
method <strong>of</strong> analysis detects petrogenic hydrocarbons but<br />
not biogenic hydrocarbons . On the basis <strong>of</strong> these analyses<br />
the hydrocarbon content decreased with increasing<br />
time <strong>of</strong> incubation and was usually absent after 20 days<br />
<strong>of</strong> incubation .<br />
The colonial types developing on oil agar<br />
streaked from the BOD bottles after incubation were<br />
similar for both platform and control samples . Only<br />
several distinct colonial types were present and the majority<br />
<strong>of</strong> these resembled pseudomonads . Four <strong>of</strong> the<br />
predominant type colonies were subjected to purification<br />
procedures and were employed in the next section<br />
<strong>of</strong> the study . Two <strong>of</strong> the organisms were identified as<br />
Pseudomonas species and two were identified as Flavo-<br />
6acterium species .<br />
b . Mixed and Pure Cultures<br />
Studies on the degradation <strong>of</strong> crude oil by<br />
mixed and pure cultures were carried out in 125-m1 Warburg<br />
flasks .<br />
In the first experiment, 50 1Al <strong>of</strong> Empire Mix<br />
crude oil in the test flasks was inoculated with a slurry<br />
prepared from a mixture <strong>of</strong> sediments from control and<br />
platform sites from Cruise I . Flasks without oil served<br />
as the endogenous controls . Oxygen consumption and<br />
carbon dioxide production are shown in Fig . 13 . As may<br />
be observed, the rate <strong>of</strong> oxygen utilization and carbon<br />
dioxide production rose rapidly after 18 hours, remained<br />
high for nearly 70 hours, and then diminished .<br />
The respiratory quotient (RQ) increased during the first<br />
100 hours and then remained essentially constant at 0 .7 .<br />
Since the RQ for a medium sized alkane (n-C16) is 0 .65<br />
and for an aromatic (naphthalene) is 0.83, the RQ <strong>of</strong> 0 .7<br />
indicates that the crude oil was almost completely oxidized<br />
to carbon dioxide .<br />
Data from the chemical analyses <strong>of</strong> the flask<br />
contents showed that with time the percent <strong>of</strong> alkanes<br />
decreased, then increased, suggesting the production <strong>of</strong><br />
these compounds by the micr<strong>of</strong>lora (Fig . 14) . The ratios<br />
<strong>of</strong> heptadecane to pristane, and octadecane to phytane<br />
decreased with time, indicating a preference for the<br />
straight-chain compounds over the branched-chain<br />
compounds (Fig . 15) .<br />
The next experiment was done using one enrichment<br />
culture derived from platform sediments and<br />
one enrichment culture derived from control sediments .<br />
For Cruise I, the data in Fig . 16 show that oxygen utilization<br />
and carbon dioxide production were greater for<br />
the platform sediments than for the control sediments .<br />
Furthermore, the rate <strong>of</strong> oxygen utilization and carbon<br />
dioxide production was greater for the platform<br />
sediments . Respiratory rates for the enrichment cultures<br />
are shown in Table 39. Analyses <strong>of</strong> the flask contents<br />
after incubation indicated that the aliphatic compounds<br />
were reduced in concentration in the control enrichment<br />
flasks and were essentially depleted in the platform enrichment<br />
flasks (Fig . 17) . There appeared to be very<br />
little utilization <strong>of</strong> the aromatic compounds by the control<br />
enrichment culture while the platform enrichment<br />
culture substantially reduced the aromatics (Fig . 18) .<br />
The GC-MS analyses performed on these samples confirmed<br />
the results <strong>of</strong> the GC and LC data given in Figs .<br />
17 and 18, respectively . The terminal RQ for the platform<br />
sediments was 0.59 while that <strong>of</strong> the control sediment<br />
was 0 .31 .<br />
This experiment was repeated with another<br />
set <strong>of</strong> enrichment cultures prepared from samples collected<br />
on the second cruise . As in the previous experiment,<br />
both the total amount <strong>of</strong> oxygen consumed and<br />
the total amount <strong>of</strong> carbon dioxide produced were<br />
greater with the platform sediments but the difference<br />
was not as pronounced (Fig . 19) . Similarly, the rate <strong>of</strong><br />
oxygen utilization and the rate <strong>of</strong> carbon dioxide production<br />
were somewhat greater for the platform sediments<br />
(Table 39) . The RQ values for the platform sediments<br />
and the control sediments were 0 .45 and 0 .53, respectively<br />
. Evaluation <strong>of</strong> the data from chemical<br />
analyses confirmed that more oil was degraded by the<br />
platform sediments than was degraded by the control<br />
sediments . In bath cases the straight-chain aliphatics<br />
were degraded to a greater extent than were the<br />
branched-chain aliphatics and the aromatics .<br />
Experiments were also conducted using pure<br />
cultures <strong>of</strong> oil-degrading organisms (Table 40) . The OZ<br />
utilization and COZ production by Pseudomonas sp . 1<br />
during growth on Empire Mix crude oil is shown in Fig . 20 .<br />
The final RQ was 0 .39 . Chemical analyses <strong>of</strong> the residual<br />
oil showed that the straight-chain aliphatics were<br />
TABLE 39 . Respiration rates for enrichment cultures <strong>of</strong> primary platform<br />
and control site sediment microorganisms during oxidation<br />
<strong>of</strong> Empire Mix crude oil<br />
Res p iration Rate (m icroGters per hour)<br />
Cruise Site OZ Consumption COZ Production<br />
I Platform 120 40<br />
I Control 30 13<br />
II Platform 140 100<br />
11 Control 100 32<br />
161
10<br />
VIL FLASKS<br />
8<br />
02 CONSUMED<br />
N<br />
W<br />
H<br />
J<br />
~i00 C02 PRODUCED<br />
i<br />
NON-OIL FLASKS<br />
02 CONSUMED and<br />
.00" C02 PRODUCED i (negligible)<br />
0<br />
50 100 150<br />
HOURS<br />
FIG. 13 . Oxygen consumption and carbon dioxide production by a sediment sample from the Gulf <strong>of</strong> Mexico .
30<br />
z w<br />
U<br />
cc<br />
W<br />
20<br />
1(<br />
0 50 100 150 200<br />
HOURS<br />
FIG . 14 . Percent alkanes (heptadecane through eicosane, and pristane and phytane) as a percent <strong>of</strong> the total oil<br />
during the microbial degradation <strong>of</strong> Empire Mix crude oil.<br />
163
2.0<br />
FE<br />
O<br />
H<br />
Q<br />
ac<br />
1 .0<br />
0<br />
50 100 150 200<br />
HOURS<br />
FIG. 15 . Changes in the ratios <strong>of</strong> heptadecane (o-C,7) to pristane and octadecane (o-Cl .) to phytane<br />
(straight-to branched-chains) during the microbial degradation <strong>of</strong> Empire Mix crude oil .<br />
164
6<br />
r<br />
W<br />
O<br />
oc<br />
U<br />
2<br />
0<br />
50 100<br />
HOURS<br />
FIG. 16 . Oxygen consumption and carbon dioxide production during the microbial metabolism <strong>of</strong> Empire Mix<br />
crude oil by enrichments prepared from samples taken on Cruise I .<br />
165
FIG . 17 . Gas chromatography tracings <strong>of</strong> the aliphatics before and after microbial degradation by<br />
a control enrichment culture and a platform enrichment culture .
EMPIRE MIX CRUDE OIL BEFORE DEGRADATION<br />
BICYCUCS<br />
TRICYCUCS<br />
UNICYCUCS<br />
TETRACYCLICS<br />
AFTER DEGRADATION BY CONTROL ENRICHMENT<br />
AFTER DEGRADATION BY PLATFORM ENRICHMENT<br />
FIG. 18 . Liquid chromatography tracings <strong>of</strong> the aromatics in Empire Mix crude oil before and after microbial<br />
degradation by a control enrichment culture and a platform enrichment culture.<br />
167
8000<br />
6000<br />
W<br />
J<br />
4000<br />
Q<br />
i<br />
i<br />
2000<br />
i<br />
0<br />
25 50 75<br />
HOURS<br />
FIG . 19 . Oxygen consumption and carbon dioxide production during the microbial metabolism <strong>of</strong> Empire Mix<br />
crude oil by enrichments prepared from samples taken on Cruise II .<br />
168
8000<br />
6000<br />
cc<br />
W<br />
H<br />
J O 4000<br />
CC<br />
U<br />
1<br />
50 100<br />
HOURS<br />
FIG. 20 .<br />
Oxygen consumption and carbon dioxide production by Pseudomonas sp 1 during the metabolism <strong>of</strong><br />
Empire Mix crude oil .<br />
169
TABLE 40 . Respiration rate for pure cultures<br />
during oxidation <strong>of</strong> Empire Mix crude oil<br />
Respiration Rate microliters p er hour<br />
Isolate OZ Consumption COZ Production<br />
Pseudomonassp .l 200 200<br />
Flavobacterium sp . 1 200 180<br />
Pseudomonas sp . 2 30 20<br />
Flavobacterium sp . 2 30 20<br />
absent, and the branched-chain aliphatics had been reduced<br />
. Some degradation <strong>of</strong> aromatics was indicated .<br />
The OZ utilization and COZ production by<br />
Flavobacterium sp . 1 was similar to that observed for<br />
Pseudomonas sp . 1 (Fig . 21) . The final RQ (0 .31) and<br />
the fingerprint <strong>of</strong> the residual oil was essentially the<br />
same as that displayed by Pseudomonas sp . 1 .<br />
A similar experiment was conducted on two<br />
additional oil-degrading isolates (Fig . 22 and 23) . The<br />
RQ values were 0 .70 and 0 .58 for Pseudomonas sp . 2<br />
and Flavobacterium sp . 2, respectively . Essentially all <strong>of</strong><br />
the straight-chain aliphatics were degraded by the Pseudomonas,<br />
along with about SO% <strong>of</strong> the branched-chain<br />
aliphatics . Nearly all <strong>of</strong> the two-ring aromatics and approximately<br />
two-thirds <strong>of</strong> the three-ring aromatics were<br />
degraded, and there appeared to be some slight degradation<br />
<strong>of</strong> the larger aromatics . There were some higher<br />
molecular weight straight-chain aliphatics (about CO<br />
and a large amount <strong>of</strong> branched-chain (C2, or C25 aliphatics<br />
produced . There also appeared to be some aromatics<br />
produced by the cells .<br />
The results <strong>of</strong> the chemical analyses on the<br />
residual material from Flavobacterium sp . 2 were similar<br />
to those for Pseudomonas sp . 2, but there appeared<br />
to be less degradation <strong>of</strong> the three-ring aromatics, and<br />
the production <strong>of</strong> aromatics by the isolate was not evident<br />
. This isolate produced the same aliphatics as did<br />
Pseudomonas sp . 2 but in a lesser quantity .<br />
8. Nitrification<br />
Forty composite sediment samples prepared<br />
from primary platform and control site sediments were<br />
examined for nitrification . None <strong>of</strong> the samples demonstrated<br />
detectable nitrification activity, as exemplified<br />
by the data for sediment microorganisms from Primary<br />
Platform P1 collected during Cruise I (Table 41) . Comparisons<br />
using fresh and frozen samples produced similar<br />
(insignificant) rates <strong>of</strong> nitrification .<br />
9. Nitrogen Fixation<br />
Forty composite samples prepared from primary<br />
platform and control site sediments were examined for<br />
nitrogen fixation . None <strong>of</strong> the samples demonstrated<br />
detectable nitrogen fixation activity, as exemplified by<br />
the data for sediment microorganisms from Primary<br />
Platform P1 collected during Cruise I (Table 42) . Comparisons<br />
using fresh and frozen samples produced similar<br />
(insignificant) rates <strong>of</strong> nitrogen fixation .<br />
10. Denitrification<br />
Forty composite samples prepared from<br />
primary platform and control site sediments were<br />
examined for denitrification . None <strong>of</strong> the samples demonstrated<br />
detectable denitrification activity, as exemplified<br />
by the data for sediment microorganisms from Primary<br />
Platform P1 collected during Cruise I (Table 43) .<br />
Comparisons using fresh and frozen samples produced<br />
similar (insignificant) rates <strong>of</strong> denitrification .<br />
!1 . Sulfate Reduction<br />
Forty composite samples prepared from primary<br />
platform and control site sediments were examined<br />
for sulfate reduction . Most <strong>of</strong> the samples did not<br />
demonstrate detectable sulfate reduction activity, with<br />
the possible exception <strong>of</strong> the lOX OIL sample from replicate<br />
2 Control Site C22 collected during Cruise I, and<br />
the lOX OIL and 1X OIL samples from replicates 1 and<br />
2 Primary Platform P2 collected during Cruise II (Table<br />
44) . Comparisons using fresh and frozen samples produced<br />
similar (insignificant) rates <strong>of</strong> sulfate reduction .<br />
12. Sulfur Oxidation<br />
Forty composite samples prepared from primary<br />
platform and control site sediments were examined<br />
for the occurrence and magnitude <strong>of</strong> sulfur oxidation<br />
. Valid results were obtained only from samples<br />
taken during Cruises II and III . Samples demonstrated<br />
significant sulfur oxidation activity as exemplified by<br />
the data from sediment microorganisms from Primary<br />
Platform P1 (Table 45) . Analysis <strong>of</strong> this data revealed<br />
that at least three patterns in production <strong>of</strong> water-soluble<br />
;SS could be observed (Fig . 24) : (1) rapid production <strong>of</strong><br />
water-soluble 3SS in samples t oil (Cruise II, Platform<br />
P4), (2) delayed production <strong>of</strong> water-soluble 33S in samples<br />
+ lOX OIL (Cruise II, Control Site C22), (3) delayed<br />
production <strong>of</strong> water-soluble 3SS in samples + 1X<br />
or IOX OIL (Cruise III, Platform P4) . Comparisons<br />
using fresh and frozen samples produced similar rates <strong>of</strong><br />
sulfur oxidation .<br />
13. Photosynthesis<br />
Forty-eight composite samples prepared from<br />
primary platform and control site sediments were examined<br />
,for photosynthesis . None <strong>of</strong> the samples demonstrated<br />
detectable photosynthetic activity, as shown by<br />
the data in Table 46 .<br />
14. HeterotrophicActivity<br />
Forty-eight composite samples prepared from<br />
primary platform and control site sediments were examined<br />
for heterotrophic activity . Most <strong>of</strong> the samples<br />
demonstrated rapid glucose degradation, as shown by<br />
the data for sediment microorganisms from Cruises I,<br />
II, and III (Tables 47-49, Fig . 25) .<br />
170
8000<br />
6000<br />
m<br />
o 4000<br />
200<br />
50 100<br />
Hours<br />
FIG .<br />
21 . Oxygen consumption and carbon dioxide production by Flavo6acterium sp 1 during the metabolism<br />
<strong>of</strong> Empire Mix crude oil .<br />
171
4DOO<br />
sN<br />
N<br />
m<br />
r<br />
"O<br />
V<br />
1000<br />
500<br />
50 100<br />
Hours<br />
FIG. 22 . Oxygen consumption and carbon dioxide production by Pseudomonas sp 2 during the metabolism<br />
<strong>of</strong> Empire Mix crude oil .<br />
172
3000<br />
2000<br />
m<br />
r<br />
V<br />
2<br />
1000<br />
50 100<br />
I Du<br />
Hours<br />
FIG . 23 . Oxygen consumption and carbon dioxide production by Flavo6acterium sp 2 during the metabolism<br />
<strong>of</strong> Empire Mix crude oil .<br />
173
TABLE 41 . Concentrations <strong>of</strong> NH4-N, N03-N, and N02-N in systems<br />
inoculated with sediment from Primary Platform 1 collected during<br />
Cruise I and tested for nitrification<br />
Incubation Form <strong>of</strong> Concentration N/ml sediment<br />
Time weeks Nitrogen Testy Controls IX oil I OX oil<br />
0 NH4-N 12000 12000 12000 13000<br />
N03-N 17 17 16 16<br />
N02-N 890 890 870 750<br />
1 NH4 _N 14000 12000 14000 13000<br />
N03-N 17 16 16 17<br />
N02 -N 320 320 320 320<br />
2 NH4-N 14000 12000 12000 12000<br />
N03-N 17 21 17 19<br />
N02 -N 20 400 200 99<br />
3 NH4-N 11000 12000 13000 12000<br />
N03-N 22 20 22 22<br />
NO -N 20 750 20 1600<br />
Zero time "Test" and "Control" values obtained from the same reaction vessel<br />
TABLE 42. Concentration <strong>of</strong> nitrogen (N2) in test, control,<br />
and oil-supplemented systems inoculated with sediment<br />
from Primary Platform 1 collected during Cruise I<br />
and tested for nitrogen fixation<br />
Incubation ~ Concentration <strong>of</strong> NZ (fig/ml sediment)<br />
Time (weeks) Test I Control 1X oil l OX oil<br />
0 22 22 22 22<br />
1 19 18 IS 18<br />
2 22 20 20 20<br />
3 22 20 20 21<br />
TABLE 43 . Concentration <strong>of</strong> nitrogen (N2) in systems inoculated<br />
with sediment from Primary Platform 1 collected<br />
during Cruise I and tested for denitrification<br />
Incubation ~ Concentration <strong>of</strong> NZ (fig/ml sediment)<br />
Time (weeks) Test Control 1 X oil l OX oil<br />
0 18 18 18 17<br />
1 19 19 17 19<br />
2 21 21 20 21<br />
3 23 21 20 21<br />
174
TABLE 44 . Concentrations <strong>of</strong> insoluble (I) and soluble (S) 33S in test,<br />
control, and oil-supplemented systems inoculated with sediment<br />
and tested for sulfate reduction<br />
lnoculum Incubation Form Concentration <strong>of</strong> 33S (Kg/ml sediment)<br />
Site Cruise Replicate Time (weeks) <strong>of</strong> 3sS Testy Controls 1X oil lox oil<br />
C22 I 2 0 I 11 11 7 14<br />
S 4496 4496 4500 4493<br />
1 I 25 3 4 13<br />
S 4482 4504 4503 4994<br />
2 I 5 U 7 23<br />
S 4501 4507 4500 4484<br />
3 I 2 3 21 39<br />
S 4505 4504 4486 4468<br />
P2 II 1 0 I 312 312 377 223<br />
S 5322 5322 5257 5411<br />
1 I 237 314 337 391<br />
S 5397 5320 5297 5243<br />
2 I 177 310 101 419<br />
S 5457 5324 5533 5214<br />
3 I 378 471 353 714<br />
S 5256 5163 5281 4920<br />
P2 II 2 0 I 4415 4415 249 2891<br />
S 1219 1219 5385 2743<br />
1 I 3116 673 436 382<br />
S 2518 4961 5198 5252<br />
2 I 283 378 424 382<br />
S 5351 5296 5210 5252<br />
3 I 480 1286 922 423<br />
S 5154 4348 4718 5211<br />
Zero Time "Test" and "Control" values obtained from one reaction vessel per replicate<br />
175
TABLE 45 . Concentrations <strong>of</strong> insoluble (I) and soluble (S) 3SS in test,<br />
control, and oil-supplemented systems inoculated with sediment from<br />
replicate 1, Primary Platform 1, and tested for sulfur oxidation<br />
Incubation Form <strong>of</strong> Concentration <strong>of</strong> 35S (Ng/ml sediment)<br />
Cruise Time (weeks) 35S Testy Controls 1X oil l OX oil<br />
II 0 I 18159 18159 21455 20799<br />
S 6841 6841 3545 4201<br />
1 I 1214 22799 11033 3727<br />
S 23786 2201 13967 21273<br />
2 I 614 17408 1677 3691<br />
S 24386 7592 23323 21309<br />
3 I 9555 17897 325 277<br />
S 15445 1703 24675 24723<br />
III 0 I 24319 24319 24525 24530<br />
S 681 681 475 470<br />
1 I 23935 24826 21317 24182<br />
S 1065 174 3683 818<br />
2 I 9905 24610 12558 11352<br />
S 15095 390 12442 13648<br />
3 I 5751 24410 11880 14105<br />
S 19249 590 13120 10895<br />
Zero time "Test" and "Control" values obtained from one reaction vessel per replicate<br />
TABLE 46 . Change in dissolved oxygen concentration (DO) in systems<br />
inoculated with sediment collected during Cruise I and tested for<br />
photosynthesis (PP) and metabolic activity (MA)<br />
Change in DO /ml sediment<br />
Test Co ntrol 1X oil l OX oil<br />
Site Replicate PP MA PP MA PP MA PP MA<br />
P1 1 + 6 -42 0 -30 + 6 -30 -6 -18<br />
2 -36 -54 0 -54 0 -48 0 -48<br />
P2 1 -45 -90 0 -48 -48 -84 -72 -48<br />
2 -36 -72 +60 -42 -33 -69 -45 -66<br />
P3 1 0 -24 0 -18 0 -24 0 -24<br />
2 + 6 -24 0 -18 + 6 -24 + 6 -24<br />
P4 1 +12 -57 -6 -39 3 -48 -6 -39<br />
2 +12 -60 -48 0 +12 -66 -6 -60<br />
C21 1 -6 -54 0 0 -27 -48 -12 -54<br />
2 0 -36 0 0 -6 -36 0 -30<br />
C22 1 -6 -42 0 -24 -27 -12 -12 -42<br />
2 -9 -54 +18 -54 -6 -42 0 -30<br />
C23 1 + 6 -30 -6 -24 -6 -24 0 -24<br />
2 0 -36 0 -36 0 -36 0 -36<br />
C24 1 + 6 -30 0 -30 + 3 -30 -6 -18<br />
2 0 -33 + 3 -39 0 -36 + 3 -36<br />
z<br />
z<br />
Control<br />
Sites -1 -39 + 2 -38 + 5 -33 -33 -36<br />
Platform<br />
Sites -10 -53 -6 -31 + 8 -49 -16 -41<br />
176
Cruise II Cruise II Cruise III<br />
c<br />
m<br />
E<br />
E<br />
m<br />
a<br />
i<br />
Incubation Time (Weeks)<br />
FIG. ?a . Concentrations <strong>of</strong> water-soluble 3sS at works 0, 1, 2, and 3 in Test (D), Control (D), lXOil (o),<br />
and lOxOil (") inoculated with sediment microorganisms from platforms and controls<br />
177
TABLE 47 . COZ produced from glucose (expressed as percent C02-C/Total C)<br />
in systems inoculated with sediment collected during Cruise I<br />
and tested for heterotrophic activity<br />
Incubation<br />
Percent CO, Produced<br />
Time T esty Controls 1X oil l OX oil<br />
Site (days ) 12 2 1 2 1 2 1 2<br />
PI 0 0 0 0 0 0 0 0 0<br />
2 6 3 0 0 6 5 4 3<br />
4 14 11 0 1 17 11 17 13<br />
6 18 16 1 2 16 13 17 15<br />
C21 0 0 0 0 0 0 0 0 0<br />
2 1 1 0 1 1 1 1 1<br />
4 10 8 0 0 13 9 6 6<br />
6 12 8 0 0 12 11 6 11<br />
P2 0 0 2 0 2 0 0 0 0<br />
2 17 20 0 0 14 16 11 16<br />
4 12 7 0 0 14 10 14 10<br />
6 15 16 0 0 13 12 10 13<br />
C22 0 0 0 0 0 0 0 0 0<br />
2 1 6 0 5 2 5 2 3<br />
4 9 10 0 0 13 9 12 7<br />
6 10 14 0 0 12 11 11 9<br />
P3 0 0 2 0 2 2 0 0 1<br />
2 17 0 0 0 21 6 19 10<br />
4 10 9 0 0 15 14 15 12<br />
6 13 9 0 0 10 9 17 17<br />
C23 0 0 0 0 0 0 0 0 0<br />
2 3 4 0 0 3 3 2 3<br />
4 12 0 0 0 12 13 12 12<br />
6 13 8 0 0 11 10 11 9<br />
P4 0 0 0 0 0 1 1 0 0<br />
2 21 4 0 0 17 12 14 8<br />
4 12 10 0 0 12 8 13 10<br />
6 16 11 0 0 13 14 15 12<br />
C24 0 0 0 0 0 1 0 0 0<br />
2 4 3 0 0 3 4 3 3<br />
4 12 13 0 1 13 12 10 14<br />
6 12 14 0 0 14 8 14 13<br />
Zero time "Test" and "Control" values obtained from one reaction vessel per replicate<br />
ZReplicate<br />
178
TABLE 48 . COZ produced from glucose (expressed as percent C02-C/Total C)<br />
in systems inoculated with sediment collected during Cruise II<br />
and tested for heterotrophic activity<br />
Incubation<br />
Percent COZ Produced<br />
Time Testy Controls IX oil l OX oil<br />
Site (days ) 12 2 1 2 1 2 1 2<br />
P1 0 0 0 0 0 0 0 0 0<br />
1 0 0 0 0 0 0 0 6<br />
3 1 2 0 0 S 2 4 2<br />
5 13 7 0 0 11 9 15 10<br />
C21 0 1 0 1 0 0 0 0 0<br />
1 1 0 0 0 0 0 0 0<br />
3 S 2 0 0 1 2 2 2<br />
5 12 13 0 0 6 12 8 12<br />
P2 0 0 0 0 0 0 0 0 0<br />
1 0 0 0 0 0 0 0 0<br />
3 1 0 0 0 1 0 0 0<br />
5 2 1 0 0 4 2 S 3<br />
C22 0 2 0 2 0 1 0 0 0<br />
1 3 3 1 0 2 3 3 3<br />
3 2 3 2 0 3 4 4 3<br />
5 9 17 3 0 7 11 10 12<br />
P3 0 0 0 0 0 0 0 0 0<br />
1 0 0 0 0 0 0 0 0<br />
3 0 1 0 0 0 1 0 1<br />
5 3 4 0 0 2 6 3 5<br />
C23 0 0 0 0 0 0 0 0 0<br />
1 0 0 0 0 0 0 0 0<br />
3 2 2 0 0 3 2 2 2<br />
5 5 10 0 0 8 9 11 11<br />
P4 0 0 0 0 0 0 0 0 0<br />
1 0 0 0 0 0 0 0 0<br />
3 0 2 0 0 1 1 1 1<br />
5 9 10 0 0 11 9 12 10<br />
C24 0 0 1 0 1 0 0 0 0<br />
1 0 1 0 0 0 0 0 0<br />
3 0 7 6 0 0 6 0 2<br />
S 3 5 0 0 5 5 3 16<br />
Zero time "Test" and "Control" values obtained from one reaction vessel per replicate<br />
ZReplicate<br />
179
TABLE 49 . COZ produced from glucose (expressed as percent C02-C/Total C)<br />
in systems inoculated with sediment collected during Cruise III<br />
and tested for heterotrophic activity<br />
Incubation<br />
Percent COZ Produced<br />
Time Testy Controls 1X oil l OX oil<br />
Site (days ) 12 2 1 2 1 2 1 2<br />
P1 0 0 0 0 0 0 0 0 0<br />
1 6 5 0 0 7 6 7 6<br />
3 10 11 0 0 8 8 11 8<br />
5 13 9 0 0 16 14 17 10<br />
C21 0 0 0 0 0 0 0 0 0<br />
1 5 5 0 0 4 6 4 5<br />
3 11 8 0 0 8 9 8 8<br />
5 9 9 0 0 14 16 10 11<br />
P2 0 0 0 0 0 0 0 0 0<br />
1 9 10 0 0 10 7 9 10<br />
3 12 14 0 0 12 16 16 15<br />
5 32 30 0 0 30 28 30 26<br />
C22 0 0 0 0 0 0 0 0 0<br />
1 5 7 0 0 5 6 5 6<br />
3 8 10 0 0 7 8 8 7<br />
5 14 14 0 0 12 11 10 12<br />
P3 0 0 0 0 0 0 0 0 0<br />
1 1 1 0 0 1 1 1 2<br />
3 1 2 0 0 1 1 1 1<br />
5 2 4 0 0 2 5 2 4<br />
C23 0 0 0 0 0 0 0 0 0<br />
1 0 1 0 0 2 1 3 1<br />
3 4 4 0 0 4 5 4 6<br />
5 13 31 0 0 12 30 8 17<br />
P4 0 0 0 0 0 0 0 0 0<br />
1 5 3 0 0 6 2 6 2<br />
3 11 4 0 0 10 5 12 7<br />
5 32 30 0 0 28 14 25 16<br />
C24 0 0 0 0 0 0 0 0 0<br />
1 5 3 0 0 4 2 5 2<br />
3 7 8 0 0 6 7 8 4<br />
5 31 29 0 0 32 30 28 25<br />
Zero time "Test" and "Control" values obtained from one reaction vessel per replicate<br />
ZReplicate<br />
180
Cruise I Cruise II Cruise 111 0<br />
2<br />
0<br />
V<br />
7<br />
U<br />
O<br />
w<br />
v<br />
0<br />
a<br />
N<br />
:.<br />
c<br />
m<br />
V<br />
m<br />
a<br />
0 2 4 6 0 1 3 5 0 1 ~3 5<br />
Incubation Time (Days)<br />
FIG. 25 . Percent 14 C02 produced from 1'C-glucose by Platform 2 sediment microorganisms collected<br />
during Cruises I, II, and III .<br />
181
IS. Phosphorus Uptake<br />
Forty composite samples prepared from primary<br />
platform and control site sediments were examined<br />
for phosphorus uptake . None <strong>of</strong> the samples demonstrated<br />
detectable phosphorus uptake activity, as<br />
exemplified by the data for sediment microorganisms<br />
from Primary Platform P1 collected during Cruise I<br />
(Table 50) . Comparisons using fresh and frozen samples<br />
produced similar (insignificant) rates <strong>of</strong> phosphorus<br />
uptake) .<br />
16. Lipolysis<br />
Forty-eight composite samples prepared from<br />
primary platform and control site sediments were examined<br />
for lipolytic activity . Most <strong>of</strong> the samples demonstrated<br />
detectable lipolytic activity, as shown by the data<br />
for sediment microorganisms from Cruises I, II, and III<br />
(Tables 51-53) .<br />
17. Chitinolysis<br />
Forty-eight composite samples prepared from<br />
primary platform and control site sediments were examined<br />
for chitinolytic activity . Most <strong>of</strong> the samples demonstrated<br />
detectable chitinolysis, as exemplified by the<br />
data in Tables 54-56 . Rate and/or yield <strong>of</strong> COZ production<br />
was <strong>of</strong>ten higher in test systems <strong>of</strong> sediments<br />
(from both platforms and control sites) than in oilsupplemented<br />
systems (Fig . 26) .<br />
18. Ce/lulolysis<br />
Forty-eight composite samples prepared from<br />
primary platform and control site sediments were examined<br />
for cellulolytic activity . Most <strong>of</strong> the samples demonstrated<br />
detectable cellulolysis, as exemplified by the<br />
data for sediment microorganisms from Cruises I, II,<br />
and III (Tables 57-59) .<br />
19. Proteolysis<br />
Forty-eight composite samples prepared from<br />
primary platform and control site sediments were examined<br />
for proteolytic activity . Most <strong>of</strong> the samples demonstrated<br />
significant proteolytic activity as exemplified<br />
by the data for sediment microorganisms from Cruises<br />
I, II, and III (Tables 60-62) .<br />
B. Pure Culture Studies<br />
Neither a pure culture <strong>of</strong> Nitrosomonas europa nor a<br />
nitrifying enrichment culture used to measure the effects<br />
<strong>of</strong> oil on nitrification exhibited nitrification in the presence<br />
<strong>of</strong> Empire Mix crude oil .<br />
A pure culture <strong>of</strong> Nostoc muscorum used to measure<br />
the effects <strong>of</strong> oil on photosynthesis exhibited similar<br />
rates <strong>of</strong> photosynthesis in the presence and absence <strong>of</strong><br />
Empire Mix crude oil (Table 63) .<br />
Two pure cultures <strong>of</strong> Pseudomonas used to measure<br />
the effects <strong>of</strong> oil on proteolysis exhibited similar rates<br />
and yields <strong>of</strong> COZ production in the presence and absence<br />
<strong>of</strong> Empire Mix crude oil (Fig . 27) .<br />
A pure culture <strong>of</strong> Enterobacter used to measure the<br />
effects <strong>of</strong> oil on glucose oxidation exhibited similar rates<br />
<strong>of</strong> COZ production in the presence and absence <strong>of</strong><br />
Empire Mix crude oil (Fig. 28) .<br />
Two pure cultures <strong>of</strong> Cellulomonas used to measure<br />
effects <strong>of</strong> oil on cellulose oxidation exhibited similar<br />
rates <strong>of</strong> COZ production after 5 to 10 days <strong>of</strong> incubation<br />
in the presence and absence <strong>of</strong> Empire Mix crude oil<br />
(Fig . 29) .<br />
A pure culture <strong>of</strong> Pseudomonas used to measure effects<br />
<strong>of</strong> oil on lipolysis exhibited similar rates <strong>of</strong> COZ<br />
production after 10 days <strong>of</strong> incubation in the presence<br />
and absence <strong>of</strong> Empire Mix crude oil (Fig . 30) .<br />
A pure culture <strong>of</strong> Pseudomonas used to measure effects<br />
<strong>of</strong> oil on chitin hydrolysis exhibited similar rates <strong>of</strong><br />
COZ production in the presence and absence <strong>of</strong> Empire<br />
Mix crude oil (Fig . 31) .<br />
TABLE 50 . Concentrations <strong>of</strong> insoluble (I) and soluble (S) 32P in systems<br />
inoculated with sediment collected from Primary Platform 1<br />
during Cruise I and tested for phosphate uptake<br />
Incubation Form <strong>of</strong> Concentration <strong>of</strong> 32P (fig/ml sediment)<br />
Time (days) 32P Testy Controls 1X oil lox oil<br />
0 I 42 42 39 35<br />
S 6300 6300 6300 6300<br />
S I 53 66 46 45<br />
S 6300 6300 6300 6300<br />
10 I 66 66 53 36<br />
S 6300 6300 6300 6300<br />
15 I 24 23 36 29<br />
S 6300 6300 6300 6300<br />
Zero time "Test" and "Control" values obtained from one reaction vessel per replicate<br />
182
TABLE S 1 . COZ produced from tripalmitin (expressed as percent C02-C/Total C)<br />
in systems inoculated with sediment collected during Cruise I<br />
and tested for lipolysis<br />
Incubation<br />
Percent COZ Produced<br />
Time Testy Controls 1X oil lox oil<br />
Site weeks 12 2 1 2 1 2 1 2<br />
P1 0 0 0 0 0 0 0 0 2<br />
1 14 5 0 0 10 36 21 8<br />
2 0 0 0 0 2 7 7 1<br />
3 2 1 0 0 10 1 13 24<br />
P2 0 0 0 0 0 0 1 0 1<br />
1 1 0 2 0 0 0 0 0<br />
2 1 4 1 5 2 0 1 5<br />
3 1 0 0 0 1 8 3 1<br />
P3 0 0 0 0 0 0 0 0 0<br />
1 0 0 0 0 0 1 0 0<br />
2 1 2 2 1 3 3 0 2<br />
3 0 1 1 0 0 0 2 1<br />
P4 0 1 1 1 1 0 0 1 1<br />
1 4 0 2 1 0 0 1 0<br />
2 0 1 0 1 4 0 5 3<br />
3 0 1 0 3 1 5 1 3<br />
C21 0 0 2 0 2 0 2 0 2<br />
1 16 2 0 0 3 4 1 3<br />
2 0 8 1 8 0 2 0 0<br />
3 7 1 0 4 7 8 3 15<br />
C22 0 0 0 0 0 1 0 0 6<br />
1 9 7 0 0 0 2 6 5<br />
2 0 0 0 1 0 1 2 3<br />
3 0 0 3 1 5 4 5 5<br />
C23 0 0 0 0 0 4 0 0 0<br />
1 11 1 0 0 4 15 11 4<br />
2 0 3 0 0 1 2 0 6<br />
3 1 3 0 0 3 33 7 9<br />
C24 0 1 0 1 0 1 1 0 0<br />
1 3 5 0 0 12 9 6 9<br />
2 2 0 0 1 1 3 6 4<br />
3 2 0 0 1 7 14 12 14<br />
Zero time "Test" and "Control" values obtained from one reaction vessel per replicate<br />
ZReplicate<br />
183
TABLE 52 . COZ produced from tripalmitin (expressed as percent C02-GTotal C)<br />
in systems inoculated with sediment collected during Cruise II<br />
and tested for lipolysis<br />
Incubation<br />
Percent COZ Produced<br />
Time Testy Controls 1X Oil lox Oil<br />
Site weeks 12 2 1 2 1 2 1 2<br />
P1 0 0 0 0 0 0 0 0 0<br />
1 6 3 0 0 2 2 0 9<br />
2 10 21 0 0 60 0 0 0<br />
3 18 21 1 1 11 15 21 28<br />
P2 0 0 0 0 0 0 0 0 0<br />
1 2 0 0 1 2 1 0 0<br />
2 1 2 0 0 0 3 1 0<br />
3 5 6 3 4 16 2 21 4<br />
P3 0 0 0 0 0 0 0 0 0<br />
1 0 1 0 0 1 2 1 2<br />
2 1 0 0 1 1 2 2 0<br />
3 9 4 0 0 3 3 17 1<br />
P4 0 0 0 0 0 0 0 0 0<br />
1 2 3 0 0 1 4 3 4<br />
2 1 9 0 0 0 2 1 2<br />
3 7 4 1 0 14 19 10 10<br />
C21 0 0 0 0 0 0 0 0 0<br />
1 14 1 0 0 3 0 2 8<br />
2 9 14 0 0 2 5 8 11<br />
3 32 28 3 2 5 2 14 17<br />
C22 0 0 0 0 0 1 0 0 0<br />
1 3 9 7 0 3 3 5 7<br />
2 9 9 4 2 9 5 25 13<br />
3 16 3 10 0 24 15 23 25<br />
C23 0 0 0 0 0 0 0 0 0<br />
1 13 0 0 0 0 1 0 0<br />
2 1 1 0 0 2 0 1 10<br />
3 15 22 1 1 13 32 31 19<br />
C24 0 0 0 0 0 0 0 0 0<br />
1 3 2 0 0 5 2 2 3<br />
2 3 9 0 0 3 1 10 4<br />
3 8 11 0 0 9 15 22 22<br />
Zero time "Test" and "Control" values obtained from one reaction vessel per replicate<br />
ZReplicate<br />
184
TABLE 53 . COZ produced from tripalmitin (expressed as percent C02-C/Total C)<br />
in systems inoculated with sediment collected during Cruise III<br />
and tested for lipolysis<br />
Incubation<br />
Percent COZ Produced<br />
Time Testy Controls 1X oil l OX oil<br />
Site weeks 1 2 2 1 2 1 2 1 2<br />
P1 0 0 0 0 0 0 0 0 0<br />
1 S 3 0 0 5 3 3 6<br />
2 2 3 0 0 1 5 0 4<br />
3 9 9 0 0 8 9 11 15<br />
P2 0 0 0 0 0 0 0 0 0<br />
1 3 3 0 0 2 2 3 2<br />
2 3 6 0 0 2 3 1 2<br />
3 5 7 0 0 4 5 5 4<br />
P3 0 0 0 0 0 0 0 0 0<br />
1 6 6 0 0 3 1 1 5<br />
2 8 5 0 0 3 4 1 0<br />
3 5 7 0 0 8 7 2 5<br />
0 0 0 0 0 0 0 0 0<br />
P4 1 5 5 1 0 1 2 4 3<br />
2 5 6 0 0 4 4 2 3<br />
3 5 9 1 0 5 8 10 19<br />
C21 0 0 0 0 0 0 0 0 0<br />
1 3 3 1 1 4 2 4 4<br />
2 5 7 0 0 6 8 3 3<br />
3 11 12 0 0 6 7 7 10<br />
C22 0 0 0 0 0 0 0 0 0<br />
1 5 3 0 1 5 2 4 1<br />
2 6 4 0 0 9 5 3 3<br />
3 15 6 0 0 8 9 16 10<br />
C23 0 0 0 0 0 0 0 0 0<br />
1 6 4 0 0 6 4 12 6<br />
2 11 7 0 0 7 7 8 9<br />
3 17 7 0 1 16 13 14 23<br />
C24 0 0 0 0 0 0 0 0 0<br />
1 2 5 0 0 3 3 3 4<br />
2 6 6 0 0 9 5 4 7<br />
3 9 11 0 0 10 25 23 18<br />
Zero time "Test" and "Control" values obtained from one reaction vessel per replicate<br />
ZReplicate<br />
185
TABLE 54 . Quantity <strong>of</strong> COZ produced from chitin in systems<br />
inoculated with sediment from Cruise I<br />
Incubation<br />
COz Produced (kg C02/Ml sediment)<br />
Time Test Control IX oil<br />
Site weeks 1 1 2 1 2 1 2 1 2<br />
PI 0 31 31 31 31 31 31 31 31<br />
1 3300 2800 120 120 3000 3100 2700 2800<br />
2 4400 3300 150 120 2900 3100 3400 3900<br />
3 4900 5600 220 150 1700 2800 2800 2800<br />
P2 0 31 31 31 31 31 31 31 31<br />
1 930 1000 120 120 1400 770 990 590<br />
2 1000 990 150 120 1100 1500 1100 650<br />
3 4200 2800 220 220 1800 1700 1700 1300<br />
P3 0 31 31 31 31 31 31 31 31<br />
1 1300 1400 62 62 770 1200 930 1000<br />
2 1800 1800 62 62 1600 1800 1200 990<br />
3 2800 2800 120 120 1300 1500 1800 1400<br />
P4 0 31 31 31 31 31 31 31 31<br />
1 1300 930 120 62 1300 710 890 650<br />
2 1800 1500 120 62 930 1200 930 930<br />
3 4000 2800 150 120 1300 2200 2000 1200<br />
C21 0 31 31 31 31 31 31 31 31<br />
1 560 710 120 62 1800 2300 2300 1200<br />
2 5200 3100 150 120 1300 1900 5100 1800<br />
3 4800 4800 150 120 1800 2200 2400 1600<br />
C22 0 31 31 31 31 31 31 31 31<br />
1 2200 2300 62 150 2900 2000 2300 2300<br />
2 3600 3500 150 150 2700 2000 2800 2100<br />
3 4900 4300 150 220 280 1500 1900 2800<br />
C23 0 31 31 31 31 31 31 31 31<br />
1 1700 1700 62 62 1300 2200 1800 1300<br />
2 3300 3500 62 62 1500 1500 2300 1500<br />
3 4100 4200 120 62 1800 2000 2100 2300<br />
C24 0 31 31 31 31 31 31 31 31<br />
1 1700 3300 120 120 1600 2400 1700 2000<br />
2 3500 3100 120 150 1500 2600 1800 2600<br />
3 4700 5400 120 120 1000 2100 2200 2800<br />
Replicates<br />
186
TABLE SS . Quantity <strong>of</strong> COZ produced from chitin in systems<br />
inoculated with sediment from Cruise II<br />
Incubation<br />
COZ Produced (Ng C02/ml sediment)<br />
Time Test Control 1X oil l OX oil<br />
Site weeks 1 1 2 1 2 1 2 1 2<br />
P1 0 69 69 69 69 69 69 69 69<br />
1 620 550 140 140 760 690 620 690<br />
2 7300 1600 210 210 1800 1100 1400 1800<br />
3 2600 2200 280 210 2800 1700 2100 1700<br />
P2 0 69 69 140 69 69 69 140 140<br />
1 410 340 210 140 690 410 550 410<br />
2 1900 1100 280 140 1900 830 830 5900<br />
3 5700 2100 280 210 830 2100 2000 2200<br />
P3 0 69 69 69 69 69 69 69 69<br />
1 480 3700 69 140 280 1400 480 2500<br />
2 1500 8900 140 140 280 5000 690 2800<br />
3 3600 11000 69 210 2500 760 1700 11000<br />
P4 0 69 69 69 69 69 69 69 69<br />
1 690 550 69 69 550 1000 480 1300<br />
2 7000 3000 140 140 4900 5700 1500 3400<br />
3 3600 7000 140 140 1700 5500 2200 3700<br />
C21 0 69 69 69 69 69 69 140 140<br />
1 690 1000 140 140 620 690 620 1000<br />
2 1600 210 140 210 1700 1900 1700 1900<br />
3 2700 2100 140 140 2100 2000 3000 3400<br />
C22 0 900 620 210 210 210 210 210 210<br />
1 830 830 210 280 1200 1000 1200 1200<br />
2 2800 1100 210 280 3400 5100 5000 1900<br />
3 2300 1100 280 210 1200 8300 2800 4000<br />
C23 0 69 69 69 69 69 69 69 69<br />
1 1400 2200 69 0 340 620 2100 830<br />
2 5600 5500 140 140 3900 5500 2300 5900<br />
3 9000 7800 69 140 8300 5600 4900 8600<br />
C24 0 3500 1800 140 140 140 140 69 140<br />
1 1600 760 140 140 830 1000 830 1200<br />
2 3300 3700 140 69 5200 2600 7700 3400<br />
3 8000 5400 140 140 8600 3000 4800 3100<br />
Replicates<br />
187
TABLE 56 . Quantity <strong>of</strong> COZ produced from chitin in systems<br />
inoculated with sediment from Cruise III<br />
Incubation<br />
COZ Produced (fig/CO2/ml sediment)<br />
Time Test Control 1X oil lox oil<br />
Site (weeks ) 1 1 2 1 2 1 2 1 2<br />
P1 0 69 410 69 69 69 69 69 69<br />
1 1600 620 69 69 2400 830 1800 620<br />
2 2400 140 69 69 2200 1900 1700 1900<br />
3 2300 210 69 69 3900 3200 2900 1700<br />
P2 0 340 550 140 69 140 210 140 280<br />
1 1700 340 210 140 620 1200 1200 480<br />
2 900 690 140 69 620 3900 1400 1300<br />
3 1600 1700 140 69 1700 550 4300 1200<br />
P3 0 210 410 69 69 69 69 69 69<br />
1 410 69 69 69 620 900 340 480<br />
2 970 1000 69 69 620 1400 1400 620<br />
3 1000 1800 69 69 1400 4000 2700 4100<br />
P4 0 280 550 69 69 69 69 69 69<br />
1 140 410 69 140 140 69 340 140<br />
2 620 620 69 69 690 550 900 830<br />
3 1200 3900 69 140 1100 1400 1900 1200<br />
C21 0 1000 760 140 69 69 69 69 69<br />
1 1700 1600 140 69 1400 1700 1100 1600<br />
2 3200 1700 140 69 3100 2300 5500 5500<br />
3 4500 550 210 69 3200 1800 7400 4600<br />
C22 0 140 690 69 69 140 69 69 140<br />
1 1200 280 140 140 1200 1700 2500 620<br />
2 1400 620 69 69 690 1200 2700 1200<br />
3 1500 2100 69 140 1000 1500 2900 2600<br />
C23 0 140 69 69 69 69 69 69 69<br />
1 2800 280 69 69 69 140 140 1200<br />
2 410 760 69 69 280 280 340 340<br />
3 690 690 3400 69 69 1700 1000 620<br />
C24 0 69 2200 2100 69 1900 69 69 2600<br />
1 2700 3200 210 69 69 2100 2100 4800<br />
2 3300 2000 69 69 2200 4500 2300 480<br />
3 3000 1000 69 69 1900 4200 1800 1700<br />
Replicate<br />
188
50<br />
0<br />
Platform 1<br />
40<br />
0<br />
f<br />
30<br />
8<br />
zo<br />
o<br />
.~<br />
10<br />
m<br />
N<br />
0<br />
o -<br />
_ a<br />
G<br />
N<br />
0<br />
U<br />
0<br />
Control 21<br />
O<br />
30<br />
ZO<br />
0 0<br />
t<br />
1<br />
0<br />
0<br />
p<br />
O<br />
0<br />
1 2<br />
Incubation Time (Weeks)<br />
3<br />
FIG. 26 . Production <strong>of</strong> COZ from chitin in Test ( o ), Control (D), lxOil (0), and IOXOiI (+) systems.<br />
189
TABLE 57 . COZ produced from cellulose (expressed as percent C02-C/Total C)<br />
in systems inoculated with sediment collected during Cruise I<br />
Incubation<br />
Percent COZ Produced<br />
Time Tes ty Controls 1X oil l OX oil<br />
Site weeks 12 2 1 2 1 2 1 2<br />
P1 0 1 0 1 0 0 0 0 0<br />
1 4 1 2 1 3 0 0 0<br />
2 4 0 10 0 3 0 0 4<br />
3 8 3 3 1 12 5 33 15<br />
P2 0 1 1 1 1 0 0 30 0<br />
1 5 0 0 1 2 5 7 0<br />
2 11 10 1 0 3 0 2 6<br />
3 6 5 0 8 6 0 4 3<br />
P3 0 2 1 2 1 4 1 0 0<br />
1 5 0 4 10 2 8 8 0<br />
2 1 1 1 0 8 0 12 3<br />
3 8 9 1 14 1 10 3 1<br />
P4 0 1 0 1 0 21 0 0 0<br />
1 5 0 0 0 5 0 16 1<br />
2 15 7 0 0 1 5 8 0<br />
3 21 18 1 1 3 8 10 7<br />
C21 0 0 0 0 0 5 0 7 1<br />
1 2 0 1 0 9 4 53 0<br />
2 1 2 6 0 4 0 0 2<br />
3 0 0 7 0 0 3 1 4<br />
C22 0 0 0 0 0 9 0 2 2<br />
1 0 1 0 2 1 0 0 0<br />
2 3 0 1 1 0 7 0 0<br />
3 0 2 0 0 3 10 5 3<br />
C23 0 0 3 0 3 0 0 0 0<br />
1 0 0 1 0 1 0 4 7<br />
2 3 3 0 0 0 0 0 0<br />
3 1 4 2 0 7 4 14 4<br />
C24 0 3 0 3 0 0 0 1 1<br />
1 19 0 2 0 I 12 0 0<br />
2 1 0 2 2 1 0 0 0<br />
3 2 11 7 15 13 15 28 18<br />
Zero time "Test" and "Control" values obtained from one reaction vessel per replicate<br />
;<br />
Replicate<br />
190
TABLE 58 . COZ produced from cellulose (expressed as percent C02-C/Total C)<br />
in systems inoculated with sediment collected during Cruise II<br />
Incubation<br />
Percent COZ Produced<br />
Time Tes ty Controls 1X oil lox oil<br />
Site weeks 12 2 1 2 1 2 1 2<br />
P1 0 0 0 0 0 0 0 0 0<br />
1 3 1 0 0 1 1 4 3<br />
2 5 2 1 0 3 5 4 4<br />
3 11 13 1 3 16 11 9 13<br />
P2 0 0 0 0 0 0 0 0 0<br />
1 1 1 0 0 0 1 1 1<br />
2 4 3 2 1 2 1 1 1<br />
3 7 4 1 1 6 4 6 4<br />
P3 0 0 0 0 0 0 0 0 0<br />
1 0 1 0 0 0 2 1 1<br />
2 2 4 1 1 4 1 1 0<br />
3 4 5 2 1 2 4 4 2<br />
P4 0 0 0 0 0 0 0 0 0<br />
1 1 1 1 0 1 1 3 2<br />
2 3 2 2 1 3 2 2 5<br />
3 11 7 1 1 8 3 S 8<br />
C21 0 0 0 0 0 0 0 0 0<br />
1 1 2 0 0 1 1 3 4<br />
2 1 1 1 1 2 2 1 2<br />
3 11 7 2 3 10 8 15 12<br />
C22 0 1 1 1 1 1 2 2 1<br />
1 5 4 1 3 4 7 4 6<br />
2 5 4 1 1 1 5 6 3<br />
3 12 11 2 2 12 11 4 9<br />
C23 0 0 0 0 0 0 0 0 0<br />
1 0 1 0 0 1 3 1 2<br />
2 4 4 1 0 1 3 2 1<br />
3 7 5 1 1 6 8 11 8<br />
C24 0 1 0 1 0 1 0 1 2<br />
1 4 3 1 3 2 5 6 3<br />
2 4 4 1 1 4 4 7 6<br />
3 1 7 1 1 5 5 - 8 6<br />
Zero time "Test" and "Control" values obtained from one reaction vessel per replicate<br />
ZReplicate<br />
191
TABLE 59 . COZ produced from cellulose (expressed as percent C02-C/Total C)<br />
in systems inoculated with sediment collected during Cruise III<br />
Incubation<br />
Percent COZ Produced<br />
Time Tes ty Controls 1X oil I OX oil<br />
Site weeks 1 2 2 1 2 1 2 1 2<br />
P1 0 0 0 0 0 0 1 0 0<br />
1 0 1 0 0 1 2 1 2<br />
2 8 12 0 9 9 10 6 10<br />
3 7 6 1 1 10 S 8 19<br />
P2 0 0 0 0 0 0 0 0 0<br />
1 1 1 0 0 2 1 1 4<br />
2 4 6 1 1 6 1 4 5<br />
3 3 3 0 0 4 6 4 6<br />
P3 0 0 0 0 0 0 0 0 0<br />
1 1 1 0 1 0 1 1 2<br />
2 2 3 3 0 3 1 2 2<br />
3 2 3 0 0 10 7 5 3<br />
P4 0 0 0 0 0 0 0 0 0<br />
1 2 3 1 1 1 2 2 2<br />
2 2 7 0 1 1 4 2 3<br />
3 5 3 1 0 10 4 9 S<br />
C21 0 0 0 0 0 0 0 0 0<br />
1 2 0 0 0 2 3 5 3<br />
2 7 10 1 1 14 7 6 7<br />
3 11 11 0 0 12 11 13 6<br />
C22 0 0 0 0 0 0 0 0 0<br />
1 1 2 0 0 2 4 1 3<br />
2 5 11 1 1 10 4 8 5<br />
3 5 3 0 0 12 3 5 23<br />
C23 0 0 0 0 0 0 0 0 0<br />
1 1 1 0 1 2 1 2 2<br />
2 6 5 1 1 4 3 4 6<br />
3 9 4 1 0 12 5 10 5<br />
C24 0 0 0 0 0 0 0 0 0<br />
1 1 1 1 0 1 1 3 2<br />
2 5 5 1 1 8 6 2 3<br />
3 6 1 0 0 11 3 12 4<br />
Zero time "Test" and "Control" values obtained from one reaction vessel per replicate<br />
ZReplicate<br />
192
TABLE 60 . COZ produced from bovine serum albumin (expressed as percent C02-C/Total C)<br />
in systems inoculated with sediment collected during Cruise I<br />
and tested for proteolysis<br />
Incubation<br />
Percent COZ Produced<br />
Time Testy Controls 1X oil l OX oil<br />
Site weeks 12 2 1 2 1 2 1 2<br />
P1 0 0 13 0 13 3 14 0 17<br />
1 9 26 0 19 28 1 9 29<br />
2 89 87 4 38 57 50 46 87<br />
3 51 15 2 26 78 71 54 54<br />
P2 0 3 4 3 4 8 2 14 9<br />
1 1 3 2 4 14 1 20 1<br />
2 72 69 53 27 52 49 68 56<br />
3 54 14 3 23 68 56 91 78<br />
P3 0 0 1 0 1 0 2 0 2<br />
I 5 4 1 1 6 7 2 3<br />
2 55 81 24 43 34 28 56 26<br />
3 28 27 10 11 24 61 69 56<br />
P4 0 1 1 1 1 0 0 0 3<br />
1 16 10 0 1 10 6 4 14<br />
2 26 22 30 34 32 34 35 51<br />
3 42 6 2 12 17 19 5 4<br />
C21 0 8 0 8 0 1 13 18 1<br />
1 4 66 1 55 5 2 21 4<br />
2 85 60 72 0 74 76 73 92<br />
3 98 76 89 21 86 98 69 91<br />
C22 0 2 3 2 3 4 4 0 6<br />
1 12 6 0 5 0 13 5 48<br />
2 84 57 22 3 66 82 68 0<br />
3 31 21 42 0 93 65 95 72<br />
C23 0 0 9 0 9 0 9 0 1<br />
1 17 14 1 1 28 40 41 2<br />
2 90 66 71 0 78 1 64 66<br />
3 50 6 8 4 76 57 67 85<br />
C24 0 6 28 6 28 1 4 10 0<br />
1 22 10 12 0 9 6 18 14<br />
2 42 89 54 1 52 88 85 69<br />
3 65 60 8 2 58 87 80 61<br />
Zero time "Test" and "Control" values obtained from one reaction vessel per replicate<br />
ZReplicate<br />
193
TABLE 61 . COZ produced from bovine serum albumin (expressed as percent C02-C/Total C)<br />
in systems inoculated with sediment collated during Cruise II<br />
and tested for proteolysis<br />
Incubation<br />
Percent CO Produced<br />
Time Test' Con trols 1X oil 10X oil<br />
Site weeks 12 2 1 2 1 2 1 2<br />
PI 0 5 3 5 3 0 0 0 0<br />
1 5 S 0 0 2 6 2 6<br />
2 42 56 2 24 18 43 9 16<br />
3 50 45 9 6 26 20 53 41<br />
P2 0 1 0 1 0 0 1 0 0<br />
1 1 2 0 1 1 2 1 2<br />
2 20 16 7 5 6 4 17 20<br />
3 29 16 11 4 22 20 14 8<br />
P3 0 0 0 0 0 1 1 0 0<br />
1 1 2 1 0 3 4 2 1<br />
2 16 4 2 3 6 28 18 8<br />
3 54 32 4 8 11 21 21 5<br />
P4 0 0 0 0 0' 1 0 0 0<br />
1 5 3 1 0 3 6 S 2<br />
2 31 29 5 2 36 7 10 17<br />
3 60 36 8 10 12 13 36 17<br />
C21 0 4 0 4 0 0 0 1 0<br />
1 9 2 1 2 1 3 9 5<br />
2 60 32 5 2 48 58 53 51<br />
3 49 87 38 33 79 30 88 77<br />
C22 0 24 9 24 9 19 10 23 7<br />
1 41 17 14 7 32 19 37 23<br />
2 66 45 16 11 68 28 58 50<br />
3 19 54 17 10 28 28 27 25<br />
C23 0 0 0 0 0 0 2 1 0<br />
1 1 7 1 1 3 2 7 2<br />
2 48 46 0 0 13 36 9 5<br />
3 86 70 35 8 28 57 66 65<br />
C24 0 16 6 16 6 11 10 7 8<br />
1 14 7 9 6 15 7 10 18<br />
2 49 18 4 4 35 33 25 24<br />
3 17 25 5 5 30 20 30 20<br />
Zero time "Test" and "Control" values obtained from one reaction vessel per replicate<br />
ZReplicate<br />
194
TABLE 62. COZ produced from bovine serum albumin (expressed as percent C02-C/Total C)<br />
in systems inoculated with sediment collected during Cruise III<br />
and tested for proteolysis<br />
Incubation<br />
Percent COZ Produced<br />
Time Testy Controls 1X oil lox oil<br />
Site weeks 1z 2 1 2 1 2 I 2<br />
P1 0 0 0 0 0 0 0 0 0<br />
1 4 3 2 1 5 2 5 3<br />
2 13 7 5 1 6 22 18 15<br />
3 58 41 0 0 39 37 32 49<br />
P2 0 0 0 0 0 0 0 0 0<br />
1 2 1 0 0 2 2 3 2<br />
2 5 4 0 1 12 10 11 12<br />
3 18 30 0 0 37 44 36 47<br />
P3 0 0 0 0 0 0 0 0 0<br />
1 2 2 0 0 2 1 2 1<br />
2 8 4 0 0 7 3 6 3<br />
3 25 27 0 0 20 33 31 29<br />
P4 0 0 0 0 0 0 0 0 0<br />
1 3 4 0 0 8 4 9 2<br />
2 5 4 0 0 9 10 15 7<br />
3 31 27 0 0 40 41 39 33<br />
C21 0 0 0 0 0 0 0 0 0<br />
1 11 3 0 0 5 4 3 6<br />
2 12 11 0 0 3 13 8 32<br />
3 37 44 0 0 44 34 46 54<br />
C22 0 0 0 0 0 0 0 0 0<br />
1 2 2 0 0 3 2 2 2<br />
2 9 10 0 0 4 7 3 7<br />
3 27 25 0 0 40 24 25 33<br />
C23 0 0 0 0 0 0 0 0 0<br />
1 1 1 0 0 1 1 1 1<br />
2 4 10 0 0 7 6 3 8<br />
3 23 15 0 0 22 30 24 26<br />
C24 0 0 0 0 0 0 0 0 0<br />
1 1 1 0 0 1 1 1 1<br />
2 4 9 0 0 3 7 3 8<br />
3 15 24 0 0 16 33 20 31<br />
I Zero time "Test" and "Control" values obtained from one reaction vessel per replicate<br />
ZReplicate<br />
195
TABLE 63 . Impact <strong>of</strong> oil on metabolic activity and photosynthesis<br />
<strong>of</strong> Nostoc muscorum ATCC 0 27347<br />
System<br />
Replicate<br />
Metabolic Activity<br />
'Ug OZ consumed/mg cells<br />
Photosynthesis<br />
1Ag OZ produced/mg cells<br />
Test 1 2.3 158<br />
2 12 .5 163<br />
3 11 .7 156<br />
4 0.0 168<br />
5 0.0 150<br />
5.3 t 6 .3 159± 7<br />
Control 1 0 0<br />
2 0 0<br />
3 0 0<br />
4 0 0<br />
S 0 0<br />
Ot0<br />
Ot0<br />
IX oil 1 9 .4 183<br />
2 9.7 169<br />
3 9.4 179<br />
4 14.1 167<br />
S 0 168<br />
8.5 t5 .2 17317<br />
I OX oil 1 18 .8 133<br />
2 11 .7 156<br />
3 11 .7 149<br />
4 14 .0 114<br />
S 14 .0 136<br />
14 .0 ± 2.9 138 t 16<br />
1%
5000<br />
4000<br />
Test<br />
1 juI oil<br />
10 PI oil<br />
U<br />
3000<br />
D<br />
O<br />
CC<br />
a 2000<br />
O<br />
U<br />
Y<br />
1000<br />
Control<br />
0<br />
5 10 15<br />
TIME IN DAYS<br />
FIG . 27 . Impact <strong>of</strong> oil on the rate <strong>of</strong> COZ produced from proteolytic activity by Pseudomonas sp 3.<br />
197
2500<br />
0<br />
W<br />
U<br />
D<br />
O<br />
a<br />
O<br />
U<br />
CM<br />
i<br />
2000<br />
1500<br />
1000<br />
Test<br />
10 ;41 oil<br />
1 ;4I oil<br />
500<br />
0<br />
1 3 5<br />
TIME IN DAYS<br />
Control<br />
FIG. 28 . Impact <strong>of</strong> oil on the heterotrophic activity <strong>of</strong> Enterobactersp 1 as determined by measuring COZ using GLC .<br />
198
2500<br />
2000<br />
D<br />
w<br />
U<br />
0<br />
N<br />
O<br />
U<br />
1500<br />
1000<br />
500<br />
10 ;AI Oil<br />
Test<br />
1 JAI Oil<br />
0<br />
5 10 15<br />
TIME IN DAYS<br />
Control<br />
FIG . 29 . Impact <strong>of</strong> oil on cellulose utilization by measuring 14C02 produced by Cellulomonas sp 1 .<br />
199
500<br />
400<br />
O<br />
W<br />
U<br />
O<br />
0<br />
X<br />
a<br />
N<br />
0<br />
U<br />
i<br />
300<br />
ZW<br />
100<br />
Test<br />
10 JAI Oil<br />
1 JAI Oil<br />
0<br />
- Control<br />
5 10 15<br />
TIME IN DAYS<br />
FIG . 30 . Impact <strong>of</strong> oil on the rate o14 COZ produced during lipolysis by Pseudomonas sp S .<br />
200
2500<br />
10 ;41 oil<br />
2000<br />
0<br />
w<br />
U<br />
0<br />
n.<br />
N<br />
U<br />
i<br />
1500<br />
1000<br />
Test<br />
1 yI oil<br />
500<br />
0<br />
5 10 15<br />
TIME IN DAYS<br />
Control<br />
FIG . 31 . Impact <strong>of</strong> oil on chitin utilization by Pseudomonas sp 6 .<br />
201
IV . DISCUSSION<br />
A . Analysis <strong>of</strong> Microbial Populations<br />
1 . Aerobic Heterotrophic Bacteria<br />
Numbers <strong>of</strong> aerobic heterotrophs at control sites<br />
decreased from an average <strong>of</strong> ca . 1 x 10⁶ (per ml <strong>of</strong> sediment)<br />
during Cruise I (May) to an average <strong>of</strong> ca . 6 x 10⁴<br />
during Cruise 11 (August-September) . The average increased<br />
to ca . 6 X 10⁵ during Cruise III (January), suggesting<br />
a seasonal trend possibly due to a lack <strong>of</strong> a sufficient<br />
nutrient(s) during the summer .<br />
Average numbers <strong>of</strong> aerobic heterotrophs for<br />
primary platforms (ca . 4 x 10⁶) were higher during<br />
Cruise I than during Cruise II as shown in Table 9 .<br />
Average numbers <strong>of</strong> aerobic heterotrophs for Cruise III<br />
(ca . 8 X lOs) were in a numerical range between those for<br />
Cruises I and II, as was previously observed for aerobic<br />
heterotrophs at control sites (Tables 8 and 9) . The ratio<br />
<strong>of</strong> numbers <strong>of</strong> aerobic heterotrophs at primary platforms<br />
for Cruises I :II :I11 was 50 :1 :10, suggesting the<br />
same seasonal trend previously observed at control sites,<br />
where the ratio was 20 :1 :10 . The average number <strong>of</strong><br />
aerobic heterotrophs at the secondary platforms (sampled<br />
during Cruise II) was 8 x 10° (Table 10), which was<br />
similar to the numbers found at the primary platforms<br />
and control sites during that Cruise . Thus, although<br />
numbers <strong>of</strong> heterotrophs at the primary platforms were<br />
significantly higher than at the corresponding controls<br />
for Cruise I, this was not the case for the other two<br />
cruises . Furthermore, all sites seemed to demonstrate<br />
the same seasonal trends in variation .<br />
As was suggested earlier, one <strong>of</strong> the possible explanations<br />
for the large decrease in population during<br />
the August cruise (Cruise II) is a lack <strong>of</strong> sufficient nutrient(s)<br />
during the summer . Walker and Colwell (1976a)<br />
have reported similar results for aerobic heterotrophs in<br />
control site sediments <strong>of</strong> Chesapeake Bay, viz . lower<br />
numbers <strong>of</strong> sediment microorganisms in August, 1977,<br />
due, in <strong>part</strong>, to oxygen depletion . Although examination<br />
<strong>of</strong> measured levels <strong>of</strong> DO did not confirm it as a<br />
limiting factor during this study, most <strong>of</strong> these DO readings<br />
were not taken at the water-sediment interface and<br />
possibly do not reflect the true situation in the sediment .<br />
Since all plate counts were conducted under aerobic<br />
conditions, a shift in environmental conditions toward<br />
anaerobiosis would likewise cause a shift in the microbial<br />
population from aerobes to anaerobes . Therefore,<br />
if the DO number in the sediment was lower, the obligate<br />
aerobes would decline in number, and the corresponding<br />
increase in obligate anaerobes would not have<br />
been detected . Overall, no correlations were observed<br />
between counts and DO, salinity, or inorganic sediment<br />
nutrients (see Section B below) . No direct correlations<br />
were observed between population numbers and sediment<br />
type as determined by grouping sites P1, P4, C23,<br />
and C24 as the clay-silt group, and sites P2, P3, C21,<br />
and C22 as the sand-silt group (Huang, 1981) . Furthermore,<br />
no consistent correlations were observed when<br />
numbers <strong>of</strong> aerobic heterotrophs were compared with<br />
total organic carbon (TOC), pyrene content, or total hydrocarbon<br />
(TH) content (data from Volumne I, Part 8) .<br />
Although analysis <strong>of</strong> the data for pyrene, TOC, TH,<br />
and aerobic heterotrophs suggests that for sites P2, P3,<br />
C22, and C24 sampled during Cruises I (most pronounced<br />
effect), II, and III, hydrocarbons may have<br />
had a negative impact on aerobic heterotrophs, such is<br />
not the case for sites P1, P4, C21, and C23 .<br />
There are many other factors that may influence<br />
numbers <strong>of</strong> aerobic heterotrophic bacteria that are detected<br />
in marine sediments . These include : current patterns<br />
; river influence (Mississippi) ; age, size and development<br />
<strong>of</strong> platforms ; number, type, and size <strong>of</strong> spills ;<br />
and other factors that are described below . Cruise II<br />
provided an opportunity to examine possible<br />
relationships between aerobic heterotrophic bacteria<br />
and possible factors that might influence their numbers<br />
at a significant number <strong>of</strong> platforms and control sites<br />
(Table 64) . When these factors are examined it appears<br />
that age and degree <strong>of</strong> development do not correlate<br />
with numbers <strong>of</strong> aerobic heterotrophs . Of the factors<br />
that appeared to correlate with numbers <strong>of</strong> aerobic heterotrophs,<br />
viz ., depth, distance from shore and distance<br />
from the Mississippi River delta, the latter appeared to<br />
have the greatest influence on numbers <strong>of</strong> aerobic heterotrophic<br />
bacteria, especially for those sampling sites<br />
located within 40 km <strong>of</strong> the delta (see Fig . 3) . Although<br />
this trend is not demonstrated by Duncan multiple range<br />
analysis (Table 65) ., it is clearly shown using a correlated<br />
t-test (Fig . 4) .<br />
It should be noted that (as per the conditions <strong>of</strong><br />
the contract) all <strong>of</strong> the preceding results were based on<br />
colony-forming units (CFU) per ml <strong>of</strong> sediment . However,<br />
even when values were compared after transformation<br />
to CFU per gram <strong>of</strong> sediment, essentially the<br />
same conclusions could be drawn as before .<br />
The marine agar used to enumerate aerobic heterotrophs<br />
in this study, ZoBell's 2216 (ZoBell, 1941) has<br />
been reported to be one <strong>of</strong> the most efficient media for<br />
quantifying heterotrophic bacteria from the marine environment<br />
(Simidu, 1974) . The spread-plate technique<br />
used in this study appears to be superior to the pourplate<br />
method because the latter method causes die-<strong>of</strong>f <strong>of</strong><br />
autochthonous organisms unable to survive exposure to<br />
the temperature <strong>of</strong> molten agar (Buck and Cleverdon,<br />
1960) .<br />
The samples and subsamples obtained in this<br />
study were frozen after they were collected and analyzed<br />
after 7-14 days . Subsamples removed after 7 days and<br />
plated on Marine Agar revealed an average (statistically<br />
insignificant) 10016 decrease in aerobic heterotrophs<br />
(Table 11) . The numbers <strong>of</strong> aerobic heterotrophs that<br />
survived frozen storage appeared to decrease exponentially,<br />
reaching 50% after 45 days frozen storage and<br />
18% after 90 days frozen storage (Fig . 5) . Although it<br />
appears that approximately 10% <strong>of</strong> the aerobic heterotrophs<br />
might not have survived frozen storage <strong>of</strong> 7-14<br />
days, counts <strong>of</strong> aerobic heterotrophs were not corrected<br />
for these losses because the decrease was statistically insignificant<br />
within this time frame . These losses <strong>part</strong>ially<br />
contradict the conclusions <strong>of</strong> Anthony (1963) who<br />
stated that freezing and then thawing after 6 months<br />
does not significantly change the microbial counts <strong>of</strong><br />
sediments, but support the validity <strong>of</strong> the data for this<br />
report, and confirm the report <strong>of</strong> Walker and Colwell<br />
(1975) who reported an 83-90% reduction in sediment<br />
203
Kilometers<br />
bMeters<br />
TABLE 64 . Rank <strong>of</strong> primary platforms (P1-P4), secondary platforms (SS-S20)<br />
and control sites (C21-C24) sampled during Cruise II<br />
Distance from<br />
Site rank b<br />
Mississippi Distance from Age <strong>of</strong> Degree <strong>of</strong><br />
River Delta Shore Depth Platform Development<br />
S6(25)"<br />
P2(5) " C21(3)b P2(1954)c S6(24)d<br />
SS(30) SS(6) S20(18) S20(1954) P2(24)<br />
P1(30) S12(11) S19(6) S10(1955) S13(24)<br />
513(30) 519(27) SS(9) 58(1957) 515(21)<br />
S7(40) C21(9) P2(12) S11(1957) S17(18)<br />
C21(40) C22(l0) P I(18) Pl(1962) S16(18)<br />
59(40) PI(19) 512(17) P3(1%8) S12(17)<br />
S8(60) S10(20) C24(18) SS(1962) P3(16)<br />
P2(80) 511(21) 510(20) 56(1%S) 510(16)<br />
512(80) 58(27) S11(20) S7(1%S) P1(15)<br />
C22(90) 513(41) C22(21) 59(1%5) 520(13)<br />
P3(90) 520(15) 518(25) 512(1965) S18(13)<br />
S10(100) 56(42) 58(27) P4(1964) Sl9(12)<br />
511(100) P3(42) 514(29) S19(1966) 514(12)<br />
P4(110) P4(53) P4(46) 513(1968) 511(12)<br />
C20(120) C23(32) C23(37) 518(1970) 57(12)<br />
C23(130) SIS(52) P3(35) S16(1971) P4(12)<br />
S19(180) 57(56) 516(45) S17(1972) 58(10)<br />
S16(200) C24(39) S13(51) S14(1973) 59(7)<br />
C24(200) S9(64) S6(52) 515(1974) SS(1)<br />
514(200) S14(68) S7(65)<br />
515(230) 516(97) Sl7(73)<br />
518(240) 515(115) S9(85)<br />
S17(250) S17 (120) S15(98)<br />
'Year installed<br />
dNumber <strong>of</strong> wells<br />
TABLE 65 . Rank and Duncan subsets <strong>of</strong> sites as established<br />
by microbial enumerationsi<br />
Site MAz ABOA3 RBA MRNHMS MRSHM6<br />
P1 4AI 14ABCD 13A 18A 9ABC<br />
P2 7A 8DE 19A 13A 13ABC<br />
P3 10A 17AB 12A SA 15AB<br />
P4 19A 21ABC 21A lA lOABC<br />
SS 2A 1G 18A l4A SBCD<br />
S6 3A 12ABCDE 16A l0A 3CD<br />
S7 SA 7DE 20A IlA ID<br />
S8 12A IOBCDE IIA 8A 7ABC<br />
S9 9A SEF 6A 6A 6BCD<br />
S10 20A 1SABCD 10A 9A 23AB<br />
511 11A 16ABC 4A 12A 12ABC<br />
S12 14A 6EF 15A 7A 4BCD<br />
S13 6A 2F 2A 2A 2CD<br />
514 22A 22AB SA 15A 22AB<br />
515 23A 11ABCDE 14A 21A 21AB<br />
S16 17A 9CDE 23A 23A 20AB<br />
S17 21A 3EF 3A 24A 19AB<br />
518 13A 23AB 17A 17A 18AB<br />
S19 24A 24A 22A 20A 24A<br />
S20 8A 18ABC 24A 19A 17AB<br />
C21 1 B 4EF 1 B 22A 8ABC<br />
C22 1SA 20AB 8A 4A 14ABC<br />
C23 18A 19AB 9A I6A IIABC<br />
C24 16A 13ABCD 7A 3A 16AB<br />
Numbers reflect ranking <strong>of</strong> colony-forming units/ml <strong>of</strong> sediment ranging from '1' (high) to '24' (low) . Letters reflect<br />
statistical sabots based on Duncan's Multiple Range Test, wi[h'A' being low .<br />
ZTotal aerobic plate count on Marine Agar at ?A C<br />
3 Aerobic hydrocarbonoclasts on Oil Agar at 20 C<br />
Aerobic yeast and mold count on Cooke Rose Bengal Agar at ?A C<br />
SNitnte-reducing hydrocarbonoclasts on Rosenfeld's Medium at 20 C<br />
6Sulfate-reducing hydrocarbonoclasts on Rosenfeld's Medium at 20 C<br />
204
aerobic heterotrophs after sediments were frozen for 6<br />
months . The findings also agree with those <strong>of</strong> Stewart<br />
and Marks (1978) who found no decrease in bacterial<br />
populations from sediments frozen for seven days .<br />
A number <strong>of</strong> investigators have performed bacteriological<br />
surveys in the Gulf <strong>of</strong> Mexico . Thus, it is<br />
useful to examine the results <strong>of</strong> these studies to determine<br />
how they compare with the results obtained in the<br />
present study . At least two <strong>of</strong> these studies cannot be<br />
compared to the present investigation because bacteriological<br />
populations <strong>of</strong> water, not sediment, were examined<br />
. ZoBell (1954) examined the aerobic heterotrophic<br />
bacteriological populations from Gulf <strong>of</strong> Mexico sediments,<br />
but made no attempt to quantify these organisms<br />
. Oppenheimer, Miget, and Kator (1974), in<br />
GURC's OEI, examined the association between hydrocarbons<br />
in seawater and the ability <strong>of</strong> microorganisms<br />
in the water column to oxidize hydrocarbons . Oujesky<br />
et al . (1979) examined the bacteriological populations in<br />
seawater <strong>of</strong> the South Texas Outer Continental Shelf<br />
(STOCS) . Sizemore and Olsen (1980) examined the aerobic<br />
heterotrophic bacteriological populations at a control<br />
site five miles north <strong>of</strong> the Buccaneer oil platform,<br />
and Schwarz et al . (1980) examined a number <strong>of</strong> stations<br />
on the STOCS . Both groups reported numbers <strong>of</strong> aerobic<br />
heterotrophs similar to those found in this study .<br />
Neither Sizemore nor Schwarz, however, reported a decrease<br />
in aerobic heterotrophs in the late summer or<br />
early fall .<br />
2. Aerobic Bacteria on Oil Agar<br />
Numbers <strong>of</strong> aerobic bacteria on oil agar (ABOA)<br />
were obtained after incubating plates at 20 C for 5-7<br />
days . A similar medium without oil was used as a control<br />
. Very few, if any, colonies were observed on the medium<br />
without oil, possibly because <strong>of</strong> the short incubation<br />
period . A longer incubation period <strong>of</strong> 14-21 days<br />
might have permitted detection <strong>of</strong> colonies on this control<br />
medium, but these slow-growing organisms would<br />
not have affected the results anyway . Few <strong>of</strong> the colonies<br />
<strong>of</strong> ABOA were tested for their ability to use Empire<br />
Mix crude oil, so that the ABOA can be described as<br />
having only a presumptive ability to use oil .<br />
At control sites numbers <strong>of</strong> ABOA decreased<br />
from an average <strong>of</strong> ca . 9 x 10³ per ml sediment during<br />
Cruise I to an average <strong>of</strong> ca . 3 x 10³ during Cruise II,<br />
and increased to ca . 1 .8 x 105 during Cruise III (Table<br />
12) . However, unlike numbers <strong>of</strong> aerobic heterotrophs<br />
on marine agar, numbers <strong>of</strong> ABOA did not show a significant<br />
seasonal trend because <strong>of</strong> larger standard errors<br />
(Fig . 6) .<br />
Average numbers <strong>of</strong> ABOA for primary platforms<br />
during Cruise I (ca . 2 X 10⁶) and Cruise III (ca . 7 x<br />
105) were higher than during Cruise II (ca . 5 X 10³) as<br />
shown in Table 13 . The ratio <strong>of</strong> numbers <strong>of</strong> ABOA at<br />
primary platforms for Cruises I :II :III was 400 :1 :185,<br />
suggesting a seasonal trend previously observed for aerobic<br />
heterotrophs at control sites and primary platforms<br />
. This trend was less pronounced for ABOA at<br />
control sites where the ratio was 3 :1 :60 . As discussed<br />
previously, this seasonal trend possibly reflects low DO<br />
levels during Cruise II (August-September, 1978) . The<br />
average number <strong>of</strong> ABOA at secondary platforms sampled<br />
during Cruise II (1 x 10°) was similar to that recorded<br />
for controls and platforms during Cruise II<br />
(Table 13) . Thus, it appears that average numbers <strong>of</strong><br />
ABOA were higher at platforms than at controls for<br />
Cruises I and III, but not for Cruise II when all numbers<br />
were quite low .<br />
As discussed above for aerobic heterotrophic<br />
bacteria, there are many factors that can influence numbers<br />
<strong>of</strong> ABOA recorded for sediment samples collected<br />
during Cruise II . Ranking <strong>of</strong> the sites sampled during<br />
Cruise II by numbers <strong>of</strong> ABOA did not appear to correlate<br />
with any <strong>of</strong> the factors listed in Table 64, except for<br />
proximity to the Mississippi River delta, as demonstrated<br />
by Duncan's Multiple Range Test (Table 65 and<br />
Fig . 7) . Nor were any correlations observed between<br />
ABOA and salinity, inorganic sediment nutrients, or<br />
dissolved oxygen, although (as mentioned previously)<br />
most <strong>of</strong> the DO readings were not taken at the watersediment<br />
interface and possibly do not reflect the true<br />
situation in the sediment .<br />
As discussed by Walker and Colwell (19766), it is<br />
<strong>of</strong>ten useful to express presumptive or confirmative estimates<br />
<strong>of</strong> oil-degrading microorganisms as a percentage<br />
<strong>of</strong> the heterotrophiu population, as was done for ABOA<br />
(Table 15, Figs . 8 and 9) . The ABOA expressed as a percentage<br />
<strong>of</strong> the aerobic heterotrophic bacterial population<br />
can be averaged for each site, ranked (Table 66)<br />
and compared to various physical, chemical, and geographic<br />
factors . Again, there did not appear to be a correlation<br />
between ABOA as a percentage <strong>of</strong> the aerobic<br />
heterotrophic bacterial population and any <strong>of</strong> those factors<br />
except for proximity to the River delta . In a recent<br />
review Atlas (1981) states that the level and proportion<br />
<strong>of</strong> hydrocarbon utilizers appears to be a sensitive index<br />
<strong>of</strong> hydrocarbons in the environment . In oil polluted<br />
areas the hydrocarbon utilizers may constitute up to<br />
100% <strong>of</strong> the microbial population, while in unpolluted<br />
areas they may only be 0 .1 % <strong>of</strong> the total population .<br />
Based on the above it would be concluded that the entire<br />
area investigated in the current study has been subjected<br />
to hydrocarbons, albeit <strong>of</strong> unknown origin .<br />
TABLE 66. Rank <strong>of</strong> primary platform and control sites<br />
for Cruises I, II, and III from highest to lowest<br />
based on ABOA as a percentage <strong>of</strong> the<br />
total aerobic heterotrophic<br />
bacterial population<br />
Site rank for Cruise<br />
II<br />
P3(73)1 P2(15) P2(124)<br />
P2(69) C21(14) P4(98)<br />
P4(48) C24(13) P3(93)<br />
P1(41) C23(9) P1(79)<br />
C21(7) P I(7) C21(72)<br />
C22(1) P3(7) C22(56)<br />
C23(0 .1) P4(7) C24(3)<br />
C24(0 .1) C22(5) C23(2)<br />
~ ABOA expressed as a percentage <strong>of</strong> the total aerobic heterotrophic<br />
bacterial population for ABOA and aerobic heterotrophs enumerated<br />
in samples from control sites and samples collected at 500 m N, E, W,<br />
and S <strong>of</strong> primary platforms<br />
In addition to the factors listed in Table 64, it<br />
might be possible to correlate numbers <strong>of</strong> ABOA with<br />
III<br />
205
sediment pyrene content, TOC, or TH . When this was<br />
attempted no correlation was found between ABOA (a<br />
presumptive measure <strong>of</strong> oil-degrading bacteria) and sediment<br />
hydrocarbon content . It is worth pointing out<br />
that Walker and Colwell concluded that there is a<br />
"threshold" concentration <strong>of</strong> oil in the environmentor<br />
a percentage <strong>of</strong> petroleum-degrading microorganisms<br />
in the microbial population <strong>of</strong> the environment-below<br />
which there is little correlation between the two, and<br />
these findings have been substantiated elsewhere<br />
(Brown, 1980) . The fact that statistically significant differences<br />
in numbers <strong>of</strong> hydrocarbonoclastic organisms<br />
did occur at various locations in the study area suggests<br />
that the population has been exposed to levels <strong>of</strong> oil<br />
above this "threshold," but the origin <strong>of</strong> this oil is unknown<br />
. In fact, the effects <strong>of</strong> natural environmental<br />
factors are magnified greatly due to the fact that most<br />
<strong>of</strong> the microbial activity in the sediments occurs in the<br />
top two or three centimeters, which in this area <strong>of</strong> the<br />
Gulf is <strong>of</strong> an extremely transient nature . Consequently,<br />
even though platform sites yielded consistently higher<br />
populations <strong>of</strong> ABOA than did the control sites, conclusions<br />
on cause-and-effect relationships regarding platform<br />
activity alone should be drawn with extreme caution<br />
due to the influence <strong>of</strong> other forces in the areapredominantly<br />
the Mississippi River, which has been<br />
shown to introduce more than 12,000,000 cubic feet <strong>of</strong><br />
hydrocarbons into the Gulf <strong>of</strong> Mexico annually (Murisawa,<br />
1968) .<br />
In the attempt to rank platform and control sites<br />
based on ABOA as a percentage <strong>of</strong> the heterotrophic<br />
population (Table 66), it was assumed that pyrene,<br />
TOC, or TH might be representative <strong>of</strong> sediment hydrocarbons,<br />
and that these hydrocarbons might be petrogenic<br />
in origin and possibly have resulted from discharge<br />
at platforms and accumulation in platform sediments<br />
. If these assumptions are not valid (i .e. pyrene,<br />
TOC, and TH do not provide the most sensitive indicators<br />
<strong>of</strong> sediment petroleum hydrocarbons) and we examine<br />
percents <strong>of</strong> ABOA, the consistently higher ranking<br />
<strong>of</strong> primary platforms over controls becomes quite<br />
noticeable (Table 66) . The methods we have selected to<br />
quantify hydrocarbons or hydrocarbon-degrading bacteria<br />
may ; therefore, have to be refined .<br />
3 . Yeasts and Fungi<br />
ZoBell (1954) summarized some reports <strong>of</strong> fungi<br />
in the marine environment as they related to the Gulf <strong>of</strong><br />
Mexico, but made no attempt to quantify yeasts or<br />
fungi . Ahearn, Meyers, and Standard (1971) described<br />
the ability <strong>of</strong> yeast isolates from Louisiana marshlands<br />
and the Gulf <strong>of</strong> Mexico to grow in the presence <strong>of</strong> oils<br />
and hydrocarbons . They also reported that numbers <strong>of</strong><br />
yeasts in marshland sediments ranged from 5 X 10² to 9 X<br />
10° per ml sediment, but they did not report numbers <strong>of</strong><br />
yeasts in Gulf <strong>of</strong> Mexico sediment . Ahearn and Meyers<br />
(1972) described some genera <strong>of</strong> yeasts and fungi that<br />
were isolated from Barataria Bay, Louisiana and Gulf<br />
<strong>of</strong> Mexico waters . Brown, Light, and Minchew (1980)<br />
did quantify the yeasts and molds in a number <strong>of</strong> sediment<br />
samples obtained from the Gulf <strong>of</strong> Mexico . Thus,<br />
this study appears to be the second attempt to quantify<br />
yeasts and fungi in the Gulf <strong>of</strong> Mexico sediments .<br />
Numbers <strong>of</strong> yeasts and fungi were obtained after<br />
incubating plates <strong>of</strong> PDA and RB at 20 C for 5-7 days .<br />
Counts on PDA were one to two orders <strong>of</strong> magnitude<br />
lower than counts on RB . The reason for the lower<br />
counts on PDA (not included in the results) is unknown .<br />
No attempts were made to distinguish yeasts from filamentous<br />
fungi when these microorganisms were enumerated<br />
and subsequently both will be discussed as<br />
fungi . In general, numbers <strong>of</strong> fungi were much more<br />
variable from sample to sample than were numbers <strong>of</strong><br />
heterotrophic bacteria . This phenomenon may result<br />
from greater potential patchiness <strong>of</strong> sediment heterotrophic<br />
fungi than heterotrophic bacteria, or from problems<br />
resulting from inconsistent breakup/cohesion <strong>of</strong><br />
the mycelia during sample preparation-a problem<br />
commonly encountered during enumeration <strong>of</strong> fungi .<br />
When average counts <strong>of</strong> fungi were determined, no attempts<br />
were made to distinguish and remove outliers before<br />
calculating the average because <strong>of</strong> the inability to<br />
distinguish outliers from "normal" numbers <strong>of</strong> the microorganisms,<br />
except for grab sample #2, Control Site<br />
C21, Cruise II, where 29,900 CFU per ml was considered<br />
an outlier .<br />
At control sites, most <strong>of</strong> the counts for fungi<br />
were similar within each cruise, but different between<br />
cruises as was previously observed for aerobic heterotrophic<br />
bacteria and ABOA at control sites . Exceptions<br />
were counts <strong>of</strong> fungi at Sites C21 and C24 during Cruise<br />
I which were significantly different from counts <strong>of</strong> fungi<br />
at Sites C22 and C23 . During Cruises I, II, and III,<br />
counts <strong>of</strong> fungi at control sites ranged from average <strong>of</strong><br />
50-2,250 CFU per ml sediment, 430-1,450 CFU per ml<br />
sediment and 60-675 CFU per ml sediment, respectively<br />
(Table 16) . Counts <strong>of</strong> fungi at control sites were 0-3 and<br />
2-4 orders <strong>of</strong> magnitude less than counts <strong>of</strong> ABOA and<br />
aerobic heterotrophic bacteria, respectively . It is difficult<br />
to determine whether these counts actually represent<br />
in situ fungal populations at control sites, because<br />
<strong>of</strong> the variability <strong>of</strong> counts between grab samples<br />
(e.g. counts from individual grab samples at Site C23<br />
during Cruise I ranged from 50 to 4,400 CFU per ml<br />
sediment) . Thus, it is difficult to determine if statistically<br />
significant seasonal changes in fungal populations<br />
occur because <strong>of</strong> sample to sample and site to site<br />
variability within each cruise, as could be determined<br />
for aerobic heterotrophic bacteria and ABOA for control<br />
sites . Similarly, it is difficult to correlate any expected<br />
seasonal trend with changes in DO If seasonal<br />
changes correlated with potentially low DO during<br />
Cruise II were predicted, it might be estimated that<br />
numbers <strong>of</strong> these eucaryotic organisms (which are obligate<br />
aerobes) would have decreased during Cruise Il, as<br />
was previously observed for aerobic heterotrophic bacteria<br />
and ABOA at control sites . This ; however, was not<br />
the case .<br />
At primary platforms, most <strong>of</strong> the fungal counts<br />
were similar within each cruise but different between<br />
cruises, as was previously observed for aerobic heterotrophic<br />
bacteria and ABOA at primary platforms . During<br />
Cruises I, II, and III counts <strong>of</strong> fungi at primary platforms<br />
ranged from 8,834-45,000 CFU per ml sediment,<br />
587-1,081 CFU per ml sediment and 544-1,261 CFU per<br />
ml sediment, respectively (Table 17) . Counts <strong>of</strong> fungi at<br />
primary platforms were 1-3 and 2-3 orders <strong>of</strong> magnitude<br />
less than counts <strong>of</strong> ABOA and aerobic heterotrophic<br />
bacteria, respectively . As discussed above for control<br />
site fungal populations, it is difficult to determine<br />
whether these counts represent actual in situ fungal populations<br />
because <strong>of</strong> the variability <strong>of</strong> counts between<br />
206
grab samples (e .g. fungal counts from individual grab<br />
samples at the East transect <strong>of</strong> Primary Platform P2<br />
ranged from 50 to 45,000 CFU per ml sediment during<br />
Cruise I) . Thus, it is difficult to determine if there are<br />
statistically significant differences in fungal counts at<br />
primary platforms from season to season . However, if<br />
the average fungal counts are examined, the data suggest<br />
that fungal populations at primary platforms were<br />
higher during Cruise I than during Cruises II and III .<br />
The average number <strong>of</strong> fungi detected in sediments<br />
at secondary platforms was similar to numbers<br />
detected at control sites and primary platforms during<br />
Cruise II (Table I8) . Numbers <strong>of</strong> fungi in sediments at<br />
secondary platforms were 0-2 and 1-3 orders <strong>of</strong> magnitude<br />
less than numbers <strong>of</strong> ABOA and aerobic heterotrophic<br />
bacteria, respectively . Thus, sediment fungal populations<br />
for control sites and platforms sampled during<br />
all three cruises appeared to be similar, except for<br />
Cruise I when the fungal populations appeared to be<br />
higher at primary platforms than at control sites .<br />
As discussed above for aerobic heterotrophic<br />
bacteria and ABOA, there are many factors that can influence<br />
numbers <strong>of</strong> sediment fungal populations (Table<br />
64) . Ranking <strong>of</strong> the sites sampled during Cruise II by<br />
numbers <strong>of</strong> heterotrophic fungi did not appear to correlate<br />
with any <strong>of</strong> the factors mentioned previously, viz .,<br />
distance from the Mississippi River, distance from<br />
shore, depth, age or degree <strong>of</strong> development, DO, salinity,<br />
inorganic sediment nutrients, TOC, TH, pyrene<br />
content, or sediment type .<br />
Colwell, Walker, and Nelson (1973) reported 20<br />
fungi per ml <strong>of</strong> Eastern Bay sediment (pristine Chesapeake<br />
Bay shellfish-harvesting sediment) during<br />
November, 1972 . Walker and Colwell (1974) reported<br />
500-600 fungi per ml <strong>of</strong> Eastern Bay sediment during<br />
February and April 1973 . Walker et al . (1976) reported<br />
season, but not necessarily an effect <strong>of</strong> decreased DO,<br />
because an increase, not a decrease, in MRNHM counts<br />
would have been anticipated if DO were lower during<br />
Cruise II, since MRNHM should be anaerobes . However,<br />
while the exact carbon source for microbial growth<br />
is not definitely known, it is certain that nitrate reduction<br />
did occur, because nitrites were found in the<br />
medium .<br />
The average number <strong>of</strong> MRNHM detected in<br />
sediments at secondary platforms was similar to numbers<br />
detected at control sites and primary platforms during<br />
Cruise II (Table 21) . Numbers <strong>of</strong> MRNHM in sediments<br />
at secondary platforms were 2-3, 2-4, and 3-4<br />
orders <strong>of</strong> magnitude less than numbers <strong>of</strong> fungi,<br />
ABOA, and aerobic heterotrophic bacteria, respectively<br />
. Thus, MRNHM counts appeared to be similar at<br />
controls and platforms during all three cruises .<br />
Variability in numbers <strong>of</strong> MRNHM among the<br />
three cruises makes it difficult to comment on the effect<br />
<strong>of</strong> season on these microorganisms . However, if anaerobic<br />
nitrate-reducing, hydrocarbon-utilizing microorganisms<br />
were cultured in Rosenfeld's medium, and if it is<br />
valid to assume that DO decreased during Cruise II,<br />
then numbers <strong>of</strong> MRNHM possibly would have increased<br />
during Cruise II ; this was not the case .<br />
As discussed above, there are many factors that<br />
can influence numbers <strong>of</strong> MRNHM . Ranking <strong>of</strong> sites<br />
sampled during Cruise II by numbers <strong>of</strong> MRNHM did<br />
not appear to correlate with any <strong>of</strong> the factors described<br />
in Table 64, except for proximity to the Mississippi<br />
River delta (Fig . 32) . Although this correlation is not<br />
supported by Duncan analysis (see Table 65) it is<br />
strongly indicated by a correlated t-test analysis . Numbers<br />
<strong>of</strong> MRNHM did not appear to be correlated with<br />
sediment pyrene content, TOC, TH, sediment inorganic<br />
nutrients, DO, salinity, or sediment type .<br />
S. Microorganisms from Rosenfe/d's Sulfate-<br />
Hydrocarbon Medium (MRSHM)<br />
Numbers <strong>of</strong> MRSHM were obtained by inoculating<br />
MPN tubes <strong>of</strong> oil-containing, sulfate-containing medium<br />
(see Tables 3-5) with 1/10, 1/100, and 1/1000 dilutions<br />
<strong>of</strong> sediment and incubating the tubes at 20 C for<br />
three weeks . As was the case with MRNMH, no attempt<br />
was made to confirm hydrocarbon degradation, so this<br />
is merely a presumptive test for organisms with this capability<br />
. Again, it cannot be stated with certainty that the<br />
organisms could utilize hydrocarbons, since the crude<br />
oil employed in the medium contains non-hydrocarbon<br />
carbonaceous matter . It is certain ; however, that sulfate<br />
reduction did occur since sulfides were found in the<br />
spent medium .<br />
Counts <strong>of</strong> MRSHM at the control sites (see<br />
Table 22) ranged from 3-20 per ml sediment (Cruise I),<br />
2-5 per ml sediment (Cruise II), and 5-35 per ml sediment<br />
(Cruise III) . At primary platforms, most <strong>of</strong> the<br />
MRSHM counts (see Table 23) were similar within any<br />
given cruise, but different between cruises (as was previously<br />
observed for aerobic heterotrophic bacteria,<br />
ABOA, fungi, and MRNHM) . During Cruises I, II, and<br />
lIl, MRSHM counts ranged from 12-48 per ml sediment,<br />
3-4 per ml sediment, and 4-18 per ml sediment, respectively<br />
. The average number <strong>of</strong> MRSHM detected in<br />
sediments at secondary platforms was similar to those<br />
detected at control sites and primary platforms during<br />
Cruise II (see Table 24) .<br />
Overall, these counts suggest the same seasonal<br />
effect mentioned for other microbial types, but the<br />
cause <strong>of</strong> this trend cannot be determined using the data<br />
available due to a lack <strong>of</strong> correlation between numbers<br />
and sediment inorganic nutrients, DO, salinity, sediment<br />
type, TOC, TH, pyrene content, or any physical<br />
factors associated with the platforms . However, a Duncan<br />
multiple range analysis <strong>of</strong> the data from Cruise II<br />
(with the availability <strong>of</strong> 24 sites for comparison) shows<br />
an effect <strong>of</strong> proximity to the Mississippi River delta<br />
more clearly than it does for any other microbiological<br />
parameter (see Table 65 and Fig . 10) .<br />
B. Sample Analysis <strong>of</strong> Chemical Nutrients<br />
The chemical parameters studied showed a high degree<br />
<strong>of</strong> variability between sites with few definite consistent<br />
trends (see Tables 25-31) . Ammonia-nitrogen concentrations<br />
demonstrated the only clear-cut seasonal<br />
trend, with Cruise I values (160 jig-atoms per kg sediment<br />
at the control sites and 190 jig-atoms per kg sediment<br />
at the primary platforms) being definitely lower<br />
than those from Cruise II (1300 and 1100 jig-atoms per<br />
kg sediment, respectively) or Cruise III (1100 jAg-atoms<br />
per kg sediment at both platforms and controls) . Conversely,<br />
total Kjeldahl nitrogen values were somewhat<br />
higher during Cruise I (30,000 and 26,000 Mg-atoms per<br />
kg sediment for control sites and primary platforms, respectively)<br />
than during the other two cruises (14,000 and<br />
13,000 for Cruise II ; 16,000 and 9300 for Cruise III) .<br />
Nitrate-nitrogen concentrations showed the least variability<br />
<strong>of</strong> any chemical parameters . Nitrate-nitrogen values<br />
(in jig-atoms per kg sediment) for the control sites<br />
during Cruises I, II, and III were 540, 690, and 630, respectively<br />
. The corresponding values for the primary<br />
platforms were 420, 730, and 570 . At no time were detectable<br />
levels <strong>of</strong> nitrite-nitrogen observed .<br />
Ortho-phosphate-phosphorus values showed the<br />
only statistically significant differences between platforms<br />
and controls, but the results were contradictory<br />
between cruises, with platforms having more phosphate<br />
than controls for Cruise I (140 vs . 4 .6 jig-atoms per kg<br />
sediment), and less phosphate than controls for Cruise<br />
II (62 vs . 250 Mg-atoms per kg sediment) . Cruise III data<br />
showed no significant differences for phosphate (66 vs .<br />
90 jAg-atoms per kg sediment for primary platforms and<br />
control sites, respectively) or for any other chemical parameter<br />
. Total phosphorus values were somewhat (statistically<br />
insignificant) lower at control sites than at primary<br />
platforms for Cruise I (17,200 vs . 20,000 kg-atoms<br />
per kg sediment) and Cruise II (9300 vs. 12,000), but<br />
again, this trend did not hold true during Cruise III<br />
where both values were 13,000 pg-atoms per kg sediment<br />
. For all six chemical parameters studied, concentrations<br />
at secondary platforms were similar to values<br />
obtained at the primary platforms during Cruise II .<br />
Brown, et al . (1980) reported concentrations <strong>of</strong><br />
ammonia-nitrogen, total nitrogen, and phosphatephosphorus<br />
in the northern Gulf <strong>of</strong> Mexico . Their values<br />
are similar to those obtained in this study .<br />
It might be assumed that variations in chemical nutrients<br />
would affect numbers <strong>of</strong> microorganisms in the<br />
system . As shown by Duncan's multiple range analysis,<br />
ammonia-nitrogen concentrations did demonstrate a<br />
certain degree <strong>of</strong> east-west variation, with the highest<br />
concentrations being found in the area nearest the Mississippi<br />
River delta (Fig . 33) . However, as has already<br />
208
p0<br />
O° y °~, ,y 0 ' 2<br />
c~ oa<br />
Ct_ c317 i::_: 2, CP<br />
6 `1<br />
C<br />
21 0 5 0<br />
1 0<br />
12 . 8 a 13 ~ "<br />
0 18 0 24<br />
0 19 10<br />
22<br />
20 11 ~<br />
9<br />
9<br />
O 14<br />
3<br />
4<br />
0 17<br />
16 ° 23 0<br />
LEGEND<br />
0 0- 50 %ile<br />
51-100 96i1e<br />
Scale<br />
0 15 0 10 20 30<br />
FIG . 32 . Nitrate-reducing, hydrocarbon-utilizing bacteria .
0<br />
t<br />
21 5 0%<br />
f "<br />
18<br />
14zz=) V* 00 20<br />
12 0<br />
22 0<br />
0 19 10<br />
6<br />
8 13 ;()K<br />
14<br />
16 23w<br />
LEGEND<br />
x 1530-2400 mg atoms/ Kg sod .<br />
0 1050-1430 p9<br />
* 700- 980 N9<br />
17 0 0- 680 ;Ag<br />
Scale<br />
15 0 10 20 30<br />
FIG. 33 . Subsets <strong>of</strong> ammonia-nitrogen concentration based on Duncan's Multiple Range Test .
een discussed for each <strong>of</strong> the microbiological groups<br />
above, no direct chemical/microbial correlations were<br />
discernible for ammonia or any other chemical parameter<br />
. Although the concentrations <strong>of</strong> all these chemical<br />
nutrients might be considered somewhat low to support<br />
the microbial populations reported, it must be pointed<br />
out that in this area the nutrients are constantly replenished<br />
by the influx from rivers .<br />
C. Oil Degradation<br />
One <strong>of</strong> the data products required for this contract<br />
was an estimation <strong>of</strong> the oil-degrading potential <strong>of</strong><br />
the sediments . In this connection it is interesting to note<br />
that Caparello and Larock (1975) found that the<br />
hydrocarbon-oxidizing potential <strong>of</strong> environmental samples<br />
reflects the hydrocarbon burden <strong>of</strong> the area and the<br />
ability <strong>of</strong> the indigenous microorganisms to utilize hydrocarbons<br />
. Similarly, Walker and Colwell (1976a) reported<br />
greater rates <strong>of</strong> uptake and mineralization for<br />
samples collected from an oil-polluted area than from a<br />
relatively unpolluted area .<br />
There are a number <strong>of</strong> ways in which the oil-degrading<br />
potential may be calculated . For example, loss <strong>of</strong> hydrocarbon<br />
from the system has been employed by Oppenheimer,<br />
et al . (1980) while Caparello and Larock (1975)<br />
and Walker and Colwell (1976) used 1°C-radiolabeled<br />
hydrocarbons . Johnston (1970) estimated oil-degrading<br />
potential <strong>of</strong> sand columns containing Kuwait crude on<br />
the basis <strong>of</strong> oxygen consumption .<br />
In the present study, the system designed to estimate<br />
the oil-degrading potential <strong>of</strong> the sediment yielded<br />
erratic results in terms <strong>of</strong> oil utilization . The fact that<br />
hydrocarbons were produced by microorganisms during<br />
the metabolism <strong>of</strong> the oil precluded determining the<br />
exact amount <strong>of</strong> oil degraded . Therefore, the method<br />
employed in this report for estimating the oil-degrading<br />
potential <strong>of</strong> the sediments was based on the amount <strong>of</strong><br />
oxygen required to oxidize hydrocarbon-carbon to carbon<br />
dioxide . For these calculations a respiratory quotient<br />
<strong>of</strong> 0 .67 was assumed on the basis <strong>of</strong> an oil having<br />
70% saturated aliphatic alkanes (calculated as pentane)<br />
and 30% aromatics (calculated as benzene) . For this<br />
investigation, the maximum rate <strong>of</strong> oxygen utilization<br />
occurred in sediments obtained from the control sites<br />
during Cruise II using a temperature <strong>of</strong> IS C . In this<br />
case, the estimated oil-degrading potential <strong>of</strong> the sediments<br />
was 56 Mg <strong>of</strong> hydrocarbon carbon converted to<br />
carbon dioxide per milliliter <strong>of</strong> sediment per day . Calculations<br />
for this estimate were as follows :<br />
Thus<br />
(ml OZ/ml sed ./day) (RQ) (at . wt . <strong>of</strong> C)<br />
_ pg hydrocarbon carbon/ml sed ./day .<br />
(6 .9) (0 .67) (12) = 56 Ng hydrocarbon carbon/ml<br />
sed ./day<br />
It is generally conceded that the rate limiting factor in<br />
the degradation <strong>of</strong> the oil in the sediments is the oxygen<br />
supply . This certainly seems to be the case in the present<br />
investigation since the addition <strong>of</strong> phosphate and nitrogen<br />
(ammonium or nitrate ions) did not enhance oxygen<br />
utilization in the system, nor did the availability <strong>of</strong> an<br />
increased amount <strong>of</strong> oil .<br />
If the oil-degrading potential were calculated on the<br />
basis <strong>of</strong> data obtained in the experiments conducted on<br />
the Warburg apparatus, much higher potentials would<br />
be generated - due in <strong>part</strong> to the increased availability <strong>of</strong><br />
oxygen brought about by the shaking action <strong>of</strong> the system<br />
. It is believed ; however, that the value <strong>of</strong> 56 jAg hydrocarbon<br />
carbon/ml sed . per day is more realistic .<br />
The pattern <strong>of</strong> hydrocarbon utilization by mixed and<br />
pure cultures conformed to the pattern shown by many<br />
previous workers (Wyman and Brown, 1975) . For example,<br />
in the present study the straight-chain aliphatics<br />
were the first class <strong>of</strong> compounds attacked by the micr<strong>of</strong>lora,<br />
followed by the branched-chain aliphatics and<br />
aromatics . In the case <strong>of</strong> the aromatics, the two-ring<br />
compounds were degraded faster than the three-ring<br />
aromatics . A major portion <strong>of</strong> the carbonaceous<br />
material in oil was converted to carbon dioxide .<br />
D . Magnitude <strong>of</strong> and Impact <strong>of</strong> Oil upon Microbial<br />
Processes<br />
The actual impact <strong>of</strong> microorganisms in the environment<br />
is a function <strong>of</strong> their activity rather than their<br />
numbers . A major :portion <strong>of</strong> this study, therefore, was<br />
devoted to the examination <strong>of</strong> twelve sediment microbial<br />
processes, and the impact <strong>of</strong> oil on these processes .<br />
As for the processes which did not exhibit demonstrable<br />
activity (sulfate reduction, phosphate uptake, nitrification,<br />
denitrification, nitrogen fixation, and photosynthesis),<br />
it must be stressed that experimental conditions<br />
could have been established such that metabolic potentials<br />
could be determined . However, the purpose <strong>of</strong> this<br />
project was to ascertain in situ reaction rates, and ;<br />
therefore, natural environmental conditions were adhered<br />
to in so far as was possible .<br />
Similarly, the studies concerning the impact <strong>of</strong> oil<br />
were designed to determine the effect <strong>of</strong> chronic (not<br />
massive) levels <strong>of</strong> oil pollution . The concentrations <strong>of</strong><br />
oil used (20 and 200 jAg oil/ml sediment) were deemed<br />
sufficient for this purpose, but the findings should not<br />
be extrapolated to imply similar results due to higher<br />
concentrations following a major oil spill .<br />
1 . Nitrification<br />
None <strong>of</strong> the composite sediment samples demonstrated<br />
detectable nitrification activity (see Table 41) . In<br />
order to determine <strong>of</strong> the lack <strong>of</strong> activity might be due to<br />
an effect <strong>of</strong> freezing the samples prior to analysis, four<br />
<strong>of</strong> the eight composites tested during Cruise III were<br />
fresh (never frozen) . Again ; however, no detectable activity<br />
was demonstrated . The cause <strong>of</strong> this lack <strong>of</strong> activity<br />
is ; therefore, most probably the lack <strong>of</strong> a sufficient<br />
carbon source, although activity in the sediments would<br />
also be inhibited by the relatively low levels <strong>of</strong> dissolved<br />
oxygen since nitrification is a highly aerobic process .<br />
Because the sediments exhibited no nitrification,<br />
there could be no inhibitory effect due to the presence <strong>of</strong><br />
oil . However, although both a pure culture (Nitrosomonas<br />
europea) and a terrestrial enrichment culture demonstrated<br />
perceptible nitrifying activity, neither <strong>of</strong> the<br />
oil-containing systems (40 jug or 400 ;Ag <strong>of</strong> Empire mix<br />
crude oil) exhibited nitrification, which implies that oil<br />
either inhibits or masks the process under the experimental<br />
conditions used .<br />
2 . Nitrogen Fixation<br />
None <strong>of</strong> the composite sediment samples demonstrated<br />
detectable nitrogen fixation (see Table 42) . In<br />
211
order to determine if the lack <strong>of</strong> activity might be due to<br />
an effect <strong>of</strong> freezing the samples prior to analysis, four<br />
<strong>of</strong> the eight composites tested during Cruise III were<br />
fresh (never frozen) . Again ; however, no detectable activity<br />
was demonstrated . The cause <strong>of</strong> this lack <strong>of</strong> activity<br />
is ; therefore, most probably the lack <strong>of</strong> a sufficient<br />
carbon source . Because the sediments exhibited no nitrogen<br />
fixation, there could be no inhibitory effect due<br />
to the presence <strong>of</strong> oil .<br />
3. Denitrification<br />
None <strong>of</strong> the composite sediment samples demonstrated<br />
detectable denitrification activity (see Table 43) .<br />
In order to determine if the lack <strong>of</strong> activity might be due<br />
to an effect <strong>of</strong> freezing the samples prior to analysis,<br />
four <strong>of</strong> the eight composites tested during Cruise III<br />
were fresh (never frozen) . Again ; however, no detectable<br />
activity was demonstrated . As was pointed out in<br />
the discussion <strong>of</strong> MRNHM, it is known that miroorganismscapable<br />
<strong>of</strong> reducing nitrates are present in the sediment,<br />
using either components <strong>of</strong> the crude oil or the<br />
agar as a carbon source . The cause <strong>of</strong> the lack <strong>of</strong> activity<br />
in this study is ; therefore, most probably the lack <strong>of</strong> a<br />
sufficient carbon source . Because the sediments<br />
exhibited no denitrification, there could be no<br />
inhibitory effect due to the presence <strong>of</strong> added oil .<br />
4. Sulfate Reduction<br />
Most <strong>of</strong> the composite sediment samples demonstrated<br />
no detectable sulfate reduction . In order to determine<br />
if the lack <strong>of</strong> activity might be due to an effect<br />
<strong>of</strong> freezing the samples prior to analysis, four <strong>of</strong> the<br />
eight composites tested during Cruise III were fresh<br />
(never frozen) . Again ; however, no detectable activity<br />
was demonstrated . As was mentioned in the discussion<br />
<strong>of</strong> MRSHM above, it is known that microorganisms capable<br />
<strong>of</strong> reducing sulfates ae present in the sediment,<br />
using either components <strong>of</strong> the crude oil or the agar as a<br />
carbon source . The lack <strong>of</strong> activity in this study is ;<br />
therefore, most probably due to the lack <strong>of</strong> a sufficient<br />
carbon source . Due to the overall lack <strong>of</strong> activity, there<br />
could be no inhibitory effect <strong>of</strong> oil . However, some <strong>of</strong><br />
the composites containing oil (replicate 2 <strong>of</strong> Control Site<br />
C22 from Cruise I containing 400 Ng oil and both replicates<br />
from Primary Platform P2 from Cruise II with<br />
both 40 and 400 jAg oil) demonstrated some degree <strong>of</strong><br />
sulfate reduction . Since all samples received identical<br />
treatment, this anomaly could be explained either<br />
by chance distribution <strong>of</strong> a small number <strong>of</strong> sulfatereducing<br />
bacteria, or by the utilization <strong>of</strong> one or more<br />
compounds in the oil as a carbon source . The exact<br />
cause cannot be ascertained with certainty, but it should<br />
be noted that the two sites in question (C22 for Cruise I<br />
and P2 for Cruise II) did not show especially high numbers<br />
<strong>of</strong> MRSHM as discussed above.<br />
S. Sulfur Oxidation<br />
Unlike the previously mentioned metabolic processes,<br />
sulfur oxidation activity was definitely demonstrated<br />
in all composites tested, with an average <strong>of</strong> 844<br />
jAg <strong>of</strong> sulfur oxidized per ml <strong>of</strong> sediment per day (see<br />
Table 45 and Fig . 20) . This was to be expected due to<br />
high concentrations <strong>of</strong> sulfur found in the sediment<br />
(Huang, 1981), and rates would not be inhibited by the<br />
lack <strong>of</strong> a carbon source (other than COZ) since sulfur<br />
oxidation is an autotrophic process . There was no<br />
observable impact <strong>of</strong> oil (20 jAg or 200 Ng oil per ml sediment)<br />
. However, while site C22 demonstrated the least<br />
activity <strong>of</strong> the eight sites, sites C21 and C23 were the<br />
most active, contributing to the observation (statistically<br />
significant but probably biologically insignificant)<br />
that control sites were somewhat more active than were<br />
platforms .<br />
In order to determine if the rates <strong>of</strong> activity<br />
might have been affected by the freezing <strong>of</strong> the samples<br />
prior to analysis, four <strong>of</strong> the eight composites tested<br />
during Cruise III were fresh (never frozen) . Similar results<br />
were obtained from both sets <strong>of</strong> samples (fresh and<br />
frozen), yielding the conclusion that freezing <strong>of</strong> the sediments<br />
for a period <strong>of</strong> seven days did not affect the magnitude<br />
or occurrence <strong>of</strong> sulfur oxidation .<br />
6. Photosynthesis<br />
None <strong>of</strong> the 48 composite samples demonstrated<br />
detectable photosynthetic activity (see Table 46), most<br />
probably due to a lack <strong>of</strong> algae brought about by an insufficient<br />
quantity <strong>of</strong> light reaching the sediments . Because<br />
<strong>of</strong> this total lack <strong>of</strong> activity, there could be no inhibitory<br />
effect due to the presence <strong>of</strong> oil . Likewise, there<br />
was no variation between sites or cruises . It should be<br />
noted again that all photosynthesis experiments were<br />
carried out on-board ship immediately after sample retrieval,<br />
and ; therefore, the samples were never frozen .<br />
7. Heterotrophic Activity<br />
Most <strong>of</strong> the 48 composite samples demonstrated<br />
rapid heterotrophic activity (defined as the conversion<br />
<strong>of</strong> 14C-glucose to 1°COZ) as was seen in Tables 47-49 .<br />
Heterotrophism showed the highest rate <strong>of</strong> activity (an<br />
average <strong>of</strong> 556 jig COZ per day, with values as high as<br />
1345 Mg/day) although the samples reached apparent<br />
stationary phase rather quickly (ca . 5-6 days with 14-30%<br />
<strong>of</strong> the glucose used) probably due to low useable nitrogen<br />
concentrations . Glucose utilization showed little<br />
variability among sites, with platform activities not significantly<br />
different from those <strong>of</strong> control sites . Cruise<br />
III activity rates were much higher than those <strong>of</strong> the<br />
other two cruises, showing a lack <strong>of</strong> correlation with<br />
mere numbers <strong>of</strong> heterotrophic organisms which were<br />
largest for Cruise I . The presence <strong>of</strong> oil did not significantly<br />
affect activity rates by either the composites or by<br />
the pure culture (Enterobacter sp .) isolated from Primary<br />
Platform P1 during Cruise II (Fig . 21) .<br />
8 . Phosphorus Uptake<br />
None <strong>of</strong> the composite sediment samples demonstrated<br />
detectable phosphorus uptake (see Table 50) . In<br />
order to determine if the lack <strong>of</strong> activity might be due to<br />
an effect <strong>of</strong> freezing the samples prior to analysis, four<br />
<strong>of</strong> the eight composites tested during Cruise III were<br />
fresh (never frozen) . Again ; however, no detectable activity<br />
was demonstraed . The cause <strong>of</strong> this lack <strong>of</strong> activity<br />
is ; therefore, most probably the lack <strong>of</strong> a sufficient<br />
carbon source . Because the sediments exhibited no<br />
phosphorus uptake, there could be no inhibitory effect<br />
due to the presence <strong>of</strong> added oil .<br />
9. Lipolysis<br />
Most <strong>of</strong> the 48 composite samples demonstrated<br />
low-level but statistically significant rates <strong>of</strong> lipolytic activity,<br />
with an average <strong>of</strong> 93 Mg <strong>of</strong> tripalmitin being converted<br />
to COZ per ml <strong>of</strong> sediment per day, and a<br />
212
maximum <strong>of</strong> 269 pg/day (see Tables 51-53) . Platform<br />
P1 and Control Site C21 demonstrated the highest rates<br />
<strong>of</strong> activity, while Platform P2 showed the lowest . There<br />
was no detectable difference among cruises, but lipolysis<br />
was the only one <strong>of</strong> the carbonaceous processes in<br />
which platform sites as a whole showed less activity than<br />
did control sites . The addition <strong>of</strong> oil to the test systems<br />
had no significant effect on the rate <strong>of</strong> lipolysis . Similar<br />
results were obtained with both <strong>of</strong> the pure cultures<br />
(Pseudomonas sp . 5 and 7) isolated during Cruise II<br />
(Fig . 30) .<br />
10. Chitinolysis<br />
Chitinolysis was the least consistent <strong>of</strong> the processes<br />
studied, with much variation among sites and<br />
among cruises, as was shown in Table 54-56. An average<br />
<strong>of</strong> 82 Mg <strong>of</strong> chitin was converted to COZ per ml <strong>of</strong><br />
sediment per day, with a maximum observed rate <strong>of</strong><br />
414 Ng/day . Chitinolysis was the only one <strong>of</strong> the carbonaceous<br />
processes which demonstrated an impact <strong>of</strong> oil,<br />
with depressed activity as a result <strong>of</strong> exposure to oil observed<br />
during Cruise I . However, there was no significant<br />
impact <strong>of</strong> oil detected during the other two cruises,<br />
and oil did not affect chitinolysis by either <strong>of</strong> the two<br />
pure cultures (Pseudomonas sp . 6 and 8) isolated during<br />
Cruise II (see Fig . 31) .<br />
11 . Cellulolysis<br />
Most <strong>of</strong> the 48 composite samples demonstrated<br />
low-level but statistically significant rates <strong>of</strong> cellulolytic<br />
activity, with an average <strong>of</strong> 55 Ng <strong>of</strong> cellulose<br />
being converted to CO per ml <strong>of</strong> sediment per day (with<br />
a maximum <strong>of</strong> 172 Mg/day) as was shown in Tables 57-<br />
59. There were no significant differences between platform<br />
and control sites or among cruises, but Control<br />
Site C24 consistently showed the lowest level <strong>of</strong> activity .<br />
Although all rates were low, there was no indication<br />
that oil had any effect on cellulolysis by the composites<br />
or by either <strong>of</strong> the two pure cultures (Cellulomonassp . 1<br />
and 2) isolated during Cruise II (see Fig . 29) .<br />
12. Proteolysis<br />
All <strong>of</strong> the 48 composite samples demonstrated<br />
definite proteolytic activity (see Tables 60-62), averaging<br />
320 Mg protein per ml sediment per day . Although<br />
this rate is lower than that for glucose utilization, the<br />
proteolytic cultures did not appear to reach stationary<br />
phase until virtually all (>90%) <strong>of</strong> the protein had been<br />
degraded to COZ . This is most probably due to the fact<br />
that the protein also served as a source <strong>of</strong> nitrogen,<br />
which was the probable rate-limiting nutrient for heterotrophic<br />
activity . Platform Site P1 was consistently<br />
the most active site, but in general there was no significant<br />
difference between platforms and controls or<br />
among cruises . The addition <strong>of</strong> oil had no effect on the<br />
amount <strong>of</strong> COZ produced from protein by the composite<br />
samples or by either <strong>of</strong> the two pure cultures<br />
(Pseudomonassp . 3 and 4) isolated during Cruise II (see<br />
Fig . 27) .<br />
E. Recommendations for Further Studies<br />
We recommend a continuation <strong>of</strong> the existing program<br />
for a 2-year period with the following modifications<br />
:<br />
1 . Redesign studies to take river flow into account<br />
. This should include some secondary<br />
platforms wherein background data are in<br />
hand . Sample replication can be increased and<br />
stations can be expanded by eliminating directional<br />
stations at each site .<br />
2 . Study vertical pr<strong>of</strong>ile <strong>of</strong> sediments and near<br />
bottom water . Since surficial sediments are in<br />
a constant state <strong>of</strong> flux, deeper cores might<br />
show correlations between microbial populations,<br />
hydrocarbon pr<strong>of</strong>ile, and other parameters<br />
such as trace elements . Obviously more<br />
meaningful comparisons <strong>of</strong> data may be made<br />
and might . reflect on the history <strong>of</strong> the area .<br />
3 . Analyze samples for total bacterial numbers,<br />
sulfate-reducing hydrocarbonoclasts and<br />
nitrate-reducing hydrocarbonoclasts and eliminate<br />
microbial processes and nutrient chemistry<br />
. Most <strong>of</strong> the processes do not occur at levels<br />
which would yield statistical or biological<br />
significance, and we have obtained sufficient<br />
data on the ones that do occur .<br />
Expand program to include evaluation <strong>of</strong> fish,<br />
sediments, and near-bottom water samples for<br />
enumeration <strong>of</strong> Vibrio species . Existing literature<br />
has suggested that indirect effects <strong>of</strong> crude<br />
oil may make Vi6rio diseases more prevalent<br />
(tiles et al ., 1978) . Fin rot has been observed<br />
in fish around the oil platforms and this study<br />
might yield information on chronic effects <strong>of</strong><br />
low levels <strong>of</strong> oil in the area .<br />
5. Evaluate microbial populations in terms <strong>of</strong><br />
changes in a variety <strong>of</strong> types based on carbon<br />
utilization as monitored by replicate plate<br />
techniques .<br />
6 . Analyze sediments for ability to support<br />
growth via bioassay techniques . Sediments deficient<br />
in nutrients and/or toxic material could<br />
be detected by introducing a known amount <strong>of</strong><br />
a specific microbial species in the <strong>part</strong>icular<br />
sediment and monitoring the decrease or increase<br />
in total numbers . This study might indicate<br />
ways <strong>of</strong> accelerating treatment <strong>of</strong> oil<br />
spills .<br />
213
V. CONCLUSIONS<br />
At times there were statistically significant differences<br />
between the microbial population <strong>of</strong> the sediment<br />
at platform sites and control sites, while at other times<br />
no differences were found . Essentially no difference was<br />
found between the chemical nutrients at the control sites<br />
as compared to the platform sites . However since most<br />
<strong>of</strong> the microbial activity takes place in the upper portion<br />
<strong>of</strong> the sediments, it is easily influenced by currents,<br />
storms, etc . Therefore, while microbial differences in<br />
the surficial sediments may be brought about by man's<br />
activity, nature redistributes the sediments to such an<br />
extent that meaningful cause and effect relationships are<br />
obscured . The impact <strong>of</strong> river flow and currents were<br />
clearly indicated in the results obtained from Cruise II<br />
in which statistically significant differences in microbial<br />
populations were correlated with geographic location .<br />
These considerations lead to the conclusion that nature's<br />
activity masked man's activity . Since only the top<br />
one to two centimeters <strong>of</strong> sediment were analyzed in this<br />
investigation, the impacts <strong>of</strong> river flow and currents<br />
were magnified .<br />
Experiments to determine the magnitude <strong>of</strong>, and the<br />
impact <strong>of</strong> oil on, microbial processes in the sediments<br />
were designed to reflect conditions closely approximating<br />
the natural environment . No evidence was obtained<br />
to indicate that any <strong>of</strong> the reasonably active microbial<br />
processes were adversely affected by low levels <strong>of</strong> oil .<br />
There was essentially no difference between the oildegrading<br />
potential <strong>of</strong> the sediments from the control<br />
sites as compared to the platforms . While the laboratory<br />
data indicated a maximum oil-degrading potential <strong>of</strong> 56<br />
kg hydrocarbon-carbon oxidized to carbon dioxide per<br />
ml <strong>of</strong> sediment per twenty-four hours, the actual rate in<br />
situ might be less at certain times due to lack <strong>of</strong> adequate<br />
oxygen .<br />
It was concluded that freezing sediment samples immediately<br />
after collection did not adversely affect the<br />
microbial enumeration results, provided that the frozen<br />
samples were analyzed within seven days .<br />
215
VI . ACKNOWLEDGEMENTS<br />
We express our appreciation to Dr . Tom Kellogg, Director<br />
<strong>of</strong> the Mississippi State University Radioisotope<br />
Center, for his technical assistance with radioisotopic<br />
procedures ; to Dr . Ray Heiser <strong>of</strong> The Mississippi State<br />
University De<strong>part</strong>ment <strong>of</strong> Statistical Services for his assistance<br />
in the statistical analysis <strong>of</strong> the data ; to Ms .<br />
Mary Jane Coign for the chemical analysis <strong>of</strong> oil in various<br />
test systems ; to Ms . Susan Brown, Ms . Annette<br />
Benton, Ms . Susan Benton, Ms . Mary Randolph, Ms .<br />
Ann Ardahl, Ms . Page Coggin, Dr . Hazel Aranha, Dr .<br />
Doug Minchew, Mr . Ge<strong>of</strong>f Frank, Mr . Kenneth Swan,<br />
Mr . Kenny Jeanes, Mr . Bill Greenleaf, Mr . Melford<br />
Smith, Mr . John Burczak, Mr . Tom Saunders, and Mr .<br />
Carlos Dobbel for their aid in the microbial enumerations,<br />
sediment chemistry, and microbial processes ; to<br />
Mr . E .E . Bailey and Mr . Ken Parish <strong>of</strong> the Mississippi<br />
State Chemical Laboratory for analyzing Kjeldahl nitrogen<br />
and total phosphorus in the sediments ; to Ms .<br />
Jane Benyo for typing this manuscript ; and finally Mr .<br />
Wayne Reed and the Purchasing De<strong>part</strong>ment <strong>of</strong> Mississippi<br />
State University need special acknowledgement for<br />
the expedient and pr<strong>of</strong>essional manner in which they<br />
handled some extraordinary demands placed on their<br />
de<strong>part</strong>ment .<br />
217
VII. LITERATURE CITED<br />
Ahearn, D.G ., and S.P . Meyers . 1972 . The role <strong>of</strong> fungi<br />
in the decomposition <strong>of</strong> hydrocarbons in the<br />
marine environment, pp . 12-18 . In Biodeterioration<br />
<strong>of</strong> materials . Vol . 3 . Applied Science<br />
Publishers, London, England .<br />
Ahearn, D.G ., and S .P . Meyers [ed .] 1973 . The microbial<br />
degradation <strong>of</strong> oil pollutants . Center for<br />
Wetland Resources . LSU Publ . No . LSU-SG-<br />
73-101 . 322 p .<br />
Ahearn, D.G ., S .P . Meyers, and P.G . Standard . 1971 .<br />
The role <strong>of</strong> yeasts in the decomposition <strong>of</strong> oils<br />
in marine environments . Ind . Microbiol .<br />
12:126-134 .<br />
American Public Health Association . 1975 . Standard<br />
methods for the examination <strong>of</strong> water and<br />
wastewater . 14th edition . American Public<br />
Health Association, New York .<br />
Anonymous . 1969 . Conference on prevention and control<br />
<strong>of</strong> oil spills . American Petroleum Institute<br />
and Federal Water Pollution Control Administration<br />
. American Petroleum Institute,<br />
Washington, D.C .<br />
Anonymous . 1971 . Conference on prevention and control<br />
<strong>of</strong> oil spills . Environmental Protection<br />
Agency and U .S . Coast Guard . American Petroleum<br />
Institute, Washington, D.C .<br />
Anonymous . 1973 . Conference on prevention and control<br />
<strong>of</strong> oil pollution . American Petroleum Institute,<br />
Environmental Protection Agency and<br />
U .S . Coast Guard . American Petroleum Institute,<br />
Washington, D .C .<br />
Anonymous . 1974 . Research needed to determine chronic<br />
effects <strong>of</strong> oil on the marine environmentworkshop<br />
proceedings . Exxon, Houston,<br />
Texas . 43 p .<br />
Anonymous . 1975 . Conference on prevention and control<br />
<strong>of</strong> oil pollution . American Petroleum Institute,<br />
Environmental Protection Agency and<br />
U .S . Coast Guard . American Petroleum Institute,<br />
Washington, D.C .<br />
Anonymous . 1976 . Sources, effects and sinks <strong>of</strong> hydrocarbons<br />
in the aquatic environment . American<br />
Institute <strong>of</strong> Biological Sciences, Washington,<br />
D.C . 578 p .<br />
Anonymous . 1977 . Conference on prevention and control<br />
<strong>of</strong> oil pollution . American Petroleum Institute,<br />
Environmental Protection Agency and<br />
U .S . Coast Guard . American Petroleum Institute,<br />
Washington, D.C .<br />
Anonymous . 1979 . Conference on prevention and control<br />
<strong>of</strong> oil pollution . American Petroleum Institute,<br />
Environmental Protection Agency and<br />
U .S . Coast Guard . American Petroleum Institute,<br />
Washington, D.C .<br />
Anonymous . 1981 . Conference on prevention and control<br />
<strong>of</strong> oil pollution . American Petroleum Institute,<br />
Environmental Protection Agency and<br />
U .S . Coast Guard . American Petroleum Institute,<br />
Washington, D .C .<br />
Anthony, E .H . 1963 . Regional variability <strong>of</strong> bacteria in<br />
North Atlantic sediments, pp . 532-552 . In C.H .<br />
Oppenhiemer [ed .] Symposium on marine<br />
microbiology . Charles C . Thomas, Springfield,<br />
Mass .<br />
Atlas, R.M . 1981 . Microbial degradation <strong>of</strong> petroleum<br />
hydrocarbons : an environmental prospective.<br />
Microbiol . Rev . 45 :180-209 .<br />
Atlas, R.M ., and R . Bartha . 1973 . Fate and effects <strong>of</strong><br />
polluting petroleum in the marine environment<br />
. Residue Rev . 49 :49-85 .<br />
Blumer, M ., P . Blolkker, E.B . Cowell, and D.F . Duckworth<br />
. 1972 . Petroleum, p . 19- . In E.G . Goldberg<br />
[ed .] A guide to marine pollution . Gordon<br />
and Breach, New York .<br />
Blumer, M ., and J . Sass . 1972a . Oil pollution : persistence<br />
and degradation <strong>of</strong> spilled fuel oil .<br />
Science 176 :1120-1122 .<br />
Blumer, M ., and J . ;sass . 19726 . The West Falmouth oil<br />
spill II . Chemistry . Woods Hole Oceanographic<br />
Institution, Woods Hole, Mass . 90 p .<br />
Boesch, D.F ., C .H . Hershner, and J.H . Milgram . 1974 .<br />
Oil spills and the marine environment . Ballinger<br />
Publishing Co ., Cambridge, Mass . 114<br />
P~<br />
Bourne, W.R .P . 1968 . Effects <strong>of</strong> oil pollution on bird<br />
populations, p . 99-128 . !n J.D . Carthy and<br />
D.R . Arthur [ed .] The biological effects <strong>of</strong> oil<br />
pollution on littoral communities, Field Studies<br />
Council ., London .<br />
Brown, L .R . 1980 . Fate and effect <strong>of</strong> oil in the aquatic<br />
environment Gulf Coast Region . Final Rep .<br />
on Contract No . 68-01-0745 . U .S . Environmental<br />
Protection Agency . 101 p .<br />
Brown, L.R ., M. Light, and C.D . Minchew . 1980 . Geographic<br />
distribution <strong>of</strong> petroleum hydrocarbons<br />
in surficial bottom sediments <strong>of</strong> the Gulf<br />
<strong>of</strong> Mexico, pp. 181-205 . In R.A . Geyer [ed .]<br />
Marine environmental pollution, 1 : Hydrocarbons<br />
. Elsevier Scientific Publishing Co .,<br />
Amsterdam, The Netherlands .<br />
Brown, L.R ., and C .'.D . Minchew . 1978 . The analysis <strong>of</strong><br />
sediment samples for hydrocarbons . Final<br />
Rep . for Contract No . DOT-CG-81-76-1476 .<br />
October 30, 1978 . (A Scientific Study to Develop<br />
One or More Practical Methods for the<br />
Accurate Assessment <strong>of</strong> an Oil Spill Cleanup) .<br />
Brown, L.R ., W .E ; . Phillips, G .S . Pabst, and C.M .<br />
Ladner . 1969 . Physical, chemical, and microbiological<br />
changes occurring during degradation<br />
<strong>of</strong> oil in aquatic and brackish water environments<br />
. In Proc . <strong>of</strong> ASME Winter Annual<br />
Meeting . Los Angeles, California .<br />
Buck, J.D ., and R.C . Cleverdon . 1960 . The spread<br />
plate as a method for the enumeration <strong>of</strong> marine<br />
bacteria . Limnol . Oceanogr . 5:78-50.<br />
Caparello, D.M ., and P.A . Larock . 1975 . A radioisotope<br />
assay for the quantification <strong>of</strong> hydrocarbon<br />
biodegradation potential in environmental<br />
samples . Microbiol. Ecol . 2 :28-42 .<br />
Carthy, J . D ., and D . R . Arthur . 1968 . The biological effects<br />
<strong>of</strong> oil pollution on littoral communities .<br />
Field Studies Council, Institute <strong>of</strong> Petroleum,<br />
London .<br />
219
Coler, R.A ., and H .B . Gunner . 1969. Microbial populations<br />
as determinants in protozoan succession<br />
. Water Res . 3:149-156 .<br />
Colwell, R.R ., and J.D . Walker . 1977 . Ecological aspects<br />
<strong>of</strong> microbial degradation <strong>of</strong> petroleum in<br />
the marine environment . CRC Critical Rev .<br />
Microbiol . 4:423-445 .<br />
Colwell, R.R ., and J.D . Walker, and J .D . Nelson, Jr .<br />
1973 . Microbial ecology and the problem <strong>of</strong><br />
petroleum degradation in Chesapeake Bay,<br />
pp . 185-197 . In D.G . Ahearn and S.P . Meyers<br />
[ed .] The microbial degradation <strong>of</strong> oil pollutants<br />
. Center for Wetland Resources . LSU<br />
Publ . No . LSU-SG-73-O1 .<br />
Colwell, R.R ., J.D . Walker, B.F . Conrad, and P.A .<br />
Seesman . 1976 . Microbiological studies <strong>of</strong> Atlantic<br />
Ocean water and sediment from potential<br />
<strong>of</strong>f-shore drilling sites . Develop . Ind . Microbiol<br />
. 17 :269-282 .<br />
Conrad, B .F ., J.D . Walker, and R.R . Colwell . 1976 .<br />
Utilization <strong>of</strong> crude oil and mixed hydrocarbon<br />
substrate by Atlantic Ocean microorganisms<br />
. Dev . Ind . Microbiol . 17 :283-292 .<br />
Cowell, E.B . [ed .] 1971 . The ecological effects <strong>of</strong> oil<br />
pollution on littoral communities . Applied Science<br />
Publishers, Ltd ., Essex, England . 248 p .<br />
Crow, S.A ., S.P . Meyers, and D.G . Ahearn . 1974 . Microbiological<br />
aspects <strong>of</strong> petroleum degradation<br />
in the aquatic environment . La Mer 12 :37 .<br />
Davis, J.B . 1967 . Petroleum microbiology . Elsevier,<br />
New York .<br />
D'Emidio, J .A . 1972 . Moderator, Proc . Navy Oil Spill<br />
Conf . Naval Ordinance Laboratory, White<br />
Oak, Maryland . 273 p .<br />
Dubos, R . 1928 . The decomposition <strong>of</strong> cellulose by aerobic<br />
bacteria. J. Bacteriol . 15:223-234 .<br />
Freide, J ., P . Guire, R.K . Gholson, E . Gandy, and A.F .<br />
Gandy, Jr . 1972 . Assessment <strong>of</strong> biodegradation<br />
potential for controlling oil spills on the<br />
high seas . Rep . No . 4110 .1#3 .1, U .S . Coast<br />
Guard Office <strong>of</strong> Research and Development,<br />
Washington, D .C . 130 p .<br />
Giles, R.C ., L.R . Brown, and C.D . Minchew . 1978 .<br />
Bacteriological aspects <strong>of</strong> fin erosion in mullet<br />
exposed to crude oil . J. Fish . Biol . 13:113-117 .<br />
Hada, H .S ., and R .K . Sizemore . 1981 . Incidence <strong>of</strong><br />
plasmids in marine Vibrio spp . isolated from<br />
and oil field in the northwestern Gulf <strong>of</strong> Mexico<br />
. Appl . Environ . Microbiol . 41 :199-202 .<br />
Hepple, P . [ed .] 1971 . Water pollution by oil . Applied<br />
Science Publishers, London . 399 p .<br />
Holmes, R.W ., and F.A . Dewitt, Jr . 1970 . Santa Barbara<br />
Oil Symposium . University <strong>of</strong> California,<br />
Santa Barbara .<br />
Hoult, D.P . 1969 . Oil on the sea . Proc . Symposium on<br />
the scientific and engineering aspects <strong>of</strong> oil<br />
pollution <strong>of</strong> the sea . Plenum Press, New York .<br />
114 p .<br />
Huang, W.H . 1981 . Ecological investigations <strong>of</strong> petroleum<br />
production platforms in the central Gulf<br />
<strong>of</strong> Mexico . Vol . I :Pollutant fate and effects<br />
studies . Part 2 ~/3 Sediment physical characterization<br />
. Final Rep . Bureau <strong>of</strong> Land Management<br />
. Southwest Research Institute, Houston,<br />
Texas .<br />
Johnston, R. 1970 . The decomposition <strong>of</strong> crude oil residues<br />
in sand columns . J . Mar . Biol . Ass. U .K .<br />
50 :925-937 .<br />
Marx, W . 1971 . Oilspill . Sierra Club, San Francisco,<br />
California .<br />
Miles, D.H ., M .J . Coign, and L.R . Brown . 1977 . A liquid<br />
chromatographic fluorescence technique<br />
for estimating crude oil in water, sediment,<br />
and biological material . In Proceedings 1977<br />
Oil Spills Conference, March 8-10, 1977, New<br />
Orleans, LA .<br />
Moulder, D .S ., and A . Varley . 1971 . A bibliography on<br />
marine and estuarine oil pollution . Marine<br />
Biology Assoc ., U.K . 129 p .<br />
Moulder, D .S ., and A . Varley, 1975 . A bibliography on<br />
marine and estuarine oil pollution, supplement<br />
. Marine Biology Assoc ., U.K ., N.Y . 152<br />
P~<br />
Murisawa, M . 1968 . Streams, their dynamics and morphology<br />
. McGraw-Hill Book Company, N .Y .<br />
National Academy <strong>of</strong> Sciences . 1975 . Petroleum in the<br />
marine environment . Proc . <strong>of</strong> workshop on inputs,<br />
fates and the effects <strong>of</strong> petroleum in the<br />
marine environment, May 21-25, 1973 . Ocean<br />
Affairs Board, National Research Council.<br />
107 p .<br />
Nelson-Smith, A . 1973 . Oil pollution and marine ecology<br />
. Plenum Press, New York, N.Y . 260 p .<br />
OCS Environmental Assessment Program . 1979 . Environmental<br />
assessment <strong>of</strong> the Alaskan continental<br />
shelf V . Receptors 1/3 Microbiology, contaminant<br />
baseline . NOAH and BLM, Washington,<br />
D.C . 698 p .<br />
Olsen, K.D ., and R .K . Sizemore . 1981 . Effects <strong>of</strong> an established<br />
<strong>of</strong>fshore oil platform on the autochthonous<br />
bacterial community . Develop . Ind .<br />
Microbiol . In press .<br />
Oppenheimer, C.H ., R. Miget, and H . Kator . 1974. Hydrocarbons<br />
in seawater and organisms and microbiological<br />
investigations . Gulf Univ . Res .<br />
Consortium, Offshore Ecol . Invest ., Project<br />
No . OE73HJM .<br />
Oppenheimer, C.H ., S . Siegel, L . Day, and C . Duncan .<br />
1980 . Distribution <strong>of</strong> hydrocarbon-oxidizing<br />
bacteria on the Georgia Shelf area and oil-degrading<br />
activities, pp . 265-290 . In R.A . Geyer<br />
[ed .] Marine environmental pollution, 1 : Hydrocarbons<br />
. Elsevier Scientific Publishing<br />
Co ., Amsterdam, the Netherlands .<br />
Oujesky, H ., W . Brooks, B . Smith, and B . Hamilton .<br />
1979 . Water column bacteriological studies <strong>of</strong><br />
the South Texas Outer Continental Shelf . Develop<br />
. Ind . Microbiol . 20 :695-703 .<br />
Samson, A.L ., J.H . Vandermuelen, P .O . Wells, and C .<br />
Moyse . 1980 . A selected bibliography on the<br />
fate and effects <strong>of</strong> oil pollution relevant to the<br />
Canadian marine environment . Report No .<br />
EPS3-EC-80-5, Environment Canada, Ottawa<br />
. 191 p .<br />
Schwartz, J .R ., S .K . Alexander, C .S . Giam, and H .S .<br />
Chan . 1980 . Analysis <strong>of</strong> benthic bacteria, pp .<br />
438-468 . In R.W . Flint and N.N . Rabalais<br />
[ed .] Environmental studies, South Texas<br />
Outer Continental Shelf, 1975-1977 . Vol . III .<br />
220
Contract No . AA551-CT8-51, BLM, De<strong>part</strong>ment<br />
<strong>of</strong> Interior, Washington, D .C .<br />
Seesman, P.A ., J.D . Walker, and R.R . Colwell . 1976 .<br />
Biodegradation <strong>of</strong> oil by marine microorganisms<br />
at potential <strong>of</strong>f-shore drilling sites . Dev .<br />
Ind . Microbiol . 17:293-298 .<br />
Sharpley, J .M . 1966 . Elementary petroleum microbiology<br />
. Gulf Publishing, Houston, Texas .<br />
Simidu, U . 1974 . Improvement <strong>of</strong> media for enumeration<br />
and isolation <strong>of</strong> heterotrophic bacteria in<br />
seawater, pp . 249-257 . In R.R . Colwell and<br />
R.Y . Morita [ed .] Effect <strong>of</strong> ocean environment<br />
on microbial activities . University Park Press,<br />
Baltimore MD .<br />
Sizemore, R.K ., and K . Olsen . 1980 . Bacterial communities<br />
. Vol . IV . In W.B . Jackson and E.P . Wilkins<br />
[ed .] Environmental assessment <strong>of</strong> Buccaneer<br />
gas and oil field in the Northwestern Gulf<br />
<strong>of</strong> Mexico, 1978-1979 . Nat . Mar . Fish . Serv .,<br />
Southeast Fish . Center .<br />
Skerman, V .B .D . 1967 . A guide to the identification <strong>of</strong><br />
the genera <strong>of</strong> bacteria . The Williams and Wilkins<br />
Company, Baltimore, MD .<br />
Stewart, J.E ., and L .J . Marks . 1978 . Distribution and<br />
abundance <strong>of</strong> hydrocarbon-utilizing bacteria<br />
in sediments <strong>of</strong> Chedabutto Bay, Nova Scotia,<br />
in 1976 . J . Fish . Res . Board Can . 35:581-584 .<br />
Templeton, W.L ., E.A . Sutton, R.M . Bean, R.C . Arnett,<br />
J .W . Blaylock, and R.E . Wildung, 1975 .<br />
Oil pollution studies on Lake Maracaibo, Venezuela,<br />
pp . 489-496 . In Conference on Prevention<br />
and Control <strong>of</strong> Oil Pollution . American<br />
Petroleum Institute .<br />
Texas Instruments . 1979 . South Atlantic OCS Benchmark<br />
Program . Vol . 3 . BLM, Washington,<br />
D.C . 474 p .<br />
University <strong>of</strong> Texas Marine Science Institute . 1979 . Environmental<br />
studies South Texas OCS . Bureau<br />
<strong>of</strong> Land Management, Washington, D.C .<br />
Walker, J .D ., and R.R . Colwell . 1975 . Factors affecting<br />
enumeration and isolation <strong>of</strong> actinomycetes<br />
from Chesapeake Bay and Southeastern<br />
Atlantic ocean sediments . Mar . Biol . 30 :193-<br />
201 .<br />
Walker, J.D ., and R.R . Colwell . 1976a. Petroleum : Degradation<br />
by estuarine microorganisms, pp .<br />
197-204 . In Biodeterioration <strong>of</strong> materials . Vol .<br />
3 . Applied Science Publishers, London,<br />
England .<br />
Walker, J.D ., and R .R . Colwell. 19766. Enumeration<br />
<strong>of</strong> petroleum-degrading microorganisms . Appl .<br />
Environ . Microbiol . 31 :198-207 .<br />
Walker, J.D ., J.J . Calomiri, T.L . Herbert, and R.R .<br />
Colwell . 1976 . Petroleum hydrocarbons : Degradation<br />
and growth potential for Atlantic<br />
Ocean bacteria . Mar . Biol . 34 :1-9 .<br />
Walker, J.D ., and It.R . Colwell . 1974 . Microbial degradation<br />
<strong>of</strong> model petroleum at low temperatures<br />
. Microbial Ecol . 1 :63-95 .<br />
Walker, J.D ., P.A . Seesman, T.L . Herbert, and R.R .<br />
Colwell . 1976 . Petroleum hydrocarbons : degradation<br />
and growth potential <strong>of</strong> deep-sea<br />
sediment bacteria . Environ. Pollut . 10 :89-99 .<br />
Walker, J.D ., B.F . Conrad, P.A . Seesman, and R.R .<br />
Colwell . 1977 . Comparison <strong>of</strong> membrane filter<br />
counts and plate counts on heterotrophic and<br />
oil agar used to estimate populations <strong>of</strong> yeast,<br />
fungi and bacteria . In R.H . Bordner, C.F .<br />
Frith, and J.A . Winter [ed .] Symposium on recovery<br />
<strong>of</strong> indicator organisms employing<br />
membrane filters . U .S . E.P.A ., Cincinnati,<br />
Ohio .<br />
Walton, S . 1981 . Troubled waters : Academy looks<br />
again at petroleum in the marine environment .<br />
BioScience 31 :93-96 .<br />
Ward, C.H ., M.E . Bender, and D .J . Reish [ed .] 1979 .<br />
The <strong>of</strong>fshore ecology investigation . Effects <strong>of</strong><br />
oil drilling and production in a coastal environment<br />
. Rice Univ . Stud . 65(4'/35) :1-589 .<br />
Wyman, J .F ., and L.R . Brown . 1975 . Microbial degradation<br />
<strong>of</strong> :Empire Mix crude oil . Dev . Ind . MicrobioL<br />
17:321-320 .<br />
Zafiriou, O ., M . Blumer, and J . Myers . 1972 . Correlation<br />
<strong>of</strong> oils and oil products by gas chromatography<br />
. Report No . 72-55 . Woods Hole<br />
Oceanographic Institution, Woods Hole,<br />
Mass . 110 p .<br />
ZoBell, C.E . 1941 . Studies on marine bacteria . 1 . The<br />
cultural requirements <strong>of</strong> heterotrophic aerobes<br />
. J . Mar. Res . 4 :42-75 .<br />
ZoBell, C .E . 1954 . Marine bacteria and fungi in the<br />
Gulf <strong>of</strong> Mexico . Fish . Bull . Fish and Wild .<br />
Serv.55 :217-222 .<br />
ZoBell, C.E . 1969 . Microbial modification <strong>of</strong> crude oil<br />
in the sea, pp . 317-326 . In Joint Conf . on Prevention<br />
and Control <strong>of</strong> Oil Spills . American<br />
Petroleum Institute, Washington, D.C .<br />
221
VIII . PUBLICATIONS RESULTING FROM THIS STUDY<br />
A. Published<br />
1 . Ardahl, A . 1979 . Studies on the biological oxidation<br />
<strong>of</strong> ammonium to nitrite . Masters Thesis<br />
. Mississippi State University .<br />
2 . Brown, L .R ., K.L . Jeanes, W.F . Greenleaf,<br />
and G . Frank . Oil -degrading potential <strong>of</strong> surficial<br />
sediments near oil-producing platforms,<br />
pp . 725-730 . In Proc . 1981 Oil Spill Conference,<br />
Atlanta, Ga . EPA, API, USCG .<br />
3 . Childers, G .W ., R.W . Landers, H.G . Aranha,<br />
A.H . Ardahl, M .S . Randolph, and L.R .<br />
Brown . Effect <strong>of</strong> crude oil on microbial pro-<br />
cesses in marine sediments, pp . 731-735 . Proc .<br />
1981 Oil Spill Conference, Atlanta, Ga. EPA,<br />
API, USCG .<br />
B . In Preparation<br />
1 . Effect <strong>of</strong> freezing on total bacterial numbers in<br />
marine sediments .<br />
2 . Comparisons <strong>of</strong> the microbial ecology and<br />
sediment chemistry found at selected petroleum<br />
platform sites and non-petroleum-producing<br />
areas in the north-central Gulf <strong>of</strong> Mexico<br />
.<br />
223
The De<strong>part</strong>ment <strong>of</strong> the Interior Mission<br />
As the Nation's principal conservation agency, the De<strong>part</strong>ment <strong>of</strong> the Interior has responsibility<br />
for most <strong>of</strong> our nationally owned public lands and natural resources. This includes fostering<br />
sound use <strong>of</strong> our land and water resources; protecting our fish, wildlife, and biological diversity;<br />
preserving the environmental and cultural values <strong>of</strong> our national parks and historical places;<br />
and providing for the enjoyment <strong>of</strong> life through outdoor recreation. The De<strong>part</strong>ment assesses<br />
our energy and mineral resources and works to ensure that their development is in the best<br />
interests <strong>of</strong> all our people by encouraging stewardship and citizen <strong>part</strong>icipation in their care.<br />
The De<strong>part</strong>ment also has a major responsibility for American Indian reservation communities<br />
and for people who live in island territories under U.S. administration.<br />
The Minerals Management Service Mission<br />
As a bureau <strong>of</strong> the De<strong>part</strong>ment <strong>of</strong> the Interior, the Minerals Management Service's (MMS)<br />
primary responsibilities are to manage the mineral resources located on the Nation's Outer<br />
Continental Shelf (OCS), collect revenue from the Federal OCS and onshore Federal and Indian<br />
lands, and distribute those revenues.<br />
Moreover, in working to meet its responsibilities, the Offshore Minerals Management Program<br />
administers the OCS competitive leasing program and oversees the safe and environmentally<br />
sound exploration and production <strong>of</strong> our Nation's <strong>of</strong>fshore natural gas, oil and other mineral<br />
resources. The MMS Minerals Revenue Management meets its responsibilities by ensuring the<br />
efficient, timely and accurate collection and disbursement <strong>of</strong> revenue from mineral leasing and<br />
production due to Indian tribes and allottees, States and the U.S. Treasury.<br />
The MMS strives to fulfill its responsibilities through the general guiding principles <strong>of</strong>: (1) being<br />
responsive to the public's concerns and interests by maintaining a dialogue with all potentially<br />
affected <strong>part</strong>ies and (2) carrying out its programs with an emphasis on working to enhance the<br />
quality <strong>of</strong> life for all Americans by lending MMS assistance and expertise to economic<br />
development and environmental protection.