Vol.1 part 4-5 - Department of Invertebrate Zoology
Vol.1 part 4-5 - Department of Invertebrate Zoology
Vol.1 part 4-5 - Department of Invertebrate Zoology
You also want an ePaper? Increase the reach of your titles
YUMPU automatically turns print PDFs into web optimized ePapers that Google loves.
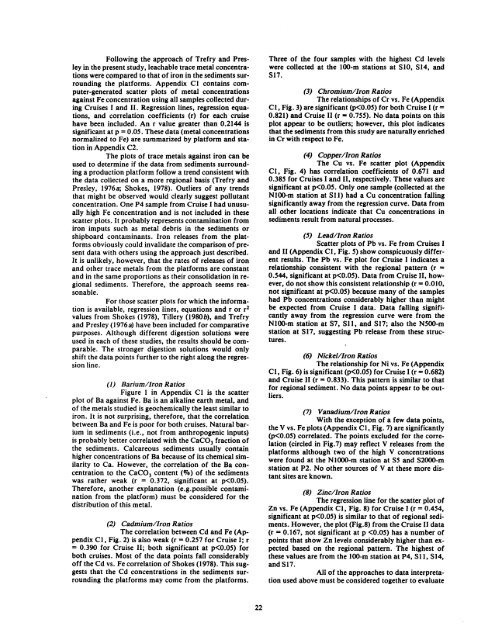
Following the approach <strong>of</strong> Trefry and Presley<br />
in the present study, leachable trace metal concentrations<br />
were compared to that <strong>of</strong> iron in the sediments surrounding<br />
the platforms . Appendix C1 contains computer-generated<br />
scatter plots <strong>of</strong> metal concentrations<br />
against Fe concentration using all samples collected during<br />
Cruises I and II . Regression lines, regression equations,<br />
and correlation coefficients (r) for each cruise<br />
have been included . An r value greater than 0.2144 is<br />
significant at p = 0 .05 . These data (metal concentrations<br />
normalized to Fe) are summarized by platform and station<br />
in Appendix C2 .<br />
The plots <strong>of</strong> trace metals against iron can be<br />
used to determine if the data from sediments surrounding<br />
a production platform follow a trend consistent with<br />
the data collected on a more regional basis (Trefry and<br />
Presley, 1976a ; Shokes, 1978) . Outliers <strong>of</strong> any trends<br />
that might be observed would clearly suggest pollutant<br />
concentration . One P4 sample from Cruise I had unusually<br />
high Fe concentration and is not included in these<br />
scatter plots . It probably represents contamination from<br />
iron imputs such as metal debris in the sediments or<br />
shipboard contaminants . Iron releases from the platforms<br />
obviously could invalidate the comparison <strong>of</strong> present<br />
data with others using the approach just described .<br />
It is unlikely, however, that the rates <strong>of</strong> releases <strong>of</strong> iron<br />
and other trace metals from the platforms are constant<br />
and in the same proportions as their consolidation in regional<br />
sediments . Therefore, the approach seems reasonable<br />
.<br />
For those scatter plots for which the information<br />
is available, regression lines, equations and r or rz<br />
values from Shokes (1978), Tillery (19806), and Trefry<br />
and Presley (1976a) have been included for comparative<br />
purposes . Although different digestion solutions were<br />
used in each <strong>of</strong> these studies, the results should be comparable<br />
. The stronger digestion solutions would only<br />
shift the data points further to the right along the regression<br />
line .<br />
(1) Barium/Iron Ratios<br />
Figure 1 in Appendix C1 is the scatter<br />
plot <strong>of</strong> Ba against Fe . Ba is an alkaline earth metal, and<br />
<strong>of</strong> the metals studied is geochemically the least similar to<br />
iron . It is not surprising, therefore, that the correlation<br />
between Ba and Fe is poor for both cruises . Natural barium<br />
in sediments (i .e ., not from anthropogenic inputs)<br />
is probably better correlated with the CaC03 fraction <strong>of</strong><br />
the sediments . Calcareous sediments usually contain<br />
higher concentrations <strong>of</strong> Ba because <strong>of</strong> its chemical similarity<br />
to Ca . However, the correlation <strong>of</strong> the Ba concentration<br />
to the CaC03 content (%) <strong>of</strong> the sediments<br />
was rather weak (r = 0 .372, significant at p


