World of Work Report 2013 - International Labour Organization
World of Work Report 2013 - International Labour Organization
World of Work Report 2013 - International Labour Organization

You also want an ePaper? Increase the reach of your titles
YUMPU automatically turns print PDFs into web optimized ePapers that Google loves.
Market) database (ILO, 2011) and real GDP data from the <strong>World</strong> Economic Outlook<br />
database <strong>of</strong> the IMF (IMF, <strong>2013</strong>a). GDP fi gures are expressed in constant<br />
local currency units.<br />
Employment–output elasticities are estimated following the methodology<br />
developed by Escudero (2009) for three groups <strong>of</strong> countries: advanced, emerging<br />
and developing economies. The following equation was estimated independently<br />
for each <strong>of</strong> these three country groups:<br />
ln e it = α + β it lny it + ε it<br />
where (e it ) corresponds to the level <strong>of</strong> employment at time t and y it is the real GDP<br />
at time t.<br />
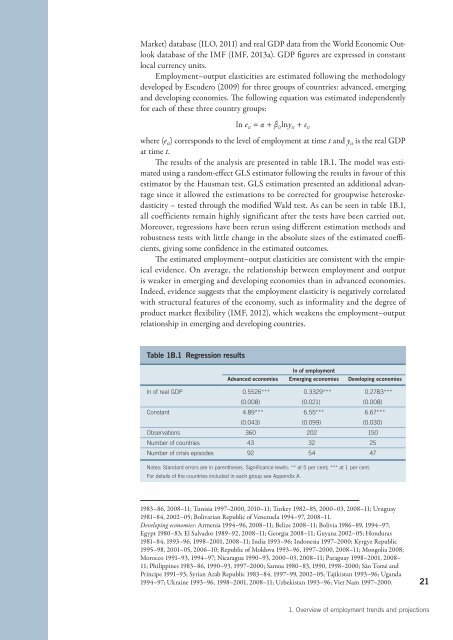
The results <strong>of</strong> the analysis are presented in table 1B.1. The model was estimated<br />
using a random-effect GLS estimator following the results in favour <strong>of</strong> this<br />
estimator by the Hausman test. GLS estimation presented an additional advantage<br />
since it allowed the estimations to be corrected for groupwise heteroskedasticity<br />
– tested through the modified Wald test. As can be seen in table 1B.1,<br />
all coefficients remain highly significant after the tests have been carried out.<br />
Moreover, regressions have been rerun using different estimation methods and<br />
robustness tests with little change in the absolute sizes <strong>of</strong> the estimated coeffi -<br />
cients, giving some confidence in the estimated outcomes.<br />
The estimated employment–output elasticities are consistent with the empirical<br />
evidence. On average, the relationship between employment and output<br />
is weaker in emerging and developing economies than in advanced economies.<br />
Indeed, evidence suggests that the employment elasticity is negatively correlated<br />
with structural features <strong>of</strong> the economy, such as informality and the degree <strong>of</strong><br />
product market flexibility (IMF, 2012), which weakens the employment–output<br />
relationship in emerging and developing countries.<br />
Table 1B.1 Regression results<br />
ln <strong>of</strong> employment<br />
Advanced economies Emerging economies Developing economies<br />
ln <strong>of</strong> real GDP 0.5526*** 0.3329*** 0.2783***<br />
(0.008) (0.021) (0.008)<br />
Constant 4.89*** 6.55*** 6.67***<br />
(0.043) (0.099) (0.030)<br />
Observations 360 202 150<br />
Number <strong>of</strong> countries 43 32 25<br />
Number <strong>of</strong> crisis episodes 92 54 47<br />
Notes: Standard errors are in parentheses. Significance levels: ** at 5per cent; *** at 1per cent.<br />
For details <strong>of</strong> the countries included in each group see Appendix A.<br />
1983–86, 2008–11; Tunisia 1997–2000, 2010–11; Turkey 1982–85, 2000–03, 2008–11; Uruguay<br />
1981–84, 2002–05; Bolivarian Republic <strong>of</strong> Venezuela 1994–97, 2008–11.<br />
Developing economies: Armenia 1994–96, 2008–11; Belize 2008–11; Bolivia 1986–89, 1994–97;<br />
Egypt 1980–83; El Salvador 1989–92, 2008–11; Georgia 2008–11; Guyana 2002–05; Honduras<br />
1981–84, 1993–96, 1998–2001, 2008–11; India 1993–96; Indonesia 1997–2000; Kyrgyz Republic<br />
1995–98, 2001–05, 2006–10; Republic <strong>of</strong> Moldova 1993–96, 1997–2000, 2008–11; Mongolia 2008;<br />
Morocco 1991–93, 1994–97; Nicaragua 1990–93, 2000–03, 2008–11; Paraguay 1998–2001, 2008–<br />
11; Philippines 1983–86, 1990–93, 1997–2000; Samoa 1980–83, 1990, 1998–2000; São Tomé and<br />
Príncipe 1991–93; Syrian Arab Republic 1983–84, 1997–99, 2002–05; Tajikistan 1993–96; Uganda<br />
1994–97; Ukraine 1993–96, 1998–2001, 2008–11; Uzbekistan 1993–96; Viet Nam 1997–2000.<br />
21<br />
1. Overview <strong>of</strong> employment trends and projections