World of Work Report 2013 - International Labour Organization
World of Work Report 2013 - International Labour Organization
World of Work Report 2013 - International Labour Organization

You also want an ePaper? Increase the reach of your titles
YUMPU automatically turns print PDFs into web optimized ePapers that Google loves.
C. Middle-income groups in emerging<br />
and developing economies<br />
In developing and emerging economies the size<br />
<strong>of</strong> the middle-income group has increased…<br />
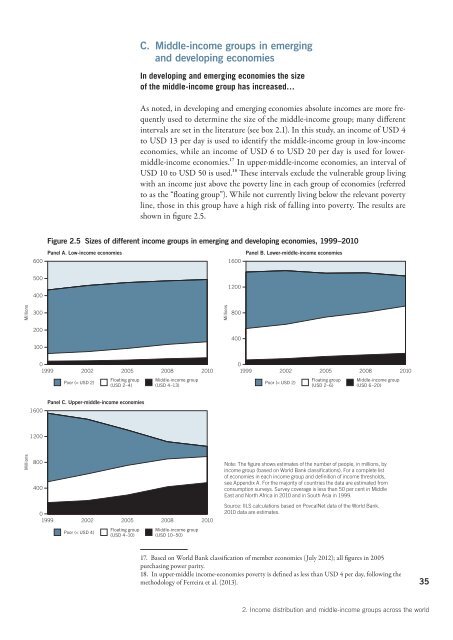
As noted, in developing and emerging economies absolute incomes are more frequently<br />
used to determine the size <strong>of</strong> the middle-income group; many different<br />
intervals are set in the literature (see box 2.1). In this study, an income <strong>of</strong> USD 4<br />
to USD 13 per day is used to identify the middle-income group in low-income<br />
economies, while an income <strong>of</strong> USD 6 to USD 20 per day is used for lowermiddle-income<br />
economies.17 In upper-middle-income economies, an interval <strong>of</strong><br />
USD 10 to USD 50 is used.18 These intervals exclude the vulnerable group living<br />
with an income just above the poverty line in each group <strong>of</strong> economies (referred<br />
to as the “floating group”). While not currently living below the relevant poverty<br />
line, those in this group have a high risk <strong>of</strong> falling into poverty. The results are<br />
shown in figure 2.5.<br />
Figure 2.5 Sizes <strong>of</strong> different income groups in emerging and developing economies, 1999–2010<br />
600<br />
Panel A. Low-income economies<br />
1600<br />
Panel B. Lower-middle-income economies<br />
500<br />
1200<br />
400<br />
Millions<br />
300<br />
Millions<br />
800<br />
200<br />
400<br />
100<br />
0<br />
1999 2002 2005 2008 2010<br />
0<br />
1999 2002 2005 2008 2010<br />
Poor (< USD 2)<br />
Floating group<br />
(USD 2–4)<br />
Middle-income group<br />
(USD 4–13)<br />
Poor (< USD 2)<br />
Floating group<br />
(USD 2–6)<br />
Middle-income group<br />
(USD 6–20)<br />
1600<br />
Panel C. Upper-middle-income economies<br />
1200<br />
Millions<br />
800<br />
400<br />
0<br />
1999 2002 2005 2008 2010<br />
Poor (< USD 4)<br />
Floating group<br />
(USD 4–10)<br />
Middle-income group<br />
(USD 10–50)<br />
<br />
<br />
<br />
<br />
<br />
<br />
<br />
<br />
17. Based on <strong>World</strong> Bank classification <strong>of</strong> member economies (July 2012); all figures in 2005<br />
purchasing power parity.<br />
18. In upper-middle income-economies poverty is defi ned as less than USD 4 per day, following the<br />
methodology <strong>of</strong> Ferreira et al. (<strong>2013</strong>).<br />
35<br />
2. Income distribution and middle-income groups across the world