World of Work Report 2013 - International Labour Organization
World of Work Report 2013 - International Labour Organization
World of Work Report 2013 - International Labour Organization

You also want an ePaper? Increase the reach of your titles
YUMPU automatically turns print PDFs into web optimized ePapers that Google loves.
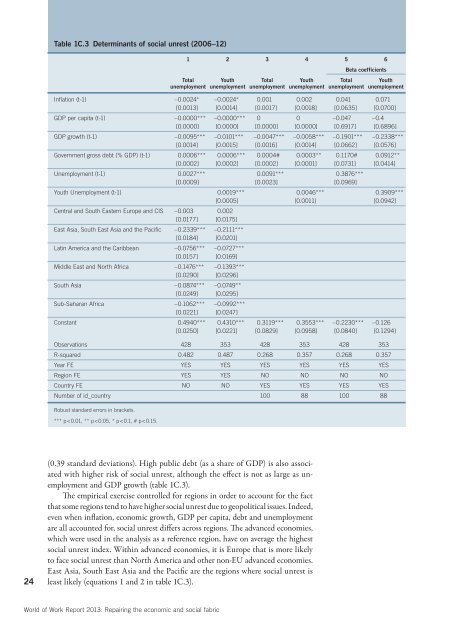
Table 1C.3 Determinants <strong>of</strong> social unrest (2006–12)<br />
1 2 3 4 5 6<br />
Total<br />
unemployment<br />
Youth<br />
unemployment<br />
Total<br />
unemployment<br />
Youth<br />
unemployment<br />
Beta coefficients<br />
Total<br />
unemployment<br />
Youth<br />
unemployment<br />
Inflation (t-1) –0.0024* –0.0024* 0.001 0.002 0.041 0.071<br />
[0.0013] [0.0014] [0.0017] [0.0018] [0.0635] [0.0700]<br />
GDP per capita (t-1) –0.0000*** –0.0000*** 0 0 –0.047 –0.4<br />
[0.0000] [0.0000] [0.0000] [0.0000] [0.6917] [0.6896]<br />
GDP growth (t-1) –0.0095*** –0.0101*** –0.0047*** –0.0058*** –0.1901*** –0.2338***<br />
[0.0014] [0.0015] [0.0016] [0.0014] [0.0662] [0.0576]<br />
Government gross debt (% GDP) (t-1) 0.0006*** 0.0006*** 0.0004# 0.0003** 0.1170# 0.0912**<br />
[0.0002] [0.0002] [0.0002] [0.0001] [0.0731] [0.0414]<br />
Unemployment (t-1) 0.0027*** 0.0091*** 0.3876***<br />
[0.0009] [0.0023] [0.0969]<br />
Youth Unemployment (t-1) 0.0019*** 0.0046*** 0.3909***<br />
[0.0005] [0.0011] [0.0942]<br />
Central and South Eastern Europe and CIS –0.003 0.002<br />
[0.0177] [0.0175]<br />
East Asia, South East Asia and the Pacific –0.2339*** –0.2111***<br />
[0.0184] [0.0201]<br />
Latin America and the Caribbean –0.0756*** –0.0727***<br />
[0.0157] [0.0169]<br />
Middle East and North Africa –0.1476*** –0.1393***<br />
[0.0290] [0.0296]<br />
South Asia –0.0874*** –0.0749**<br />
[0.0249] [0.0295]<br />
Sub-Saharan Africa –0.1062*** –0.0992***<br />
[0.0221] [0.0247]<br />
Constant 0.4940*** 0.4310*** 0.3119*** 0.3553*** –0.2230*** –0.126<br />
[0.0250] [0.0221] [0.0829] [0.0958] [0.0840] [0.1294]<br />
Observations 428 353 428 353 428 353<br />
R-squared 0.482 0.487 0.268 0.357 0.268 0.357<br />
Year FE YES YES YES YES YES YES<br />
Region FE YES YES NO NO NO NO<br />
Country FE NO NO YES YES YES YES<br />
Number <strong>of</strong> id_country 100 88 100 88<br />
Robust standard errors in brackets.<br />
*** p < 0.01, ** p < 0.05, * p < 0.1, # p < 0.15.<br />
24<br />
(0.39 standard deviations). High public debt (as a share <strong>of</strong> GDP) is also associated<br />
with higher risk <strong>of</strong> social unrest, although the effect is not as large as unemployment<br />
and GDP growth (table 1C.3).<br />
The empirical exercise controlled for regions in order to account for the fact<br />
that some regions tend to have higher social unrest due to geopolitical issues. Indeed,<br />
even when inflation, economic growth, GDP per capita, debt and unemployment<br />
are all accounted for, social unrest differs across regions. The advanced economies,<br />
which were used in the analysis as a reference region, have on average the highest<br />
social unrest index. Within advanced economies, it is Europe that is more likely<br />
to face social unrest than North America and other non-EU advanced economies.<br />
East Asia, South East Asia and the Pacific are the regions where social unrest is<br />
least likely (equations 1 and 2 in table 1C.3).<br />
<strong>World</strong> <strong>of</strong> <strong>Work</strong> <strong>Report</strong> <strong>2013</strong>: Repairing the economic and social fabric