World of Work Report 2013 - International Labour Organization
World of Work Report 2013 - International Labour Organization
World of Work Report 2013 - International Labour Organization

Create successful ePaper yourself
Turn your PDF publications into a flip-book with our unique Google optimized e-Paper software.
A. Global patterns and trends in investment<br />
Investment patterns are uneven…<br />
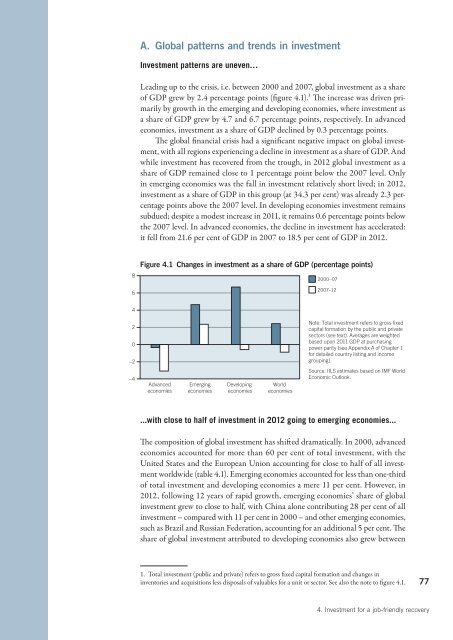
Leading up to the crisis, i.e. between 2000 and 2007, global investment as a share<br />
<strong>of</strong> GDP grew by 2.4 percentage points (fi gure 4.1).1 The increase was driven primarily<br />
by growth in the emerging and developing economies, where investment as<br />
a share <strong>of</strong> GDP grew by 4.7 and 6.7 percentage points, respectively. In advanced<br />
economies, investment as a share <strong>of</strong> GDP declined by 0.3 percentage points.<br />
The global fi nancial crisis had a significant negative impact on global investment,<br />
with all regions experiencing a decline in investment as a share <strong>of</strong> GDP. And<br />
while investment has recovered from the trough, in 2012 global investment as a<br />
share <strong>of</strong> GDP remained close to 1 percentage point below the 2007 level. Only<br />
in emerging economies was the fall in investment relatively short lived; in 2012,<br />
investment as a share <strong>of</strong> GDP in this group (at 34.3 per cent) was already 2.3 percentage<br />
points above the 2007 level. In developing economies investment remains<br />
subdued; despite a modest increase in 2011, it remains 0.6 percentage points below<br />
the 2007 level. In advanced economies, the decline in investment has accelerated:<br />
it fell from 21.6 per cent <strong>of</strong> GDP in 2007 to 18.5 per cent <strong>of</strong> GDP in 2012.<br />
8<br />
6<br />
Figure 4.1 Changes in investment as a share <strong>of</strong> GDP (percentage points)<br />
2000–07<br />
2007–12<br />
4<br />
2<br />
0<br />
–2<br />
<br />
capital formation by the public and private<br />
<br />
based upon 2011 GDP at purchasing<br />
<br />
for detailed country listing and income<br />
<br />
Source: IILS estimates based on IMF <strong>World</strong><br />
<br />
–4<br />
Advanced<br />
economies<br />
Emerging<br />
economies<br />
Developing<br />
economies<br />
<strong>World</strong><br />
economies<br />
...with close to half <strong>of</strong> investment in 2012 going to emerging economies...<br />
The composition <strong>of</strong> global investment has shifted dramatically. In 2000, advanced<br />
economies accounted for more than 60 per cent <strong>of</strong> total investment, with the<br />
United States and the European Union accounting for close to half <strong>of</strong> all investment<br />
worldwide (table 4.1). Emerging economies accounted for less than one-third<br />
<strong>of</strong> total investment and developing economies a mere 11 per cent. However, in<br />
2012, following 12 years <strong>of</strong> rapid growth, emerging economies’ share <strong>of</strong> global<br />
investment grew to close to half, with China alone contributing 28 per cent <strong>of</strong> all<br />
investment – compared with 11 per cent in 2000 – and other emerging economies,<br />
such as Brazil and Russian Federation, accounting for an additional 5 per cent. The<br />
share <strong>of</strong> global investment attributed to developing economies also grew between<br />
1. Total investment (public and private) refers to gross fi xed capital formation and changes in<br />
inventories and acquisitions less disposals <strong>of</strong> valuables for a unit or sector. See also the note to figure 4.1.<br />
77<br />
4. Investment for a job-friendly recovery