Syngenta Annual Review 2010 - CEO Water Mandate
Syngenta Annual Review 2010 - CEO Water Mandate
Syngenta Annual Review 2010 - CEO Water Mandate

Create successful ePaper yourself
Turn your PDF publications into a flip-book with our unique Google optimized e-Paper software.
<strong>Syngenta</strong><br />
<strong>Annual</strong> <strong>Review</strong> <strong>2010</strong><br />
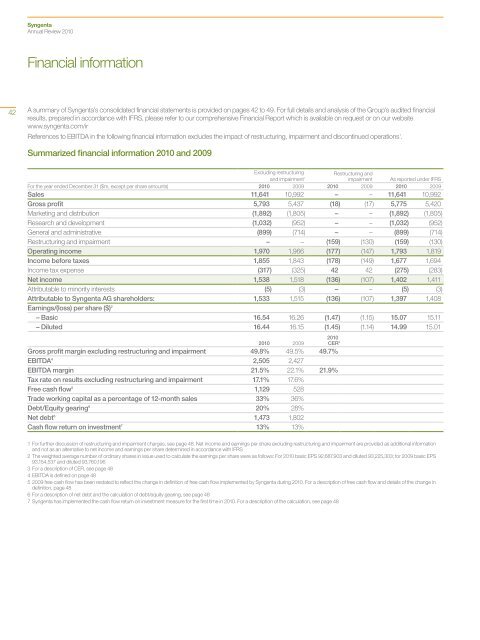
Financial information<br />
42<br />
A summary of <strong>Syngenta</strong>’s consolidated financial statements is provided on pages 42 to 49. For full details and analysis of the Group’s audited financial<br />
results, prepared in accordance with IFRS, please refer to our comprehensive Financial Report which is available on request or on our website<br />
www.syngenta.com/ir<br />
References to EBITDA in the following financial information excludes the impact of restructuring, impairment and discontinued operations 1 .<br />
Summarized financial information <strong>2010</strong> and 2009<br />
Excluding restructuring<br />
and impairment 1<br />
Restructuring and<br />
impairment As reported under IFRS<br />
For the year ended December 31 ($m, except per share amounts) <strong>2010</strong> 2009 <strong>2010</strong> 2009 <strong>2010</strong> 2009<br />
Sales 11,641 10,992 – – 11,641 10,992<br />
Gross profit 5,793 5,437 (18) (17) 5,775 5,420<br />
Marketing and distribution (1,892) (1,805) – – (1,892) (1,805)<br />
Research and development (1,032) (952) – – (1,032) (952)<br />
General and administrative (899) (714) – – (899) (714)<br />
Restructuring and impairment – – (159) (130) (159) (130)<br />
Operating income 1,970 1,966 (177) (147) 1,793 1,819<br />
Income before taxes 1,855 1,843 (178) (149) 1,677 1,694<br />
Income tax expense (317) (325) 42 42 (275) (283)<br />
Net income 1,538 1,518 (136) (107) 1,402 1,411<br />
Attributable to minority interests (5) (3) – – (5) (3)<br />
Attributable to <strong>Syngenta</strong> AG shareholders: 1,533 1,515 (136) (107) 1,397 1,408<br />
Earnings/(loss) per share ($) 2<br />
– Basic 16.54 16.26 (1.47) (1.15) 15.07 15.11<br />
– Diluted 16.44 16.15 (1.45) (1.14) 14.99 15.01<br />
<strong>2010</strong> 2009<br />
<strong>2010</strong><br />
CER 3<br />
Gross profit margin excluding restructuring and impairment 49.8% 49.5% 49.7%<br />
EBITDA 4 2,505 2,427<br />
EBITDA margin 21.5% 22.1% 21.9%<br />
Tax rate on results excluding restructuring and impairment 17.1% 17.6%<br />
Free cash flow 5 1,129 528<br />
Trade working capital as a percentage of 12-month sales 33% 36%<br />
Debt/Equity gearing 6 20% 28%<br />
Net debt 6 1,473 1,802<br />
Cash flow return on investment 7 13% 13%<br />
1 For further discussion of restructuring and impairment charges, see page 48. Net income and earnings per share excluding restructuring and impairment are provided as additional information<br />
and not as an alternative to net income and earnings per share determined in accordance with IFRS<br />
2 The weighted average number of ordinary shares in issue used to calculate the earnings per share were as follows: For <strong>2010</strong> basic EPS 92,687,903 and diluted 93,225,303; for 2009 basic EPS<br />
93,154,537 and diluted 93,760,196<br />
3 For a description of CER, see page 48<br />
4 EBITDA is defined on page 48<br />
5 2009 free cash flow has been restated to reflect the change in definition of free cash flow implemented by <strong>Syngenta</strong> during <strong>2010</strong>. For a description of free cash flow and details of the change in<br />
definition, page 48<br />
6 For a description of net debt and the calculation of debt/equity gearing, see page 48<br />
7 <strong>Syngenta</strong> has implemented the cash flow return on investment measure for the first time in <strong>2010</strong>. For a description of the calculation, see page 48