Syngenta Annual Review 2010 - CEO Water Mandate
Syngenta Annual Review 2010 - CEO Water Mandate
Syngenta Annual Review 2010 - CEO Water Mandate
You also want an ePaper? Increase the reach of your titles
YUMPU automatically turns print PDFs into web optimized ePapers that Google loves.
<strong>Syngenta</strong><br />
<strong>Annual</strong> <strong>Review</strong> <strong>2010</strong><br />
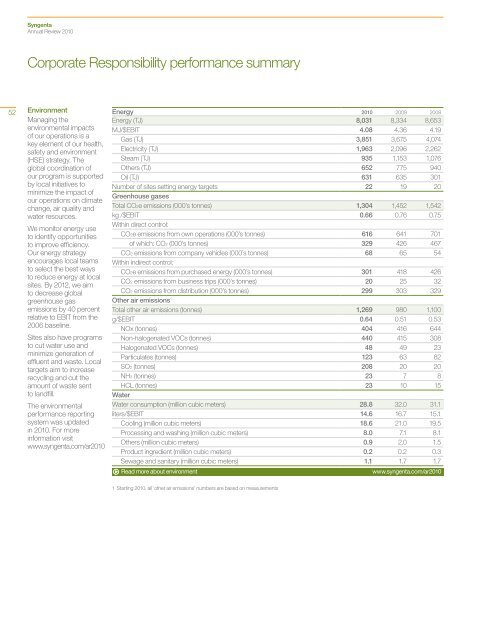
Corporate Responsibility performance summary<br />
52<br />
Environment<br />
Managing the<br />
environmental impacts<br />
of our operations is a<br />
key element of our health,<br />
safety and environment<br />
(HSE) strategy. The<br />
global coordination of<br />
our program is supported<br />
by local initiatives to<br />
minimize the impact of<br />
our operations on climate<br />
change, air quality and<br />
water resources.<br />
We monitor energy use<br />
to identify opportunities<br />
to improve efficiency.<br />
Our energy strategy<br />
encourages local teams<br />
to select the best ways<br />
to reduce energy at local<br />
sites. By 2012, we aim<br />
to decrease global<br />
greenhouse gas<br />
emissions by 40 percent<br />
relative to EBIT from the<br />
2006 baseline.<br />
Sites also have programs<br />
to cut water use and<br />
minimize generation of<br />
effluent and waste. Local<br />
targets aim to increase<br />
recycling and cut the<br />
amount of waste sent<br />
to landfill.<br />
The environmental<br />
performance reporting<br />
system was updated<br />
in <strong>2010</strong>. For more<br />
information visit<br />
www.syngenta.com/ar<strong>2010</strong><br />
Energy <strong>2010</strong> 2009 2008<br />
Energy (TJ) 8,031 8,334 8,653<br />
MJ/$EBIT 4.08 4.36 4.19<br />
Gas (TJ) 3,851 3,675 4,074<br />
Electricity (TJ) 1,963 2,096 2,262<br />
Steam (TJ) 935 1,153 1,076<br />
Others (TJ) 652 775 940<br />
Oil (TJ) 631 635 301<br />
Number of sites setting energy targets 22 19 20<br />
Greenhouse gases<br />
Total CO2e emissions (000’s tonnes) 1,304 1,452 1,542<br />
kg /$EBIT 0.66 0.76 0.75<br />
Within direct control:<br />
CO2e emissions from own operations (000’s tonnes) 616 641 701<br />
of which: CO2 (000’s tonnes) 329 426 467<br />
CO2 emissions from company vehicles (000’s tonnes) 68 65 54<br />
Within indirect control:<br />
CO2e emissions from purchased energy (000’s tonnes) 301 418 426<br />
CO2 emissions from business trips (000’s tonnes) 20 25 32<br />
CO2 emissions from distribution (000’s tonnes) 299 303 329<br />
Other air emissions 1<br />
Total other air emissions (tonnes) 1,269 980 1,100<br />
g/$EBIT 0.64 0.51 0.53<br />
NOx (tonnes) 404 416 644<br />
Non-halogenated VOCs (tonnes) 440 415 308<br />
Halogenated VOCs (tonnes) 48 49 23<br />
Particulates (tonnes) 123 63 82<br />
SO2 (tonnes) 208 20 20<br />
NH3 (tonnes) 23 7 8<br />
HCL (tonnes) 23 10 15<br />
<strong>Water</strong><br />
<strong>Water</strong> consumption (million cubic meters) 28.8 32.0 31.1<br />
liters/$EBIT 14.6 16.7 15.1<br />
Cooling (million cubic meters) 18.6 21.0 19.5<br />
Processing and washing (million cubic meters) 8.0 7.1 8.1<br />
Others (million cubic meters) 0.9 2.0 1.5<br />
Product ingredient (million cubic meters) 0.2 0.2 0.3<br />
Sewage and sanitary (million cubic meters) 1.1 1.7 1.7<br />
Read more about environment<br />
www.syngenta.com/ar<strong>2010</strong><br />
1 Starting <strong>2010</strong>, all ‘other air emissions’ numbers are based on measurements


