View/Open - HPS Repository - Arizona State University
View/Open - HPS Repository - Arizona State University
View/Open - HPS Repository - Arizona State University

Create successful ePaper yourself
Turn your PDF publications into a flip-book with our unique Google optimized e-Paper software.
R68<br />
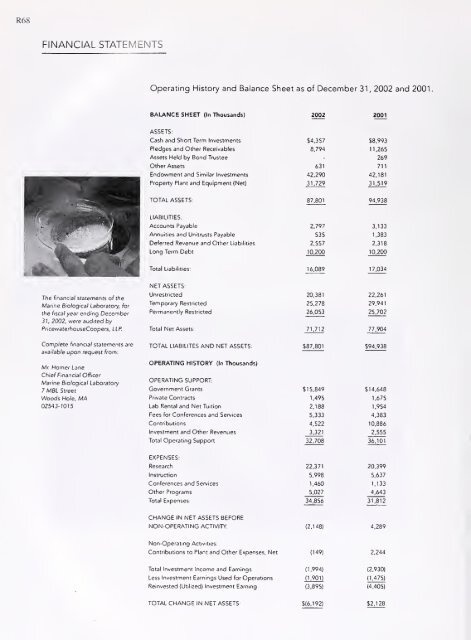
FINANCIAL STATEMENTS<br />
Operating History and Balance Sheet as of December 31 ,<br />
2002<br />
and 2001 .<br />
BALANCE SHEET (In Thousands) 2002 2001<br />
ASSETS:<br />
Cash and Short Term Investments<br />
Pledges and Other Receivables<br />
Assets Held by Bond Trustee<br />
Other Assets<br />
Endowment and Similar Investments<br />
$4.357<br />
8.794<br />
631<br />
42.290<br />
$8.993<br />
11,265<br />
269<br />
711<br />
42.181<br />
Property Plant and Equipment (Net)<br />
31.729<br />
31,519<br />
TOTAL ASSETS:<br />
87.801<br />
94.938<br />
LIABILITIES.<br />
Accounts Payable<br />
Annuities and Unitrusts Payable<br />
2,797<br />
535<br />
3,133<br />
1,383<br />
Deferred Revenue and Other Liabilities<br />
Long Term Debt<br />
2.557<br />
10,200<br />
2,318<br />
10,200<br />
Total Liabilities:<br />
16.089<br />
17,034<br />
NET ASSETS-<br />
The financial statements of the<br />
Marine Biological Laboratory, for<br />
the fiscal year ending December<br />
Unrestricted<br />
Temporary Restricted<br />
Permanently Restricted<br />
20,381<br />
25.278<br />
26,053<br />
22.261<br />
29.941<br />
25,702<br />
31. 2002. were audited by<br />
Pr/cewaterhouseCoopers. LLP<br />
Total Net Assets:<br />
71.712<br />
77.904<br />
Complete financial statements are<br />
available upon request from:<br />
TOTAL LIA8ILITES AND NET ASSETS:<br />
$87.801<br />
$94,938<br />
Mr Homer Lane<br />
OPERATING HISTORY (In Thousands)<br />
Chief Financial Officer<br />
Marine Biological Laboratory<br />
7 M8L Street<br />
Woods Hole. MA<br />
02543-1015<br />
OPERATING SUPPORT:<br />
Government Grants<br />
Private Contracts<br />
Lab Rental and Net Tuition<br />
$15.849<br />
1.495<br />
2,188<br />
$14,648<br />
1,675<br />
1,954<br />
Fees for Conferences and Services<br />
Contributions<br />
Investment and Other Revenues<br />
5.333<br />
4.522<br />
3,321<br />
4.383<br />
10.886<br />
2.555<br />
Total Operating Support<br />
32,708<br />
36,101<br />
EXPENSES:<br />
Research<br />
22,371<br />
20.399<br />
Instruction<br />
5.998<br />
5.637<br />
Conferences and Services<br />
1.460<br />
1.133<br />
Other Programs<br />
5.027<br />
4.643<br />
Total Expenses:<br />
34.856<br />
31.812<br />
CHANGE IN NET ASSETS BEFORE<br />
NON. OPERATING ACTIVITY. (2,148) 4.239<br />
Non-Operating Activities.<br />
Contributions to Plant and Other Expenses, Net (149)<br />
2,244<br />
Total Investment Income and Earnings (1,994)<br />
Less Investment Earnings Used for Operations (1,901)<br />
Reinvested (Utilized) Investment Earning (3.895)<br />
(2.930)<br />
(1.475)<br />
(4,405)<br />
TOTAL CHANGE IN NET ASSETS: $(6.192)<br />
$2.128