2007-2008 - Cgglobal.com
2007-2008 - Cgglobal.com
2007-2008 - Cgglobal.com

You also want an ePaper? Increase the reach of your titles
YUMPU automatically turns print PDFs into web optimized ePapers that Google loves.
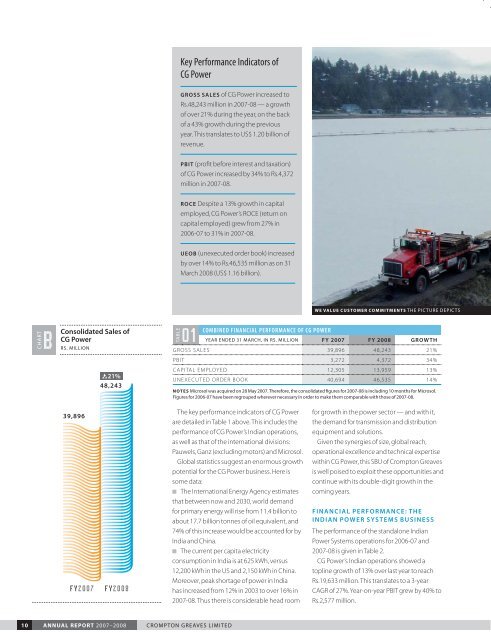
Key Performance Indicators of<br />
CG Power<br />
GROSS SALES of CG Power increased to<br />
Rs.48,243 million in <strong>2007</strong>-08 — a growth<br />
of over 21% during the year, on the back<br />
of a 43% growth during the previous<br />
year. This translates to US$ 1.20 billion of<br />
revenue.<br />
PBIT (profit before interest and taxation)<br />
of CG Power increased by 34% to Rs.4,372<br />
million in <strong>2007</strong>-08.<br />
ROCE Despite a 13% growth in capital<br />
employed, CG Power’s ROCE (return on<br />
capital employed) grew from 27% in<br />
2006-07 to 31% in <strong>2007</strong>-08.<br />
UEOB (unexecuted order book) increased<br />
by over 14% to Rs.46,535 million as on 31<br />
March <strong>2008</strong> (US$ 1.16 billion).<br />
CHART<br />
B<br />
Consolidated Sales of<br />
CG Power<br />
RS. MILLION<br />
21%<br />
48,243<br />
TABLE<br />
01<br />
WE VALUE CUSTOMER COMMITMENTS THE PICTURE DEPICTS<br />
COMBINED FINANCIAL PERFORMANCE OF CG POWER<br />
YEAR ENDED 31 MARCH, IN RS. MILLION FY <strong>2007</strong> FY <strong>2008</strong> GROWTH<br />
GROSS SALES 39,896 48,243 21%<br />
PBIT 3,272 4,372 34%<br />
CAPITAL EMPLOYED 12,305 13,959 13%<br />
UNEXECUTED ORDER BOOK 40,694 46,535 14%<br />
NOTES Microsol was acquired on 28 May <strong>2007</strong>. Therefore, the consolidated figures for <strong>2007</strong>-08 is including 10 months for Microsol.<br />
Figures for 2006-07 have been regrouped wherever necessary in order to make them <strong>com</strong>parable with those of <strong>2007</strong>-08.<br />
39,896<br />
FY<strong>2007</strong><br />
FY<strong>2008</strong><br />
The key performance indicators of CG Power<br />
are detailed in Table 1 above. This includes the<br />
performance of CG Power’s Indian operations,<br />
as well as that of the international divisions:<br />
Pauwels, Ganz (excluding motors) and Microsol.<br />
Global statistics suggest an enormous growth<br />
potential for the CG Power business. Here is<br />
some data:<br />
$ The International Energy Agency estimates<br />
that between now and 2030, world demand<br />
for primary energy will rise from 11.4 billion to<br />
about 17.7 billion tonnes of oil equivalent, and<br />
74% of this increase would be accounted for by<br />
India and China.<br />
$ The current per capita electricity<br />
consumption in India is at 625 kWh, versus<br />
12,200 kWh in the US and 2,150 kWh in China.<br />
Moreover, peak shortage of power in India<br />
has increased from 12% in 2003 to over 16% in<br />
<strong>2007</strong>-08. Thus there is considerable head room<br />
for growth in the power sector — and with it,<br />
the demand for transmission and distribution<br />
equipment and solutions.<br />
Given the synergies of size, global reach,<br />
operational excellence and technical expertise<br />
within CG Power, this SBU of Crompton Greaves<br />
is well poised to exploit these opportunities and<br />
continue with its double-digit growth in the<br />
<strong>com</strong>ing years.<br />
FINANCIAL PERFORMANCE: THE<br />
INDIAN POWER SYSTEMS BUSINESS<br />
The performance of the standalone Indian<br />
Power Systems operations for 2006-07 and<br />
<strong>2007</strong>-08 is given in Table 2.<br />
CG Power’s Indian operations showed a<br />
topline growth of 13% over last year to reach<br />
Rs.19,633 million. This translates to a 3-year<br />
CAGR of 27%. Year-on-year PBIT grew by 40% to<br />
Rs.2,577 million.<br />
10 ANNUAL REPORT <strong>2007</strong>–<strong>2008</strong> CROMPTON GREAVES LIMITED