2007-2008 - Cgglobal.com
2007-2008 - Cgglobal.com
2007-2008 - Cgglobal.com

You also want an ePaper? Increase the reach of your titles
YUMPU automatically turns print PDFs into web optimized ePapers that Google loves.
PROFIT AFTER TAX Despite the increase in<br />
tax liabilities, profit after tax (PAT) grew 63% to<br />
Rs.3,139 million.<br />
ROCE Notwithstanding increase in fixed assets,<br />
return on capital employed showed a sharp<br />
improvement from 34.4% in 2006-07 to 47.9%<br />
in <strong>2007</strong>-08. This has been brought about by two<br />
factors. First, a control on debtors and inventory,<br />
which shows up in the improved asset turns<br />
(the number of times net working capital has<br />
turned during the year) — and has improved<br />
from 8.1 times in 2006-07 to 10.7 times in <strong>2007</strong>-<br />
08. Second, an increase in profitability, which<br />
can be seen from the PBT to net sales ratio,<br />
which improved from 9.1% in 2006-07 to 12.5%<br />
in <strong>2007</strong>-08.<br />
LEVERAGE RATIOS also showed improved<br />
substantially during <strong>2007</strong>-08. Debt-equity<br />
ratio dropped from 0.4 to 0.1, while the interest<br />
coverage ratio (indicating the standalone<br />
entity’s capability to service debt) increased<br />
from 12.4 to 20.4. Interest costs, in absolute<br />
terms, have actually reduced in <strong>2007</strong>-08, in spite<br />
of its growth in operations, thus underscoring<br />
the standalone entity’s ability to optimally<br />
utilise its working capital and fixed assets.<br />
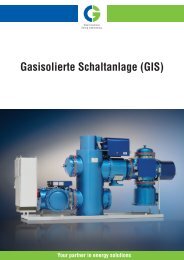
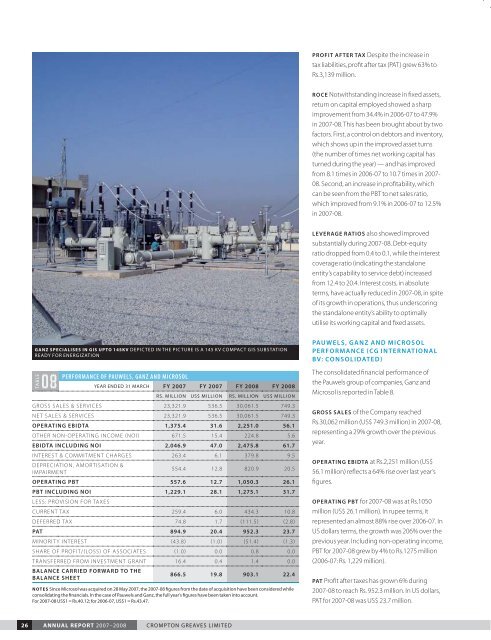
GANZ SPECIALISES IN GIS UPTO 145KV DEPICTED IN THE PICTURE IS A 145 KV COMPACT GIS SUBSTATION<br />
READY FOR ENERGIZATION<br />
TABLE<br />
08<br />
PERFORMANCE OF PAUWELS, GANZ AND MICROSOL<br />
YEAR ENDED 31 MARCH FY <strong>2007</strong> FY <strong>2007</strong> FY <strong>2008</strong> FY <strong>2008</strong><br />
RS. MILLION US$ MILLION RS. MILLION US$ MILLION<br />
GROSS SALES & SERVICES 23,321.9 536.5 30,061.5 749.3<br />
NET SALES & SERVICES 23,321.9 536.5 30,061.5 749.3<br />
OPERATING EBIDTA 1,375.4 31.6 2,251.0 56.1<br />
OTHER NON-OPERATING INCOME (NOI) 671.5 15.4 224.8 5.6<br />
EBIDTA INCLUDING NOI 2,046.9 47.0 2,475.8 61.7<br />
INTEREST & COMMITMENT CHARGES 263.4 6.1 379.8 9.5<br />
DEPRECIATION, AMORTISATION &<br />
IMPAIRMENT<br />
554.4 12.8 820.9 20.5<br />
OPERATING PBT 557.6 12.7 1,050.3 26.1<br />
PBT INCLUDING NOI 1,229.1 28.1 1,275.1 31.7<br />
LESS: PROVISION FOR TAXES<br />
CURRENT TAX 259.4 6.0 434.3 10.8<br />
DEFERRED TAX 74.8 1.7 (111.5) (2.8)<br />
PAT 894.9 20.4 952.3 23.7<br />
MINORITY INTEREST (43.8) (1.0) (51.4) (1.3)<br />
SHARE OF PROFIT/(LOSS) OF ASSOCIATES (1.0) 0.0 0.8 0.0<br />
TRANSFERRED FROM INVESTMENT GRANT 16.4 0.4 1.4 0.0<br />
BALANCE CARRIED FORWARD TO THE<br />
BALANCE SHEET<br />
866.5 19.8 903.1 22.4<br />
NOTES Since Microsol was acquired on 28 May <strong>2007</strong>, the <strong>2007</strong>-08 figures from the date of acquisition have been considered while<br />
consolidating the financials. In the case of Pauwels and Ganz, the full year’s figures have been taken into account.<br />
For <strong>2007</strong>-08 US$1 = Rs.40.12; for 2006-07, US$1 = Rs.43.47.<br />
PAUWELS, GANZ AND MICROSOL<br />
PERFORMANCE (CG INTERNATIONAL<br />
BV: CONSOLIDATED)<br />
The consolidated financial performance of<br />
the Pauwels group of <strong>com</strong>panies, Ganz and<br />
Microsol is reported in Table 8.<br />
GROSS SALES of the Company reached<br />
Rs.30,062 million (US$ 749.3 million) in <strong>2007</strong>-08,<br />
representing a 29% growth over the previous<br />
year.<br />
OPERATING EBIDTA at Rs.2,251 million (US$<br />
56.1 million) reflects a 64% rise over last year’s<br />
figures.<br />
OPERATING PBT for <strong>2007</strong>-08 was at Rs.1050<br />
million (US$ 26.1 million). In rupee terms, it<br />
represented an almost 88% rise over 2006-07. In<br />
US dollars terms, the growth was 206% over the<br />
previous year. Including non-operating in<strong>com</strong>e,<br />
PBT for <strong>2007</strong>-08 grew by 4% to Rs.1275 million<br />
(2006-07: Rs. 1,229 million).<br />
PAT Profit after taxes has grown 6% during<br />
<strong>2007</strong>-08 to reach Rs. 952.3 million. In US dollars,<br />
PAT for <strong>2007</strong>-08 was US$ 23.7 million.<br />
26 ANNUAL REPORT <strong>2007</strong>–<strong>2008</strong> CROMPTON GREAVES LIMITED