2007-2008 - Cgglobal.com
2007-2008 - Cgglobal.com
2007-2008 - Cgglobal.com

You also want an ePaper? Increase the reach of your titles
YUMPU automatically turns print PDFs into web optimized ePapers that Google loves.
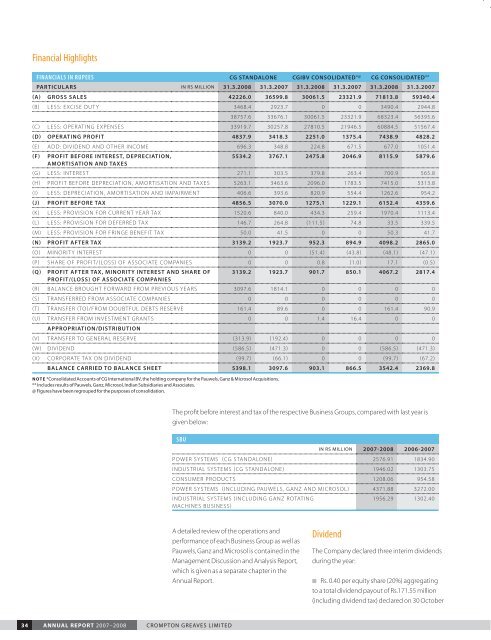
Financial Highlights<br />
FINANCIALS IN RUPEES CG STANDALONE CGIBV CONSOLIDATED*@ CG CONSOLIDATED**<br />
PARTICULARS IN RS MILLION 31.3.<strong>2008</strong> 31.3.<strong>2007</strong> 31.3.<strong>2008</strong> 31.3.<strong>2007</strong> 31.3.<strong>2008</strong> 31.3.<strong>2007</strong><br />
(A) GROSS SALES 42226.0 36599.8 30061.5 23321.9 71813.8 59340.4<br />
(B) LESS: EXCISE DUTY 3468.4 2923.7 0 0 3490.4 2944.8<br />
38757.6 33676.1 30061.5 23321.9 68323.4 56395.6<br />
(C) LESS: OPERATING EXPENSES 33919.7 30257.8 27810.5 21946.5 60884.5 51567.4<br />
(D) OPERATING PROFIT 4837.9 3418.3 2251.0 1375.4 7438.9 4828.2<br />
(E) ADD: DIVIDEND AND OTHER INCOME 696.3 348.8 224.8 671.5 677.0 1051.4<br />
(F) PROFIT BEFORE INTEREST, DEPRECIATION,<br />
5534.2 3767.1 2475.8 2046.9 8115.9 5879.6<br />
AMORTISATION AND TAXES<br />
(G) LESS: INTEREST 271.1 303.5 379.8 263.4 700.9 565.8<br />
(H) PROFIT BEFORE DEPRECIATION, AMORTISATION AND TAXES 5263.1 3463.6 2096.0 1783.5 7415.0 5313.8<br />
(I) LESS: DEPRECIATION, AMORTISATION AND IMPAIRMENT 406.6 393.6 820.9 554.4 1262.6 954.2<br />
(J) PROFIT BEFORE TAX 4856.5 3070.0 1275.1 1229.1 6152.4 4359.6<br />
(K) LESS: PROVISION FOR CURRENT YEAR TAX 1520.6 840.0 434.3 259.4 1970.4 1113.4<br />
(L) LESS: PROVISION FOR DEFERRED TAX 146.7 264.8 (111.5) 74.8 33.5 339.5<br />
(M) LESS: PROVISION FOR FRINGE BENEFIT TAX 50.0 41.5 0 0 50.3 41.7<br />
(N) PROFIT AFTER TAX 3139.2 1923.7 952.3 894.9 4098.2 2865.0<br />
(O) MINORITY INTEREST 0 0 (51.4) (43.8) (48.1) (47.1)<br />
(P) SHARE OF PROFIT/(LOSS) OF ASSOCIATE COMPANIES 0 0 0.8 (1.0) 17.1 (0.5)<br />
(Q) PROFIT AFTER TAX, MINORITY INTEREST AND SHARE OF 3139.2 1923.7 901.7 850.1 4067.2 2817.4<br />
PROFIT/(LOSS) OF ASSOCIATE COMPANIES<br />
(R) BALANCE BROUGHT FORWARD FROM PREVIOUS YEARS 3097.6 1814.1 0 0 0 0<br />
(S) TRANSFERRED FROM ASSOCIATE COMPANIES 0 0 0 0 0 0<br />
(T) TRANSFER (TO)/FROM DOUBTFUL DEBTS RESERVE 161.4 89.6 0 0 161.4 90.9<br />
(U) TRANSFER FROM INVESTMENT GRANTS 0 0 1.4 16.4 0 0<br />
APPROPRIATION/DISTRIBUTION<br />
(V) TRANSFER TO GENERAL RESERVE (313.9) (192.4) 0 0 0 0<br />
(W) DIVIDEND (586.5) (471.3) 0 0 (586.5) (471.3)<br />
(X) CORPORATE TAX ON DIVIDEND (99.7) (66.1) 0 0 (99.7) (67.2)<br />
BALANCE CARRIED TO BALANCE SHEET 5398.1 3097.6 903.1 866.5 3542.4 2369.8<br />
NOTE *Consolidated Accounts of CG International BV, the holding <strong>com</strong>pany for the Pauwels, Ganz & Microsol Acquisitions.<br />
** Includes results of Pauwels, Ganz, Microsol, Indian Subsidiaries and Associates.<br />
@ Figures have been regrouped for the purposes of consolidation.<br />
The profit before interest and tax of the respective Business Groups, <strong>com</strong>pared with last year is<br />
given below:<br />
SBU<br />
IN RS MILLION <strong>2007</strong>-<strong>2008</strong> 2006-<strong>2007</strong><br />
POWER SYSTEMS (CG STANDALONE) 2576.91 1834.90<br />
INDUSTRIAL SYSTEMS (CG STANDALONE) 1946.02 1303.75<br />
CONSUMER PRODUCTS 1208.06 954.58<br />
POWER SYSTEMS (INCLUDING PAUWELS, GANZ AND MICROSOL) 4371.88 3272.00<br />
INDUSTRIAL SYSTEMS (INCLUDING GANZ ROTATING<br />
MACHINES BUSINESS)<br />
1956.29 1302.40<br />
A detailed review of the operations and<br />
performance of each Business Group as well as<br />
Pauwels, Ganz and Microsol is contained in the<br />
Management Discussion and Analysis Report,<br />
which is given as a separate chapter in the<br />
Annual Report.<br />
Dividend<br />
The Company declared three interim dividends<br />
during the year:<br />
$ Rs. 0.40 per equity share (20%) aggregating<br />
to a total dividend payout of Rs.171.55 million<br />
(including dividend tax) declared on 30 October<br />
34 ANNUAL REPORT <strong>2007</strong>–<strong>2008</strong> CROMPTON GREAVES LIMITED