Annual Report 2007-08 - Plumbing Industry Commission
Annual Report 2007-08 - Plumbing Industry Commission
Annual Report 2007-08 - Plumbing Industry Commission

Create successful ePaper yourself
Turn your PDF publications into a flip-book with our unique Google optimized e-Paper software.
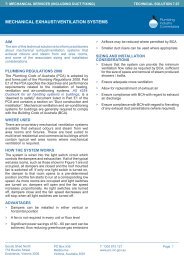
Five-year statistical summary<br />
Performance measure 2003–04 2004–05 2005–06 2006–07 <strong>2007</strong>–<strong>08</strong><br />
Regulatory excellence (see page 12)<br />
Modifications applications 316 346 284 322 328<br />
<strong>Industry</strong> responsibility (see page 18)<br />
Number of individuals holding a plumbing licence and/or registration 19,361 19,947 20,486 20,519 21,378<br />
Number of individuals holding a registration in at least one class 15,634 15,955 16,523 16,394 17,095<br />
Number of individuals holding a licence in at least one class 9,588 9,741 10,046 10,430 10,866<br />
Compliance Certificates lodged 283,294 283,245 289,275 315,760 340,293<br />
Qualifications Experience Review Committee (QERC) applications 588 634 849 879 709<br />
Practitioners receiving reciprocal recognition 405 471 451 447 432<br />
Apprentice practical registration exams held 840 948 1,180 1,406 1,356<br />
Non-apprentice practical registration exams held 179 238 254 266 278<br />
Theory-based licence exams held 390 369 474 5<strong>08</strong> 497<br />
Telephone enquiries regarding registration, licensing and general plumbing 47,227 35,423 38,812 39,139 n/a<br />
In-person enquiries regarding registration, licensing and general plumbing 7,827 8,119 8,526 8,995 8,463<br />
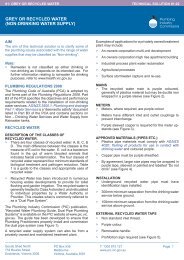
Environmental best practice (see page 28)<br />
Water recycle audits n/a n/a n/a n/a 1,312<br />
Number of solar installations passed n/a n/a n/a n/a 594<br />
Number of 2,000 litre water tanks supplying all cisterns passed n/a n/a n/a n/a 618<br />
Number of recycled water installations – passed n/a n/a n/a n/a 83<br />
Total 5 Star audits performed n/a n/a n/a n/a 1,312<br />
Community accountability (see page 34)<br />
Audits completed (% of total Compliance Certificates lodged) 5.5 5.6 5.3 5.1 5.1<br />
Audits failed (% of total audits) 11.3 11.1 9.7 7.1 11.2<br />
Sanitary drain inspections completed (% of total inspections booked) 6.0 6.0 5.4 6.4 5.5<br />
Sanitary drains failed (% of total inspections) 7.5 6.2 5.7 4.6 3.5<br />
Formal complaints received 357 419 472 535 683<br />
Site visits 2,054 1,451 2,055 3,062 3,046<br />
Investigations conducted into plumbing practitioners 396 376 388 617 609<br />
Prosecutions completed 28 40 26 62 30<br />
Disciplinary hearings held 14 15 12 53 53<br />
Notices and orders issued 56 170 184 118 100<br />
Our people (see page 40)<br />
Total head count 56 51 49 50 50<br />
Percentage of female employees 34 31 39 34 38<br />
Percentage of male employees 66 69 61 66 62<br />
Financial performance (see page 52)<br />
Total income $9.2M $8.8M $9.1M $10.1M $11.2M<br />
Total expenses $8.8M $8.5M $8.4M $10.6M $11.1M<br />
Net result for the period $0.4M $0.3M $0.7M ($0.5M) $0.1M<br />
Total assets $7.9M $8.0M $10.0M $10.7M $11.8M<br />
Total liabilities $3.5M $3.2M $3.5M $4.7M $4.6M<br />
PLUMBING INDUSTRY COMMISSION <strong>2007</strong>–<strong>08</strong> Financial REPORT 81