2205 final report.pdf - Agra CEAS Consulting
2205 final report.pdf - Agra CEAS Consulting
2205 final report.pdf - Agra CEAS Consulting

You also want an ePaper? Increase the reach of your titles
YUMPU automatically turns print PDFs into web optimized ePapers that Google loves.
IMPACT OF THE EU SUGAR REGIME ON BCCCA MEMBER COMPANIES<br />
• There has been a history of anti-competitive cases investigated by the European Commission and<br />
national competition authorities over the last 15 years in a number of Member States (France,<br />
Denmark, Ireland, Italy, Spain, and Austria), including the UK, which have investigated claims of<br />
price discrimination and other forms of anti-competitive behaviour by sugar suppliers.<br />
However, this information is insufficient to draw a firm unequivocal conclusion regarding the<br />
differential between the intervention price and the actual market price of industrial sugar in EU<br />
Member States and in the UK in particular.<br />
3.2. Impact of the CMO for sugar on UK BCCC production, consumption and<br />
trade<br />
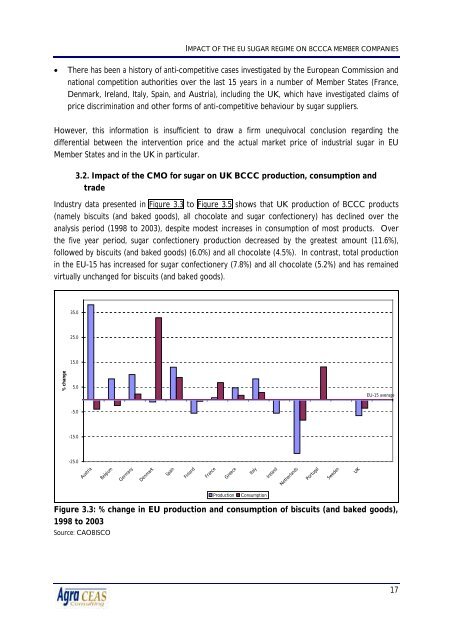
Industry data presented in Figure 3.3 to Figure 3.5 shows that UK production of BCCC products<br />
(namely biscuits (and baked goods), all chocolate and sugar confectionery) has declined over the<br />
analysis period (1998 to 2003), despite modest increases in consumption of most products. Over<br />
the five year period, sugar confectionery production decreased by the greatest amount (11.6%),<br />
followed by biscuits (and baked goods) (6.0%) and all chocolate (4.5%). In contrast, total production<br />
in the EU-15 has increased for sugar confectionery (7.8%) and all chocolate (5.2%) and has remained<br />
virtually unchanged for biscuits (and baked goods).<br />
35.0<br />
25.0<br />
15.0<br />
% change<br />
5.0<br />
EU-15 average<br />
-5.0<br />
-15.0<br />
-25.0<br />
Austria<br />
Belgium<br />
Germany<br />
Denmark<br />
Spain<br />
Finland<br />
France<br />
Greece<br />
Italy<br />
Ireland<br />
Netherlands<br />
Portugal<br />
Sweden<br />
UK<br />
Production<br />
Consumption<br />
Figure 3.3: % change in EU production and consumption of biscuits (and baked goods),<br />
1998 to 2003<br />
Source: CAOBISCO<br />
17