
You also want an ePaper? Increase the reach of your titles
YUMPU automatically turns print PDFs into web optimized ePapers that Google loves.
Surgical Segment Results<br />
<strong>1999</strong> Versus 1998 The surgical segment includes products used<br />
for cataract, refractive and retinal surgery. Segment revenues were<br />
$433 which represented an increase of $48 or 12% over 1998,<br />
and an increase of 14% in constant dollars.<br />
The increase in revenues in all regions was driven primarily<br />
by sales of products for refractive surgery, including Hansatome<br />
microkeratomes and disposable blades, diagnostic technologies<br />
and lasers. This success was aided by the acquisition of Hansa<br />
Research and Development, Inc. in the first quarter of <strong>1999</strong>,<br />
which improved the company’s ability to deliver microkeratomes<br />
and blades to the market. Also contributing to the segment’s<br />
success in the refractive market has been the positive response<br />
received regarding the company’s Orbscan diagnostic technology<br />
which was obtained through the <strong>1999</strong> acquisition of Orbtek, Inc.<br />
Segment earnings increased $21 or 49% due to a reduction<br />
in selling, administrative and general expenses as a percentage of<br />
sales as a result of the successful integration of the two surgical<br />
businesses the company acquired at the beginning of 1998.<br />
1998 Versus 1997 In the U.S., surgical revenues were $231 and<br />
represented 60% of total segment sales. Operations outside the<br />
U.S. accounted for $154 or 40% of total segment sales. Total 1998<br />
segment earnings were $43. All sales and earnings of this segment<br />
related to the 1998 acquisitions and were incremental to 1997.<br />
Operating Costs And Expenses<br />
The ratio of cost of products sold to sales for continuing businesses<br />
was 40.2% in <strong>1999</strong>, versus 39.4% and 36.1% for the years ended<br />
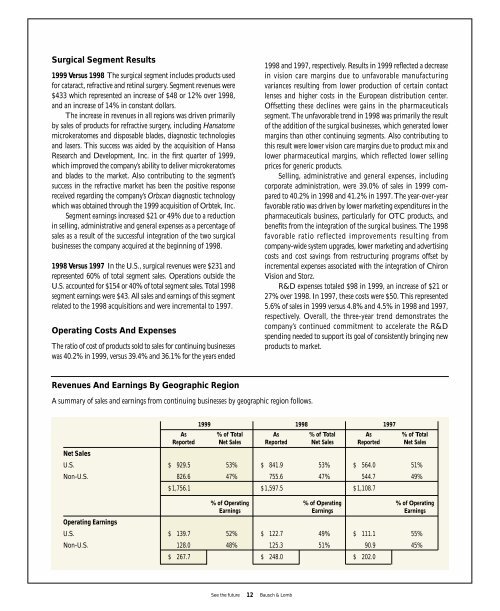
Revenues And Earnings By Geographic Region<br />
A summary of sales and earnings from continuing businesses by geographic region follows.<br />
See the future 12 <strong>Bausch</strong> & <strong>Lomb</strong><br />
1998 and 1997, respectively. Results in <strong>1999</strong> reflected a decrease<br />
in vision care margins due to unfavorable manufacturing<br />
variances resulting from lower production of certain contact<br />
lenses and higher costs in the European distribution center.<br />
Offsetting these declines were gains in the pharmaceuticals<br />
segment. The unfavorable trend in 1998 was primarily the result<br />
of the addition of the surgical businesses, which generated lower<br />
margins than other continuing segments. Also contributing to<br />
this result were lower vision care margins due to product mix and<br />
lower pharmaceutical margins, which reflected lower selling<br />
prices for generic products.<br />
Selling, administrative and general expenses, including<br />
corporate administration, were 39.0% of sales in <strong>1999</strong> compared<br />
to 40.2% in 1998 and 41.2% in 1997. The year-over-year<br />
favorable ratio was driven by lower marketing expenditures in the<br />
pharmaceuticals business, particularly for OTC products, and<br />
benefits from the integration of the surgical business. The 1998<br />
favorable ratio reflected improvements resulting from<br />
company-wide system upgrades, lower marketing and advertising<br />
costs and cost savings from restructuring programs offset by<br />
incremental expenses associated with the integration of Chiron<br />
Vision and Storz.<br />
R&D expenses totaled $98 in <strong>1999</strong>, an increase of $21 or<br />
27% over 1998. In 1997, these costs were $50. This represented<br />
5.6% of sales in <strong>1999</strong> versus 4.8% and 4.5% in 1998 and 1997,<br />
respectively. Overall, the three-year trend demonstrates the<br />
company’s continued commitment to accelerate the R&D<br />
spending needed to support its goal of consistently bringing new<br />
products to market.<br />
<strong>1999</strong> 1998 1997<br />
As % of Total As % of Total As % of Total<br />
<strong>Report</strong>ed Net Sales <strong>Report</strong>ed Net Sales <strong>Report</strong>ed Net Sales<br />
Net Sales<br />
U.S. $ 929.5 53% $ 841.9 53% $ 564.0 51%<br />
Non-U.S. 826.6 47% 755.6 47% 544.7 49%<br />
$ 1,756.1 $ 1,597.5 $ 1,108.7<br />
% of Operating % of Operating % of Operating<br />
Earnings Earnings Earnings<br />
Operating Earnings<br />
U.S. $ 139.7 52% $ 122.7 49% $ 111.1 55%<br />
Non-U.S. 128.0 48% 125.3 51% 90.9 45%<br />
$ 267.7 $ 248.0 $ 202.0