
Create successful ePaper yourself
Turn your PDF publications into a flip-book with our unique Google optimized e-Paper software.
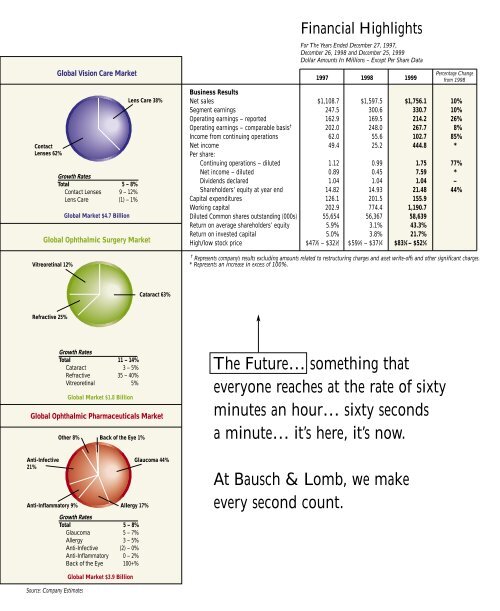
Contact<br />
Lenses 62%<br />
Global Vision Care Market<br />
Growth Rates<br />
Total 5 – 8%<br />
Contact Lenses 9 – 12%<br />
Lens Care (1) – 1%<br />
Global Market $4.7 Billion<br />
Lens Care 38%<br />
Global Ophthalmic Pharmaceuticals Market<br />
Anti-Infective<br />
21%<br />
Global Ophthalmic Surgery Market<br />
Vitreoretinal 12%<br />
Refractive 25%<br />
Other 8%<br />
Anti-Inflammatory 9%<br />
Source: Company Estimates<br />
Growth Rates<br />
Total 11 – 14%<br />
Cataract 3 – 5%<br />
Refractive 35 – 40%<br />
Vitreoretinal 5%<br />
Global Market $1.8 Billion<br />
Back of the Eye 1%<br />
Allergy 17%<br />
Growth Rates<br />
Total 5 – 8%<br />
Glaucoma 5 – 7%<br />
Allergy 3 – 5%<br />
Anti-Infective (2) – 0%<br />
Anti-Inflammatory 0 – 2%<br />
Back of the Eye 100+%<br />
Global Market $3.9 Billion<br />
Cataract 63%<br />
Glaucoma 44%<br />
Financial Highlights<br />
For The Years Ended December 27, 1997,<br />
December 26, 1998 and December 25, <strong>1999</strong><br />
Dollar Amounts In Millions – Except Per Share Data<br />
1997 1998 <strong>1999</strong><br />
Business Results<br />
Net sales $1,108.7 $1,597.5 $1,756.1 10%<br />
Segment earnings 247.5 300.6 330.7 10%<br />
Operating earnings – reported 162.9 169.5 214.2 26%<br />
Operating earnings – comparable basis † 202.0 248.0 267.7 8%<br />
Income from continuing operations 62.0 55.6 102.7 85%<br />
Net income 49.4 25.2 444.8 *<br />
Per share:<br />
Continuing operations – diluted 1.12 0.99 1.75 77%<br />
Net income – diluted 0.89 0.45 7.59 *<br />
Dividends declared 1.04 1.04 1.04 –<br />
Shareholders’ equity at year end 14.82 14.93 21.48 44%<br />
Capital expenditures 126.1 201.5 155.9<br />
Working capital 202.9 774.4 1,190.7<br />
Diluted Common shares outstanding (000s) 55,654 56,367 58,639<br />
Return on average shareholders’ equity 5.9% 3.1% 43.3%<br />
Return on invested capital 5.0% 3.8% 21.7%<br />
High/low stock price $47 7 ⁄8 – $32 1 ⁄2 $59 3 ⁄8 – $37 3 ⁄4 $83 3 ⁄8 – $52 5 ⁄8<br />
† Represents company’s results excluding amounts related to restructuring charges and asset write-offs and other significant charges.<br />
* Represents an increase in excess of 100%.<br />
The Future… something that<br />
everyone reaches at the rate of sixty<br />
minutes an hour… sixty seconds<br />
a minute… it’s here, it’s now.<br />
At <strong>Bausch</strong> & <strong>Lomb</strong>, we make<br />
every second count.<br />
Percentage Change<br />
from 1998