Enterprise Inns plc Annual Report and Accounts 2012
Enterprise Inns plc Annual Report and Accounts 2012
Enterprise Inns plc Annual Report and Accounts 2012

You also want an ePaper? Increase the reach of your titles
YUMPU automatically turns print PDFs into web optimized ePapers that Google loves.
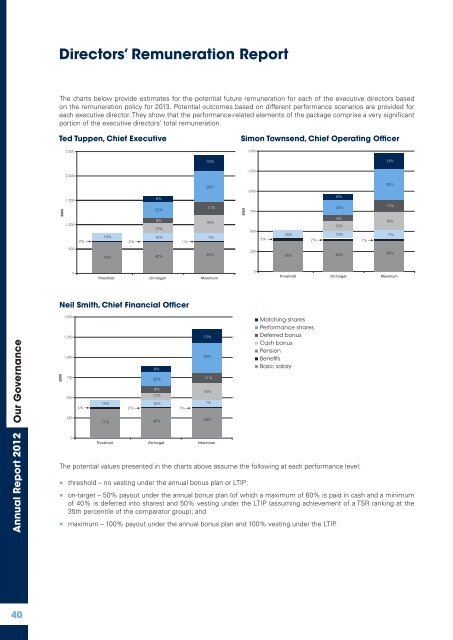
Directors’ Remuneration <strong>Report</strong><br />
The charts below provide estimates for the potential future remuneration for each of the executive directors based<br />
on the remuneration policy for 2013. Potential outcomes based on different performance scenarios are provided for<br />
each executive director. They show that the performance-related elements of the package comprise a very significant<br />
portion of the executive directors’ total remuneration.<br />
Ted Tuppen, Chief Executive<br />
Simon Townsend, Chief Operating Officer<br />
£000<br />
2,500<br />
2,000<br />
1,500<br />
1,000<br />
8%<br />
20%<br />
8%<br />
12%<br />
19%<br />
10%<br />
3% 2%<br />
1%<br />
13%<br />
26%<br />
11%<br />
16%<br />
7%<br />
£000<br />
1,500<br />
Matching shares<br />
Performance shares<br />
Deferred bonus<br />
Cash bonus<br />
1,250<br />
Pension<br />
Benefits<br />
Basic salary<br />
1,000<br />
750<br />
500<br />
5%<br />
19%<br />
2%<br />
8%<br />
20%<br />
8%<br />
12%<br />
10%<br />
1%<br />
13%<br />
26%<br />
11%<br />
16%<br />
7%<br />
Matching<br />
Performan<br />
Deferred b<br />
Cash bon<br />
Pension<br />
Benefits<br />
Basic sala<br />
500<br />
78%<br />
40%<br />
26%<br />
250<br />
76%<br />
40%<br />
26%<br />
0<br />
Threshold On-target Maximum<br />
0<br />
Threshold On-target Maximum<br />
Neil Smith, Chief Financial Officer<br />
<strong>Annual</strong> <strong>Report</strong> <strong>2012</strong> Our Governance<br />
4%<br />
19%<br />
77%<br />
£000<br />
1,500<br />
1,250<br />
1,000<br />
750<br />
500<br />
250<br />
0<br />
4%<br />
2%<br />
19%<br />
77%<br />
8%<br />
20%<br />
8%<br />
12%<br />
10%<br />
2%<br />
20%<br />
12%<br />
10%<br />
40%<br />
Threshold On-target Maximum<br />
The potential values presented in the charts above assume the following at each performance level:<br />
40%<br />
26%<br />
• threshold – no vesting under the annual bonus plan or LTIP;<br />
8%<br />
8%<br />
1%<br />
Matching shares<br />
Performance shares<br />
Deferred bonus<br />
Cash bonus<br />
Pension<br />
Benefits<br />
Basic salary<br />
• on-target – 50% payout under the annual bonus plan (of which a maximum of 60% is paid in cash <strong>and</strong> a minimum<br />
of 40% is deferred into shares) <strong>and</strong> 50% vesting under the LTIP (assuming achievement of a TSR ranking at the<br />
35th percentile of the comparator group); <strong>and</strong><br />
Threshold On-target Maximum<br />
1%<br />
13%<br />
26%<br />
11%<br />
16%<br />
7%<br />
• maximum – 100% payout under the annual bonus plan <strong>and</strong> 100% vesting under the LTIP.<br />
13%<br />
26%<br />
11%<br />
16%<br />
7%<br />
26%<br />
Matching shares<br />
Performance shares<br />
Deferred bonus<br />
Cash bonus<br />
Pension<br />
Benefits<br />
Basic salary<br />
40