Annual Report 2012-2013 - UB Group
Annual Report 2012-2013 - UB Group
Annual Report 2012-2013 - UB Group

Create successful ePaper yourself
Turn your PDF publications into a flip-book with our unique Google optimized e-Paper software.
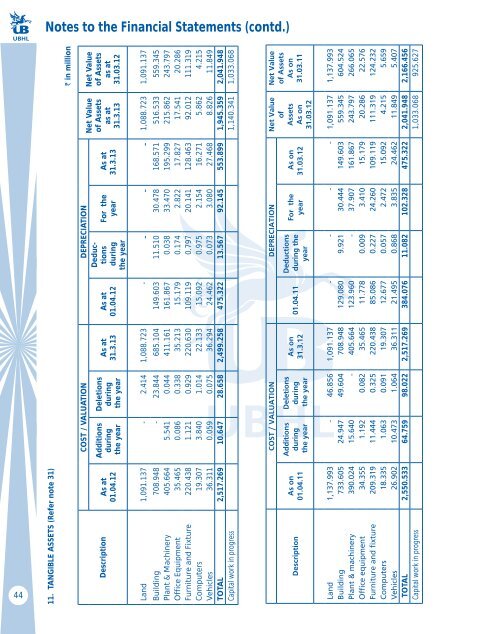
Notes to the Financial Statements (contd.)<br />
44<br />
11. TANGIBLE ASSETS (Refer note 31)<br />
` in million<br />
Net Value<br />
of Assets<br />
as at<br />
31.03.12<br />
Net Value<br />
of Assets<br />
as at<br />
31.3.13<br />
COST / VALUATION DEPRECIATION<br />
As at<br />
31.3.13<br />
For the<br />
year<br />
Deductions<br />
during<br />
the year<br />
As at<br />
01.04.12<br />
As at<br />
31.3.13<br />
Deletions<br />
during<br />
the year<br />
Additions<br />
during<br />
the year<br />
As at<br />
01.04.12<br />
Description<br />
Land 1,091.137 - 2.414 1,088.723 - - - - 1,088.723 1,091.137<br />
Building 708.948 - 23.844 685.104 149.603 11.510 30.478 168.571 516.533 559.345<br />
Plant & Machinery 405.664 5.541 0.044 411.161 161.867 0.038 33.470 195.299 215.862 243.797<br />
Office Equipment 35.465 0.086 0.338 35.213 15.179 0.174 2.822 17.827 17.541 20.286<br />
Furniture and Fixture 220.438 1.121 0.929 220.630 109.119 0.797 20.141 128.463 92.012 111.319<br />
Computers 19.307 3.840 1.014 22.133 15.092 0.975 2.154 16.271 5.862 4.215<br />
Vehicles 36.311 0.059 0.075 36.294 24.462 0.073 3.080 27.468 8.826 11.849<br />
TOTAL 2,517.269 10.647 28.658 2,499.258 475.322 13.567 92.145 553.899 1,945.359 2,041.948<br />
Capital work in progress 1,140.341 1,033.068<br />
Net Value<br />
of Assets<br />
As on<br />
31.03.11<br />
COST / VALUATION DEPRECIATION Net Value<br />
of<br />
Assets<br />
As on<br />
31.03.12<br />
As on<br />
31.03.12<br />
For the<br />
year<br />
Deductions<br />
during the<br />
year<br />
01.04.11<br />
As on<br />
31.3.12<br />
Deletions<br />
during<br />
the year<br />
Additions<br />
during<br />
the year<br />
As on<br />
01.04.11<br />
Description<br />
Land 1,137.993 - 46.856 1,091.137 - - - - 1,091.137 1,137.993<br />
Building 733.605 24.947 49.604 708.948 129.080 9.921 30.444 149.603 559.345 604.524<br />
Plant & machinery 390.024 15.640 - 405.664 123.960 - 37.907 161.867 243.797 266.065<br />
Office equipment 34.355 1.192 0.082 35.465 11.778 0.009 3.410 15.179 20.286 22.576<br />
Furniture and fixture 209.319 11.444 0.325 220.438 85.086 0.227 24.260 109.119 111.319 124.232<br />
Computers 18.335 1.063 0.091 19.307 12.677 0.057 2.472 15.092 4.215 5.659<br />
Vehicles 26.902 10.473 1.064 36.311 21.495 0.868 3.835 24.462 11.849 5.407<br />
TOTAL 2,550.533 64.759 98.022 2,517.269 384.076 11.082 102.328 475.322 2,041.948 2,166.456<br />
Capital work in progress 1,033.068 925.627