Annual Report 2012-2013 - UB Group
Annual Report 2012-2013 - UB Group
Annual Report 2012-2013 - UB Group

You also want an ePaper? Increase the reach of your titles
YUMPU automatically turns print PDFs into web optimized ePapers that Google loves.
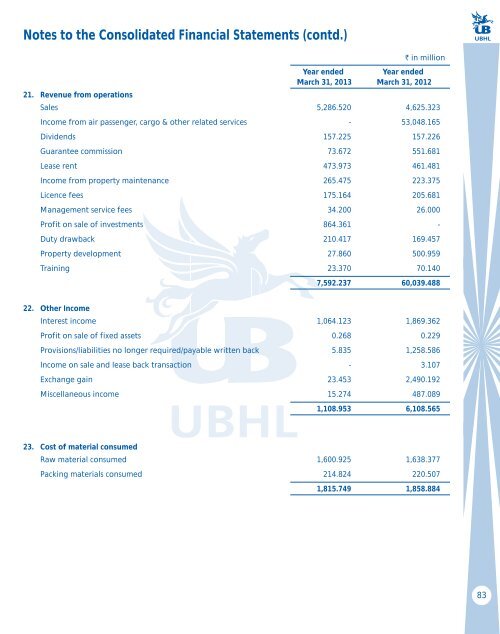
Notes to the Consolidated Financial Statements (contd.)<br />
Year ended<br />
March 31, <strong>2013</strong><br />
` in million<br />
Year ended<br />
March 31, <strong>2012</strong><br />
21. Revenue from operations<br />
Sales 5,286.520 4,625.323<br />
Income from air passenger, cargo & other related services - 53,048.165<br />
Dividends 157.225 157.226<br />
Guarantee commission 73.672 551.681<br />
Lease rent 473.973 461.481<br />
Income from property maintenance 265.475 223.375<br />
Licence fees 175.164 205.681<br />
Management service fees 34.200 26.000<br />
Profit on sale of investments 864.361 -<br />
Duty drawback 210.417 169.457<br />
Property development 27.860 500.959<br />
Training 23.370 70.140<br />
7,592.237 60,039.488<br />
22. Other Income<br />
Interest income 1,064.123 1,869.362<br />
Profit on sale of fixed assets 0.268 0.229<br />
Provisions/liabilities no longer required/payable written back 5.835 1,258.586<br />
Income on sale and lease back transaction - 3.107<br />
Exchange gain 23.453 2,490.192<br />
Miscellaneous income 15.274 487.089<br />
1,108.953 6,108.565<br />
23. Cost of material consumed<br />
Raw material consumed 1,600.925 1,638.377<br />
Packing materials consumed 214.824 220.507<br />
1,815.749 1,858.884<br />
83