Annual Report 2012-2013 - UB Group
Annual Report 2012-2013 - UB Group
Annual Report 2012-2013 - UB Group

You also want an ePaper? Increase the reach of your titles
YUMPU automatically turns print PDFs into web optimized ePapers that Google loves.
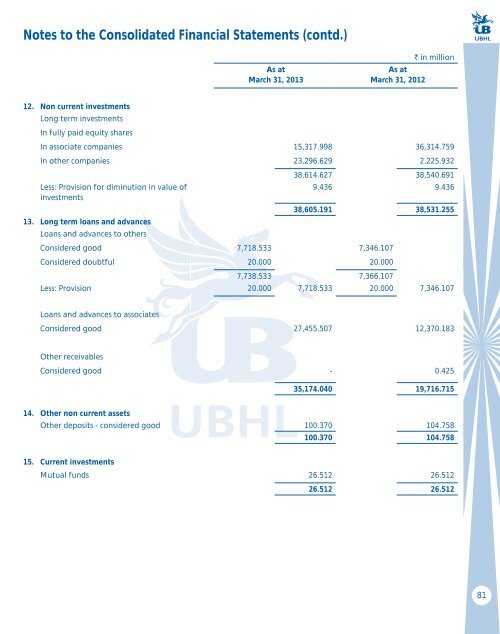
Notes to the Consolidated Financial Statements (contd.)<br />
As at<br />
March 31, <strong>2013</strong><br />
As at<br />
March 31, <strong>2012</strong><br />
` in million<br />
12. Non current investments<br />
Long term investments<br />
In fully paid equity shares<br />
In associate companies 15,317.998 36,314.759<br />
In other companies 23,296.629 2,225.932<br />
38,614.627 38,540.691<br />
Less: Provision for diminution in value of<br />
9.436 9.436<br />
investments<br />
38,605.191 38,531.255<br />
13. Long term loans and advances<br />
Loans and advances to others<br />
Considered good 7,718.533 7,346.107<br />
Considered doubtful 20.000 20.000<br />
7,738.533 7,366.107<br />
Less: Provision 20.000 7,718.533 20.000 7,346.107<br />
Loans and advances to associates<br />
Considered good 27,455.507 12,370.183<br />
Other receivables<br />
Considered good - 0.425<br />
35,174.040 19,716.715<br />
14. Other non current assets<br />
Other deposits - considered good 100.370 104.758<br />
100.370 104.758<br />
15. Current investments<br />
Mutual funds 26.512 26.512<br />
26.512 26.512<br />
81