Annual Report 2012-2013 - UB Group
Annual Report 2012-2013 - UB Group
Annual Report 2012-2013 - UB Group

Create successful ePaper yourself
Turn your PDF publications into a flip-book with our unique Google optimized e-Paper software.
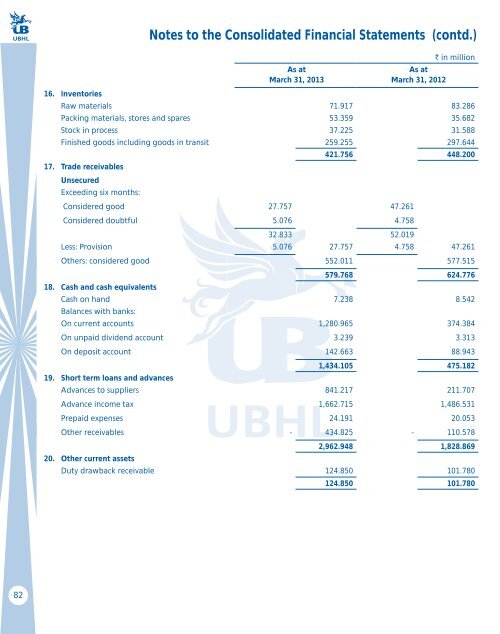
Notes to the Consolidated Financial Statements (contd.)<br />
As at<br />
March 31, <strong>2013</strong><br />
As at<br />
March 31, <strong>2012</strong><br />
` in million<br />
16. Inventories<br />
Raw materials 71.917 83.286<br />
Packing materials, stores and spares 53.359 35.682<br />
Stock in process 37.225 31.588<br />
Finished goods including goods in transit 259.255 297.644<br />
421.756 448.200<br />
17. Trade receivables<br />
Unsecured<br />
Exceeding six months:<br />
Considered good 27.757 47.261<br />
Considered doubtful 5.076 4.758<br />
32.833 52.019<br />
Less: Provision 5.076 27.757 4.758 47.261<br />
Others: considered good 552.011 577.515<br />
579.768 624.776<br />
18. Cash and cash equivalents<br />
Cash on hand 7.238 8.542<br />
Balances with banks:<br />
On current accounts 1,280.965 374.384<br />
On unpaid dividend account 3.239 3.313<br />
On deposit account 142.663 88.943<br />
1,434.105 475.182<br />
19. Short term loans and advances<br />
Advances to suppliers 841.217 211.707<br />
Advance income tax 1,662.715 1,486.531<br />
Prepaid expenses 24.191 20.053<br />
Other receivables - 434.825 - 110.578<br />
2,962.948 1,828.869<br />
20. Other current assets<br />
Duty drawback receivable 124.850 101.780<br />
124.850 101.780<br />
82