Annual Report 2012-2013 - UB Group
Annual Report 2012-2013 - UB Group
Annual Report 2012-2013 - UB Group

Create successful ePaper yourself
Turn your PDF publications into a flip-book with our unique Google optimized e-Paper software.
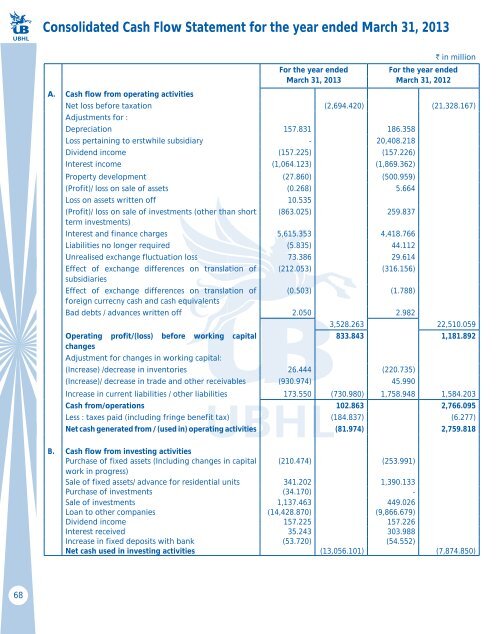
Consolidated Cash Flow Statement for the year ended March 31, <strong>2013</strong><br />
For the year ended<br />
March 31, <strong>2013</strong><br />
` in million<br />
For the year ended<br />
March 31, <strong>2012</strong><br />
A. Cash flow from operating activities<br />
Net loss before taxation (2,694.420) (21,328.167)<br />
Adjustments for :<br />
Depreciation 157.831 186.358<br />
Loss pertaining to erstwhile subsidiary - 20,408.218<br />
Dividend income (157.225) (157.226)<br />
Interest income (1,064.123) (1,869.362)<br />
Property development (27.860) (500.959)<br />
(Profit)/ loss on sale of assets (0.268) 5.664<br />
Loss on assets written off 10.535<br />
(Profit)/ loss on sale of investments (other than short (863.025) 259.837<br />
term investments)<br />
Interest and finance charges 5,615.353 4,418.766<br />
Liabilities no longer required (5.835) 44.112<br />
Unrealised exchange fluctuation loss 73.386 29.614<br />
Effect of exchange differences on translation of (212.053) (316.156)<br />
subsidiaries<br />
Effect of exchange differences on translation of (0.503) (1.788)<br />
foreign currecny cash and cash equivalents<br />
Bad debts / advances written off 2.050 2.982<br />
3,528.263 22,510.059<br />
Operating profit/(loss) before working capital<br />
833.843 1,181.892<br />
changes<br />
Adjustment for changes in working capital:<br />
(Increase) /decrease in inventories 26.444 (220.735)<br />
(Increase)/ decrease in trade and other receivables (930.974) 45.990<br />
Increase in current liabilities / other liabilities 173.550 (730.980) 1,758.948 1,584.203<br />
Cash from/operations 102.863 2,766.095<br />
Less : taxes paid (including fringe benefit tax) (184.837) (6.277)<br />
Net cash generated from / (used in) operating activities (81.974) 2,759.818<br />
B. Cash flow from investing activities<br />
Purchase of fixed assets (Including changes in capital (210.474) (253.991)<br />
work in progress)<br />
Sale of fixed assets/ advance for residential units 341.202 1,390.133<br />
Purchase of investments (34.170) -<br />
Sale of investments 1,137.463 449.026<br />
Loan to other companies (14,428.870) (9,866.679)<br />
Dividend income 157.225 157.226<br />
Interest received 35.243 303.988<br />
Increase in fixed deposits with bank (53.720) (54.552)<br />
Net cash used in investing activities (13,056.101) (7,874.850)<br />
68