Annual Report 2012-2013 - UB Group
Annual Report 2012-2013 - UB Group
Annual Report 2012-2013 - UB Group

You also want an ePaper? Increase the reach of your titles
YUMPU automatically turns print PDFs into web optimized ePapers that Google loves.
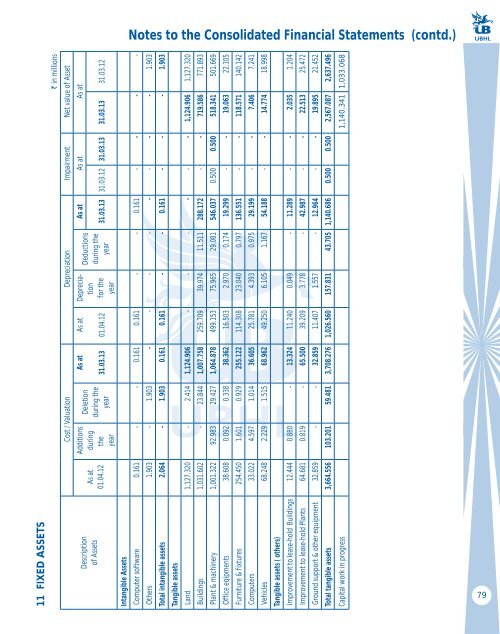
Notes to the Consolidated Financial Statements (contd.)<br />
11 FIXED ASSETS<br />
` in millions<br />
Cost / Valuation Depreciation Impairment Net value of Asset<br />
As at As at As at<br />
Deductions<br />
during the<br />
year<br />
As at As at Depreciation<br />
for the<br />
year<br />
Deletion<br />
during the<br />
year<br />
Additions<br />
during<br />
the<br />
year<br />
As at<br />
01.04.12<br />
Description<br />
of Assets<br />
31.03.13 01.04.12 31.03.13 31.03.12 31.03.13 31.03.13 31.03.12<br />
Intangible Assets<br />
Computer software 0.161 - - 0.161 0.161 - - 0.161 - - - -<br />
Others 1.903 - 1.903 - - - - - - - - 1.903<br />
Total intangible assets 2.064 - 1.903 0.161 0.161 - - 0.161 - - - 1.903<br />
Tangible assets<br />
Land 1,127.320 - 2.414 1,124.906 - - - - - - 1,124.906 1,127.320<br />
Buildings 1,031.602 - 23.844 1,007.758 259.709 39.974 11.511 288.172 - - 719.586 771.893<br />
Plant & machinery 1,001.322 92.983 29.427 1,064.878 499.153 75.965 29.081 546.037 0.500 0.500 518.341 501.669<br />
Office eqipments 38.608 0.092 0.338 38.362 16.503 2.970 0.174 19.299 - - 19.063 22.105<br />
Furniture & fixtures 254.450 1.601 0.929 255.122 114.308 23.040 0.797 136.551 - - 118.571 140.142<br />
Computers 33.022 4.597 1.014 36.605 25.781 4.393 0.975 29.199 - - 7.406 7.241<br />
Vehicles 68.248 2.229 1.515 68.962 49.250 6.105 1.167 54.188 - - 14.774 18.998<br />
Tangible assets ( others)<br />
Improvement to lease-hold Buildings 12.444 0.880 - 13.324 11.240 0.049 - 11.289 - - 2.035 1.204<br />
Improvement to lease-hold Plants 64.681 0.819 - 65.500 39.209 3.778 - 42.987 - - 22.513 25.472<br />
Ground support & other equipment 32.859 - - 32.859 11.407 1.557 - 12.964 - - 19.895 21.452<br />
Total tangible assets 3,664.556 103.201 59.481 3,708.276 1,026.560 157.831 43.705 1,140.686 0.500 0.500 2,567.087 2,637.496<br />
Capital work in progress 1,140.341 1,033.068<br />
79