Demographic Profile of Seniors in PSA 1-A - Detroit Area Agency on ...
Demographic Profile of Seniors in PSA 1-A - Detroit Area Agency on ...
Demographic Profile of Seniors in PSA 1-A - Detroit Area Agency on ...
Create successful ePaper yourself
Turn your PDF publications into a flip-book with our unique Google optimized e-Paper software.
accounted for 1.4 percent. While not <str<strong>on</strong>g>in</str<strong>on</strong>g>cluded <str<strong>on</strong>g>in</str<strong>on</strong>g> the count <str<strong>on</strong>g>of</str<strong>on</strong>g> m<str<strong>on</strong>g>in</str<strong>on</strong>g>orities, 3,014 elderly<br />
(2.0 percent) identified themselves as Lat<str<strong>on</strong>g>in</str<strong>on</strong>g>o/Hispanic.<br />
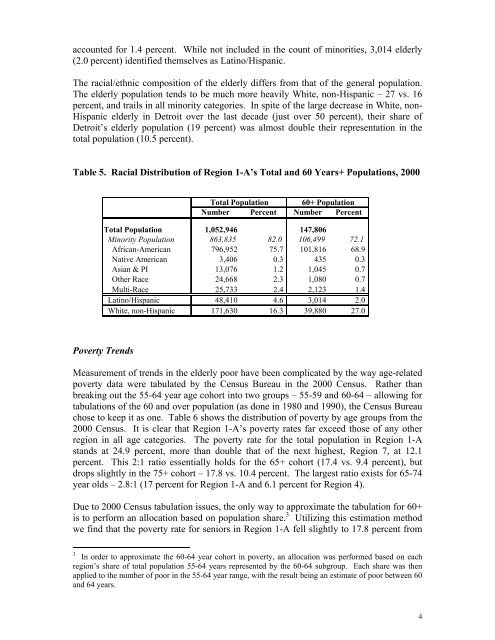
The racial/ethnic compositi<strong>on</strong> <str<strong>on</strong>g>of</str<strong>on</strong>g> the elderly differs from that <str<strong>on</strong>g>of</str<strong>on</strong>g> the general populati<strong>on</strong>.<br />
The elderly populati<strong>on</strong> tends to be much more heavily White, n<strong>on</strong>-Hispanic – 27 vs. 16<br />
percent, and trails <str<strong>on</strong>g>in</str<strong>on</strong>g> all m<str<strong>on</strong>g>in</str<strong>on</strong>g>ority categories. In spite <str<strong>on</strong>g>of</str<strong>on</strong>g> the large decrease <str<strong>on</strong>g>in</str<strong>on</strong>g> White, n<strong>on</strong>-<br />
Hispanic elderly <str<strong>on</strong>g>in</str<strong>on</strong>g> <str<strong>on</strong>g>Detroit</str<strong>on</strong>g> over the last decade (just over 50 percent), their share <str<strong>on</strong>g>of</str<strong>on</strong>g><br />
<str<strong>on</strong>g>Detroit</str<strong>on</strong>g>’s elderly populati<strong>on</strong> (19 percent) was almost double their representati<strong>on</strong> <str<strong>on</strong>g>in</str<strong>on</strong>g> the<br />
total populati<strong>on</strong> (10.5 percent).<br />
Table 5. Racial Distributi<strong>on</strong> <str<strong>on</strong>g>of</str<strong>on</strong>g> Regi<strong>on</strong> 1-A’s Total and 60 Years+ Populati<strong>on</strong>s, 2000<br />
Total Populati<strong>on</strong> 60+ Populati<strong>on</strong><br />
Number Percent Number Percent<br />
Total Populati<strong>on</strong> 1,052,946 147,806<br />
M<str<strong>on</strong>g>in</str<strong>on</strong>g>ority Populati<strong>on</strong> 863,835 82.0 106,499 72.1<br />
African-American 796,952 75.7 101,816 68.9<br />
Native American 3,406 0.3 435 0.3<br />
Asian & PI 13,076 1.2 1,045 0.7<br />
Other Race 24,668 2.3 1,080 0.7<br />
Multi-Race 25,733 2.4 2,123 1.4<br />
Lat<str<strong>on</strong>g>in</str<strong>on</strong>g>o/Hispanic 48,410 4.6 3,014 2.0<br />
White, n<strong>on</strong>-Hispanic 171,630 16.3 39,880 27.0<br />
Poverty Trends<br />
Measurement <str<strong>on</strong>g>of</str<strong>on</strong>g> trends <str<strong>on</strong>g>in</str<strong>on</strong>g> the elderly poor have been complicated by the way age-related<br />
poverty data were tabulated by the Census Bureau <str<strong>on</strong>g>in</str<strong>on</strong>g> the 2000 Census. Rather than<br />
break<str<strong>on</strong>g>in</str<strong>on</strong>g>g out the 55-64 year age cohort <str<strong>on</strong>g>in</str<strong>on</strong>g>to two groups – 55-59 and 60-64 – allow<str<strong>on</strong>g>in</str<strong>on</strong>g>g for<br />
tabulati<strong>on</strong>s <str<strong>on</strong>g>of</str<strong>on</strong>g> the 60 and over populati<strong>on</strong> (as d<strong>on</strong>e <str<strong>on</strong>g>in</str<strong>on</strong>g> 1980 and 1990), the Census Bureau<br />
chose to keep it as <strong>on</strong>e. Table 6 shows the distributi<strong>on</strong> <str<strong>on</strong>g>of</str<strong>on</strong>g> poverty by age groups from the<br />
2000 Census. It is clear that Regi<strong>on</strong> 1-A’s poverty rates far exceed those <str<strong>on</strong>g>of</str<strong>on</strong>g> any other<br />
regi<strong>on</strong> <str<strong>on</strong>g>in</str<strong>on</strong>g> all age categories. The poverty rate for the total populati<strong>on</strong> <str<strong>on</strong>g>in</str<strong>on</strong>g> Regi<strong>on</strong> 1-A<br />
stands at 24.9 percent, more than double that <str<strong>on</strong>g>of</str<strong>on</strong>g> the next highest, Regi<strong>on</strong> 7, at 12.1<br />
percent. This 2:1 ratio essentially holds for the 65+ cohort (17.4 vs. 9.4 percent), but<br />
drops slightly <str<strong>on</strong>g>in</str<strong>on</strong>g> the 75+ cohort – 17.8 vs. 10.4 percent. The largest ratio exists for 65-74<br />
year olds – 2.8:1 (17 percent for Regi<strong>on</strong> 1-A and 6.1 percent for Regi<strong>on</strong> 4).<br />
Due to 2000 Census tabulati<strong>on</strong> issues, the <strong>on</strong>ly way to approximate the tabulati<strong>on</strong> for 60+<br />
is to perform an allocati<strong>on</strong> based <strong>on</strong> populati<strong>on</strong> share. 3 Utiliz<str<strong>on</strong>g>in</str<strong>on</strong>g>g this estimati<strong>on</strong> method<br />
we f<str<strong>on</strong>g>in</str<strong>on</strong>g>d that the poverty rate for seniors <str<strong>on</strong>g>in</str<strong>on</strong>g> Regi<strong>on</strong> 1-A fell slightly to 17.8 percent from<br />
3<br />
In order to approximate the 60-64 year cohort <str<strong>on</strong>g>in</str<strong>on</strong>g> poverty, an allocati<strong>on</strong> was performed based <strong>on</strong> each<br />
regi<strong>on</strong>’s share <str<strong>on</strong>g>of</str<strong>on</strong>g> total populati<strong>on</strong> 55-64 years represented by the 60-64 subgroup. Each share was then<br />
applied to the number <str<strong>on</strong>g>of</str<strong>on</strong>g> poor <str<strong>on</strong>g>in</str<strong>on</strong>g> the 55-64 year range, with the result be<str<strong>on</strong>g>in</str<strong>on</strong>g>g an estimate <str<strong>on</strong>g>of</str<strong>on</strong>g> poor between 60<br />
and 64 years.<br />
4


