Demographic Profile of Seniors in PSA 1-A - Detroit Area Agency on ...
Demographic Profile of Seniors in PSA 1-A - Detroit Area Agency on ...
Demographic Profile of Seniors in PSA 1-A - Detroit Area Agency on ...

You also want an ePaper? Increase the reach of your titles
YUMPU automatically turns print PDFs into web optimized ePapers that Google loves.
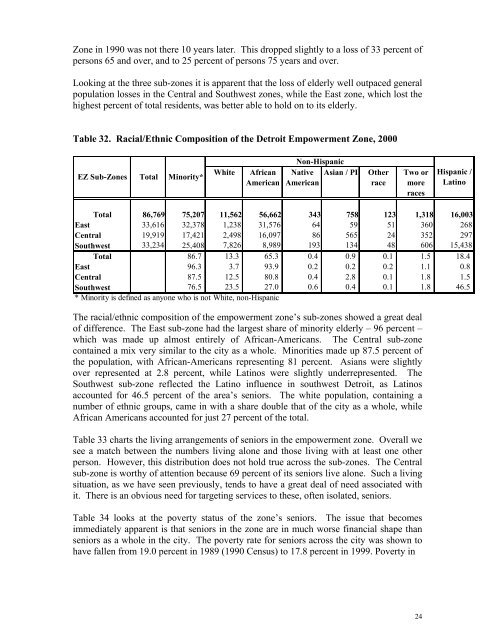
Z<strong>on</strong>e <str<strong>on</strong>g>in</str<strong>on</strong>g> 1990 was not there 10 years later. This dropped slightly to a loss <str<strong>on</strong>g>of</str<strong>on</strong>g> 33 percent <str<strong>on</strong>g>of</str<strong>on</strong>g><br />
pers<strong>on</strong>s 65 and over, and to 25 percent <str<strong>on</strong>g>of</str<strong>on</strong>g> pers<strong>on</strong>s 75 years and over.<br />
Look<str<strong>on</strong>g>in</str<strong>on</strong>g>g at the three sub-z<strong>on</strong>es it is apparent that the loss <str<strong>on</strong>g>of</str<strong>on</strong>g> elderly well outpaced general<br />
populati<strong>on</strong> losses <str<strong>on</strong>g>in</str<strong>on</strong>g> the Central and Southwest z<strong>on</strong>es, while the East z<strong>on</strong>e, which lost the<br />
highest percent <str<strong>on</strong>g>of</str<strong>on</strong>g> total residents, was better able to hold <strong>on</strong> to its elderly.<br />
Table 32. Racial/Ethnic Compositi<strong>on</strong> <str<strong>on</strong>g>of</str<strong>on</strong>g> the <str<strong>on</strong>g>Detroit</str<strong>on</strong>g> Empowerment Z<strong>on</strong>e, 2000<br />
EZ Sub-Z<strong>on</strong>es<br />
Total<br />
M<str<strong>on</strong>g>in</str<strong>on</strong>g>ority*<br />
White<br />
African<br />
American<br />
N<strong>on</strong>-Hispanic<br />
Native Asian / PI<br />
American<br />
Other<br />
race<br />
Two or<br />
more<br />
races<br />
Hispanic /<br />
Lat<str<strong>on</strong>g>in</str<strong>on</strong>g>o<br />
Total 86,769 75,207 11,562 56,662 343 758 123 1,318 16,003<br />
East 33,616 32,378 1,238 31,576 64 59 51 360 268<br />
Central 19,919 17,421 2,498 16,097 86 565 24 352 297<br />
Southwest 33,234 25,408 7,826 8,989 193 134 48 606 15,438<br />
Total 86.7 13.3 65.3 0.4 0.9 0.1 1.5 18.4<br />
East 96.3 3.7 93.9 0.2 0.2 0.2 1.1 0.8<br />
Central 87.5 12.5 80.8 0.4 2.8 0.1 1.8 1.5<br />
Southwest 76.5 23.5 27.0 0.6 0.4 0.1 1.8 46.5<br />
* M<str<strong>on</strong>g>in</str<strong>on</strong>g>ority is def<str<strong>on</strong>g>in</str<strong>on</strong>g>ed as any<strong>on</strong>e who is not White, n<strong>on</strong>-Hispanic<br />
The racial/ethnic compositi<strong>on</strong> <str<strong>on</strong>g>of</str<strong>on</strong>g> the empowerment z<strong>on</strong>e’s sub-z<strong>on</strong>es showed a great deal<br />
<str<strong>on</strong>g>of</str<strong>on</strong>g> difference. The East sub-z<strong>on</strong>e had the largest share <str<strong>on</strong>g>of</str<strong>on</strong>g> m<str<strong>on</strong>g>in</str<strong>on</strong>g>ority elderly – 96 percent –<br />
which was made up almost entirely <str<strong>on</strong>g>of</str<strong>on</strong>g> African-Americans. The Central sub-z<strong>on</strong>e<br />
c<strong>on</strong>ta<str<strong>on</strong>g>in</str<strong>on</strong>g>ed a mix very similar to the city as a whole. M<str<strong>on</strong>g>in</str<strong>on</strong>g>orities made up 87.5 percent <str<strong>on</strong>g>of</str<strong>on</strong>g><br />
the populati<strong>on</strong>, with African-Americans represent<str<strong>on</strong>g>in</str<strong>on</strong>g>g 81 percent. Asians were slightly<br />
over represented at 2.8 percent, while Lat<str<strong>on</strong>g>in</str<strong>on</strong>g>os were slightly underrepresented. The<br />
Southwest sub-z<strong>on</strong>e reflected the Lat<str<strong>on</strong>g>in</str<strong>on</strong>g>o <str<strong>on</strong>g>in</str<strong>on</strong>g>fluence <str<strong>on</strong>g>in</str<strong>on</strong>g> southwest <str<strong>on</strong>g>Detroit</str<strong>on</strong>g>, as Lat<str<strong>on</strong>g>in</str<strong>on</strong>g>os<br />
accounted for 46.5 percent <str<strong>on</strong>g>of</str<strong>on</strong>g> the area’s seniors. The white populati<strong>on</strong>, c<strong>on</strong>ta<str<strong>on</strong>g>in</str<strong>on</strong>g><str<strong>on</strong>g>in</str<strong>on</strong>g>g a<br />
number <str<strong>on</strong>g>of</str<strong>on</strong>g> ethnic groups, came <str<strong>on</strong>g>in</str<strong>on</strong>g> with a share double that <str<strong>on</strong>g>of</str<strong>on</strong>g> the city as a whole, while<br />
African Americans accounted for just 27 percent <str<strong>on</strong>g>of</str<strong>on</strong>g> the total.<br />
Table 33 charts the liv<str<strong>on</strong>g>in</str<strong>on</strong>g>g arrangements <str<strong>on</strong>g>of</str<strong>on</strong>g> seniors <str<strong>on</strong>g>in</str<strong>on</strong>g> the empowerment z<strong>on</strong>e. Overall we<br />
see a match between the numbers liv<str<strong>on</strong>g>in</str<strong>on</strong>g>g al<strong>on</strong>e and those liv<str<strong>on</strong>g>in</str<strong>on</strong>g>g with at least <strong>on</strong>e other<br />
pers<strong>on</strong>. However, this distributi<strong>on</strong> does not hold true across the sub-z<strong>on</strong>es. The Central<br />
sub-z<strong>on</strong>e is worthy <str<strong>on</strong>g>of</str<strong>on</strong>g> attenti<strong>on</strong> because 69 percent <str<strong>on</strong>g>of</str<strong>on</strong>g> its seniors live al<strong>on</strong>e. Such a liv<str<strong>on</strong>g>in</str<strong>on</strong>g>g<br />
situati<strong>on</strong>, as we have seen previously, tends to have a great deal <str<strong>on</strong>g>of</str<strong>on</strong>g> need associated with<br />
it. There is an obvious need for target<str<strong>on</strong>g>in</str<strong>on</strong>g>g services to these, <str<strong>on</strong>g>of</str<strong>on</strong>g>ten isolated, seniors.<br />
Table 34 looks at the poverty status <str<strong>on</strong>g>of</str<strong>on</strong>g> the z<strong>on</strong>e’s seniors. The issue that becomes<br />
immediately apparent is that seniors <str<strong>on</strong>g>in</str<strong>on</strong>g> the z<strong>on</strong>e are <str<strong>on</strong>g>in</str<strong>on</strong>g> much worse f<str<strong>on</strong>g>in</str<strong>on</strong>g>ancial shape than<br />
seniors as a whole <str<strong>on</strong>g>in</str<strong>on</strong>g> the city. The poverty rate for seniors across the city was shown to<br />
have fallen from 19.0 percent <str<strong>on</strong>g>in</str<strong>on</strong>g> 1989 (1990 Census) to 17.8 percent <str<strong>on</strong>g>in</str<strong>on</strong>g> 1999. Poverty <str<strong>on</strong>g>in</str<strong>on</strong>g><br />
24