Demographic Profile of Seniors in PSA 1-A - Detroit Area Agency on ...
Demographic Profile of Seniors in PSA 1-A - Detroit Area Agency on ...
Demographic Profile of Seniors in PSA 1-A - Detroit Area Agency on ...

Create successful ePaper yourself
Turn your PDF publications into a flip-book with our unique Google optimized e-Paper software.
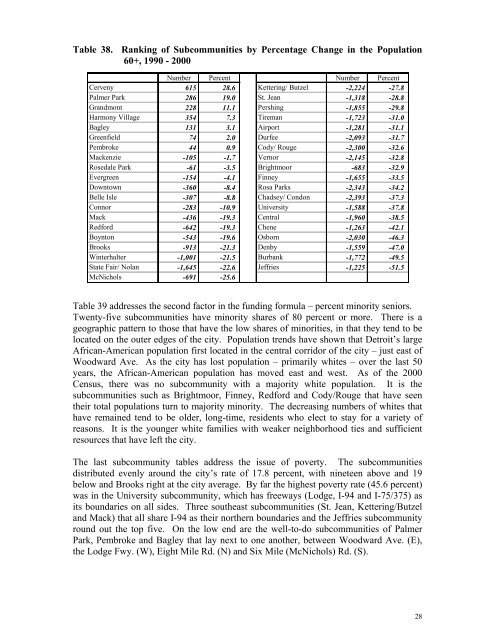
Table 38. Rank<str<strong>on</strong>g>in</str<strong>on</strong>g>g <str<strong>on</strong>g>of</str<strong>on</strong>g> Subcommunities by Percentage Change <str<strong>on</strong>g>in</str<strong>on</strong>g> the Populati<strong>on</strong><br />
60+, 1990 - 2000<br />
Number Percent Number Percent<br />
Cerveny 615 28.6 Ketter<str<strong>on</strong>g>in</str<strong>on</strong>g>g/ Butzel -2,224 -27.8<br />
Palmer Park 286 19.0 St. Jean -1,318 -28.8<br />
Grandm<strong>on</strong>t 228 11.1 Persh<str<strong>on</strong>g>in</str<strong>on</strong>g>g -1,855 -29.8<br />
Harm<strong>on</strong>y Village 354 7.3 Tireman -1,723 -31.0<br />
Bagley 131 3.1 Airport -1,281 -31.1<br />
Greenfield 74 2.0 Durfee -2,093 -31.7<br />
Pembroke 44 0.9 Cody/ Rouge -2,300 -32.6<br />
Mackenzie -105 -1.7 Vernor -2,145 -32.8<br />
Rosedale Park -61 -3.5 Brightmoor -683 -32.9<br />
Evergreen -154 -4.1 F<str<strong>on</strong>g>in</str<strong>on</strong>g>ney -1,655 -33.5<br />
Downtown -360 -8.4 Rosa Parks -2,343 -34.2<br />
Belle Isle -307 -8.8 Chadsey/ C<strong>on</strong>d<strong>on</strong> -2,393 -37.3<br />
C<strong>on</strong>nor -283 -10.9 University -1,588 -37.8<br />
Mack -436 -19.3 Central -1,960 -38.5<br />
Redford -642 -19.3 Chene -1,263 -42.1<br />
Boynt<strong>on</strong> -543 -19.6 Osborn -2,030 -46.3<br />
Brooks -913 -21.3 Denby -1,559 -47.0<br />
W<str<strong>on</strong>g>in</str<strong>on</strong>g>terhalter -1,001 -21.5 Burbank -1,772 -49.5<br />
State Fair/ Nolan -1,645 -22.6 Jeffries -1,225 -51.5<br />
McNichols -691 -25.6<br />
Table 39 addresses the sec<strong>on</strong>d factor <str<strong>on</strong>g>in</str<strong>on</strong>g> the fund<str<strong>on</strong>g>in</str<strong>on</strong>g>g formula – percent m<str<strong>on</strong>g>in</str<strong>on</strong>g>ority seniors.<br />
Twenty-five subcommunities have m<str<strong>on</strong>g>in</str<strong>on</strong>g>ority shares <str<strong>on</strong>g>of</str<strong>on</strong>g> 80 percent or more. There is a<br />
geographic pattern to those that have the low shares <str<strong>on</strong>g>of</str<strong>on</strong>g> m<str<strong>on</strong>g>in</str<strong>on</strong>g>orities, <str<strong>on</strong>g>in</str<strong>on</strong>g> that they tend to be<br />
located <strong>on</strong> the outer edges <str<strong>on</strong>g>of</str<strong>on</strong>g> the city. Populati<strong>on</strong> trends have shown that <str<strong>on</strong>g>Detroit</str<strong>on</strong>g>’s large<br />
African-American populati<strong>on</strong> first located <str<strong>on</strong>g>in</str<strong>on</strong>g> the central corridor <str<strong>on</strong>g>of</str<strong>on</strong>g> the city – just east <str<strong>on</strong>g>of</str<strong>on</strong>g><br />
Woodward Ave. As the city has lost populati<strong>on</strong> – primarily whites – over the last 50<br />
years, the African-American populati<strong>on</strong> has moved east and west. As <str<strong>on</strong>g>of</str<strong>on</strong>g> the 2000<br />
Census, there was no subcommunity with a majority white populati<strong>on</strong>. It is the<br />
subcommunities such as Brightmoor, F<str<strong>on</strong>g>in</str<strong>on</strong>g>ney, Redford and Cody/Rouge that have seen<br />
their total populati<strong>on</strong>s turn to majority m<str<strong>on</strong>g>in</str<strong>on</strong>g>ority. The decreas<str<strong>on</strong>g>in</str<strong>on</strong>g>g numbers <str<strong>on</strong>g>of</str<strong>on</strong>g> whites that<br />
have rema<str<strong>on</strong>g>in</str<strong>on</strong>g>ed tend to be older, l<strong>on</strong>g-time, residents who elect to stay for a variety <str<strong>on</strong>g>of</str<strong>on</strong>g><br />
reas<strong>on</strong>s. It is the younger white families with weaker neighborhood ties and sufficient<br />
resources that have left the city.<br />
The last subcommunity tables address the issue <str<strong>on</strong>g>of</str<strong>on</strong>g> poverty. The subcommunities<br />
distributed evenly around the city’s rate <str<strong>on</strong>g>of</str<strong>on</strong>g> 17.8 percent, with n<str<strong>on</strong>g>in</str<strong>on</strong>g>eteen above and 19<br />
below and Brooks right at the city average. By far the highest poverty rate (45.6 percent)<br />
was <str<strong>on</strong>g>in</str<strong>on</strong>g> the University subcommunity, which has freeways (Lodge, I-94 and I-75/375) as<br />
its boundaries <strong>on</strong> all sides. Three southeast subcommunities (St. Jean, Ketter<str<strong>on</strong>g>in</str<strong>on</strong>g>g/Butzel<br />
and Mack) that all share I-94 as their northern boundaries and the Jeffries subcommunity<br />
round out the top five. On the low end are the well-to-do subcommunities <str<strong>on</strong>g>of</str<strong>on</strong>g> Palmer<br />
Park, Pembroke and Bagley that lay next to <strong>on</strong>e another, between Woodward Ave. (E),<br />
the Lodge Fwy. (W), Eight Mile Rd. (N) and Six Mile (McNichols) Rd. (S).<br />
28