Demographic Profile of Seniors in PSA 1-A - Detroit Area Agency on ...
Demographic Profile of Seniors in PSA 1-A - Detroit Area Agency on ...
Demographic Profile of Seniors in PSA 1-A - Detroit Area Agency on ...

Create successful ePaper yourself
Turn your PDF publications into a flip-book with our unique Google optimized e-Paper software.
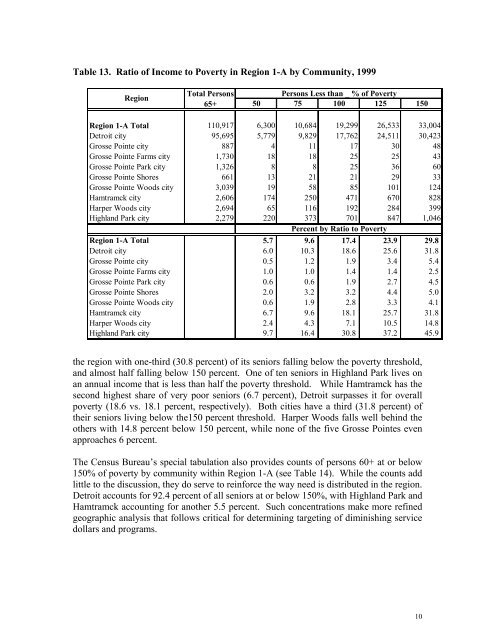
Table 13. Ratio <str<strong>on</strong>g>of</str<strong>on</strong>g> Income to Poverty <str<strong>on</strong>g>in</str<strong>on</strong>g> Regi<strong>on</strong> 1-A by Community, 1999<br />
Regi<strong>on</strong><br />
Total Pers<strong>on</strong>s<br />
65+<br />
Pers<strong>on</strong>s Less than _ % <str<strong>on</strong>g>of</str<strong>on</strong>g> Poverty<br />
50 75 100 125 150<br />
Regi<strong>on</strong> 1-A Total 110,917 6,300 10,684 19,299 26,533 33,004<br />
<str<strong>on</strong>g>Detroit</str<strong>on</strong>g> city 95,695 5,779 9,829 17,762 24,511 30,423<br />
Grosse Po<str<strong>on</strong>g>in</str<strong>on</strong>g>te city 887 4 11 17 30 48<br />
Grosse Po<str<strong>on</strong>g>in</str<strong>on</strong>g>te Farms city 1,730 18 18 25 25 43<br />
Grosse Po<str<strong>on</strong>g>in</str<strong>on</strong>g>te Park city 1,326 8 8 25 36 60<br />
Grosse Po<str<strong>on</strong>g>in</str<strong>on</strong>g>te Shores 661 13 21 21 29 33<br />
Grosse Po<str<strong>on</strong>g>in</str<strong>on</strong>g>te Woods city 3,039 19 58 85 101 124<br />
Hamtramck city 2,606 174 250 471 670 828<br />
Harper Woods city 2,694 65 116 192 284 399<br />
Highland Park city 2,279 220 373 701 847 1,046<br />
Percent by Ratio to Poverty<br />
Regi<strong>on</strong> 1-A Total 5.7 9.6 17.4 23.9 29.8<br />
<str<strong>on</strong>g>Detroit</str<strong>on</strong>g> city 6.0 10.3 18.6 25.6 31.8<br />
Grosse Po<str<strong>on</strong>g>in</str<strong>on</strong>g>te city 0.5 1.2 1.9 3.4 5.4<br />
Grosse Po<str<strong>on</strong>g>in</str<strong>on</strong>g>te Farms city 1.0 1.0 1.4 1.4 2.5<br />
Grosse Po<str<strong>on</strong>g>in</str<strong>on</strong>g>te Park city 0.6 0.6 1.9 2.7 4.5<br />
Grosse Po<str<strong>on</strong>g>in</str<strong>on</strong>g>te Shores 2.0 3.2 3.2 4.4 5.0<br />
Grosse Po<str<strong>on</strong>g>in</str<strong>on</strong>g>te Woods city 0.6 1.9 2.8 3.3 4.1<br />
Hamtramck city 6.7 9.6 18.1 25.7 31.8<br />
Harper Woods city 2.4 4.3 7.1 10.5 14.8<br />
Highland Park city 9.7 16.4 30.8 37.2 45.9<br />
the regi<strong>on</strong> with <strong>on</strong>e-third (30.8 percent) <str<strong>on</strong>g>of</str<strong>on</strong>g> its seniors fall<str<strong>on</strong>g>in</str<strong>on</strong>g>g below the poverty threshold,<br />
and almost half fall<str<strong>on</strong>g>in</str<strong>on</strong>g>g below 150 percent. One <str<strong>on</strong>g>of</str<strong>on</strong>g> ten seniors <str<strong>on</strong>g>in</str<strong>on</strong>g> Highland Park lives <strong>on</strong><br />
an annual <str<strong>on</strong>g>in</str<strong>on</strong>g>come that is less than half the poverty threshold. While Hamtramck has the<br />
sec<strong>on</strong>d highest share <str<strong>on</strong>g>of</str<strong>on</strong>g> very poor seniors (6.7 percent), <str<strong>on</strong>g>Detroit</str<strong>on</strong>g> surpasses it for overall<br />
poverty (18.6 vs. 18.1 percent, respectively). Both cities have a third (31.8 percent) <str<strong>on</strong>g>of</str<strong>on</strong>g><br />
their seniors liv<str<strong>on</strong>g>in</str<strong>on</strong>g>g below the150 percent threshold. Harper Woods falls well beh<str<strong>on</strong>g>in</str<strong>on</strong>g>d the<br />
others with 14.8 percent below 150 percent, while n<strong>on</strong>e <str<strong>on</strong>g>of</str<strong>on</strong>g> the five Grosse Po<str<strong>on</strong>g>in</str<strong>on</strong>g>tes even<br />
approaches 6 percent.<br />
The Census Bureau’s special tabulati<strong>on</strong> also provides counts <str<strong>on</strong>g>of</str<strong>on</strong>g> pers<strong>on</strong>s 60+ at or below<br />
150% <str<strong>on</strong>g>of</str<strong>on</strong>g> poverty by community with<str<strong>on</strong>g>in</str<strong>on</strong>g> Regi<strong>on</strong> 1-A (see Table 14). While the counts add<br />
little to the discussi<strong>on</strong>, they do serve to re<str<strong>on</strong>g>in</str<strong>on</strong>g>force the way need is distributed <str<strong>on</strong>g>in</str<strong>on</strong>g> the regi<strong>on</strong>.<br />
<str<strong>on</strong>g>Detroit</str<strong>on</strong>g> accounts for 92.4 percent <str<strong>on</strong>g>of</str<strong>on</strong>g> all seniors at or below 150%, with Highland Park and<br />
Hamtramck account<str<strong>on</strong>g>in</str<strong>on</strong>g>g for another 5.5 percent. Such c<strong>on</strong>centrati<strong>on</strong>s make more ref<str<strong>on</strong>g>in</str<strong>on</strong>g>ed<br />
geographic analysis that follows critical for determ<str<strong>on</strong>g>in</str<strong>on</strong>g><str<strong>on</strong>g>in</str<strong>on</strong>g>g target<str<strong>on</strong>g>in</str<strong>on</strong>g>g <str<strong>on</strong>g>of</str<strong>on</strong>g> dim<str<strong>on</strong>g>in</str<strong>on</strong>g>ish<str<strong>on</strong>g>in</str<strong>on</strong>g>g service<br />
dollars and programs.<br />
10