Demographic Profile of Seniors in PSA 1-A - Detroit Area Agency on ...
Demographic Profile of Seniors in PSA 1-A - Detroit Area Agency on ...
Demographic Profile of Seniors in PSA 1-A - Detroit Area Agency on ...

You also want an ePaper? Increase the reach of your titles
YUMPU automatically turns print PDFs into web optimized ePapers that Google loves.
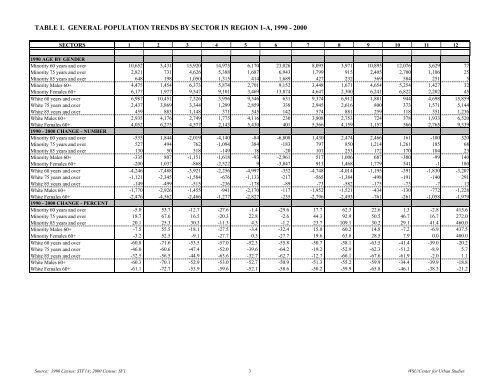
TABLE 1. GENERAL POPULATION TRENDS BY SECTOR IN REGION 1-A, 1990 - 2000<br />
SECTORS<br />
1990 AGE BY GENDER<br />
M<str<strong>on</strong>g>in</str<strong>on</strong>g>ority 60 years and over<br />
M<str<strong>on</strong>g>in</str<strong>on</strong>g>ority 75 years and over<br />
M<str<strong>on</strong>g>in</str<strong>on</strong>g>ority 85 years and over<br />
M<str<strong>on</strong>g>in</str<strong>on</strong>g>ority Males 60+<br />
M<str<strong>on</strong>g>in</str<strong>on</strong>g>ority Females 60+<br />
White 60 years and over<br />
White 75 years and over<br />
White 85 years and over<br />
White Males 60+<br />
White Females 60+<br />
1990 - 2000 CHANGE - NUMBER<br />
M<str<strong>on</strong>g>in</str<strong>on</strong>g>ority 60 years and over<br />
M<str<strong>on</strong>g>in</str<strong>on</strong>g>ority 75 years and over<br />
M<str<strong>on</strong>g>in</str<strong>on</strong>g>ority 85 years and over<br />
M<str<strong>on</strong>g>in</str<strong>on</strong>g>ority Males 60+<br />
M<str<strong>on</strong>g>in</str<strong>on</strong>g>ority Females 60+<br />
White 60 years and over<br />
White 75 years and over<br />
White 85 years and over<br />
White Males 60+<br />
White Females 60+<br />
1990 - 2000 CHANGE - PERCENT<br />
M<str<strong>on</strong>g>in</str<strong>on</strong>g>ority 60 years and over<br />
M<str<strong>on</strong>g>in</str<strong>on</strong>g>ority 75 years and over<br />
M<str<strong>on</strong>g>in</str<strong>on</strong>g>ority 85 years and over<br />
M<str<strong>on</strong>g>in</str<strong>on</strong>g>ority Males 60+<br />
M<str<strong>on</strong>g>in</str<strong>on</strong>g>ority Females 60+<br />
White 60 years and over<br />
White 75 years and over<br />
White 85 years and over<br />
White Males 60+<br />
White Females 60+<br />
1 2 3 4 5 6 7 8 9 10 11 12<br />
10,652 3,431 15,920 14,975 6,170 23,026 8,095 3,971 10,895 12,076 3,629 77<br />
2,821 731 4,626 5,388 1,687 6,943 1,799 915 2,405 2,700 1,106 25<br />
648 198 1,050 1,315 414 1,689 427 232 569 584 251 5<br />
4,475 1,454 6,373 5,874 2,701 9,152 3,448 1,671 4,654 5,254 1,427 32<br />
6,177 1,977 9,547 9,101 3,469 13,874 4,647 2,300 6,241 6,822 2,202 45<br />
6,987 10,451 7,326 3,956 9,546 631 9,374 6,912 1,881 944 4,698 15,859<br />
2,437 3,869 3,344 1,299 2,859 338 2,945 2,616 800 373 1,571 5,144<br />
459 883 1,148 371 545 142 574 881 259 118 351 1,236<br />
2,935 4,176 2,749 1,775 4,116 230 3,808 2,753 724 378 1,933 6,520<br />
4,052 6,275 4,577 2,143 5,430 401 5,566 4,159 1,157 566 2,765 9,339<br />
-535 1,844 -2,019 -4,140 -84 -6,808 1,430 2,474 2,466 161 -100 320<br />
527 494 762 -1,094 384 -183 797 850 1,214 1,261 185 68<br />
130 50 318 -149 18 -20 101 253 172 170 104 23<br />
-335 807 -1,151 -1,618 -93 -2,961 517 1,006 687 -380 -99 140<br />
-200 1,037 -868 -2,522 9 -3,847 913 1,468 1,779 541 -1 180<br />
-4,246 -7,488 -3,921 -2,256 -4,997 -352 -4,748 -4,014 -1,195 -391 -1,830 -3,207<br />
-1,121 -2,345 -1,584 -676 -1,133 -217 -565 -1,384 -498 -191 -140 291<br />
-149 -499 -515 -236 -178 -89 -73 -582 -175 -73 -7 13<br />
-1,770 -2,926 -1,455 -941 -2,170 -117 -1,952 -1,521 -434 -130 -772 -1,228<br />
-2,476 -4,562 -2,466 -1,277 -2,827 -235 -2,796 -2,493 -761 -261 -1,058 -1,979<br />
-5.0 53.7 -12.7 -27.6 -1.4 -29.6 17.7 62.3 22.6 1.3 -2.8 415.6<br />
18.7 67.6 16.5 -20.3 22.8 -2.6 44.3 92.9 50.5 46.7 16.7 272.0<br />
20.1 25.3 30.3 -11.3 4.3 -1.2 23.7 109.1 30.2 29.1 41.4 460.0<br />
-7.5 55.5 -18.1 -27.5 -3.4 -32.4 15.0 60.2 14.8 -7.2 -6.9 437.5<br />
-3.2 52.5 -9.1 -27.7 0.3 -27.7 19.6 63.8 28.5 7.9 0.0 400.0<br />
-60.8 -71.6 -53.5 -57.0 -52.3 -55.8 -50.7 -58.1 -63.5 -41.4 -39.0 -20.2<br />
-46.0 -60.6 -47.4 -52.0 -39.6 -64.2 -19.2 -52.9 -62.3 -51.2 -8.9 5.7<br />
-32.5 -56.5 -44.9 -63.6 -32.7 -62.7 -12.7 -66.1 -67.6 -61.9 -2.0 1.1<br />
-60.3 -70.1 -52.9 -53.0 -52.7 -50.9 -51.3 -55.2 -59.9 -34.4 -39.9 -18.8<br />
-61.1 -72.7 -53.9 -59.6 -52.1 -58.6 -50.2 -59.9 -65.8 -46.1 -38.3 -21.2<br />
Source: 1990 Census: STF1A; 2000 Census: SF1 3 WSU/Center for Urban Studies