Demographic Profile of Seniors in PSA 1-A - Detroit Area Agency on ...
Demographic Profile of Seniors in PSA 1-A - Detroit Area Agency on ...
Demographic Profile of Seniors in PSA 1-A - Detroit Area Agency on ...

Create successful ePaper yourself
Turn your PDF publications into a flip-book with our unique Google optimized e-Paper software.
that <str<strong>on</strong>g>of</str<strong>on</strong>g> total populati<strong>on</strong> loss <str<strong>on</strong>g>in</str<strong>on</strong>g> the 60+ category, as a result <str<strong>on</strong>g>of</str<strong>on</strong>g> the decrease <str<strong>on</strong>g>in</str<strong>on</strong>g> the regi<strong>on</strong>’s<br />
overall poverty rate from 19.0 to 17.7 percent. The poverty rate <str<strong>on</strong>g>in</str<strong>on</strong>g> 1989 varied greatly<br />
across sectors – rang<str<strong>on</strong>g>in</str<strong>on</strong>g>g from 3.6 percent <str<strong>on</strong>g>in</str<strong>on</strong>g> Sector 12 (the Grosse Po<str<strong>on</strong>g>in</str<strong>on</strong>g>tes) to 35.4<br />
percent <str<strong>on</strong>g>in</str<strong>on</strong>g> Sector 4, which covers <str<strong>on</strong>g>Detroit</str<strong>on</strong>g>’s downtown. Three sectors – 3, 4 and 6 –<br />
together accounted for almost half <str<strong>on</strong>g>of</str<strong>on</strong>g> the poor seniors <str<strong>on</strong>g>in</str<strong>on</strong>g> the regi<strong>on</strong>.<br />
The Regi<strong>on</strong>’s drop <str<strong>on</strong>g>in</str<strong>on</strong>g> poverty am<strong>on</strong>g seniors was not reflected <str<strong>on</strong>g>in</str<strong>on</strong>g> all sectors. In fact, <strong>on</strong>ly<br />
six sectors experienced decreases <str<strong>on</strong>g>in</str<strong>on</strong>g> poverty, while six experienced <str<strong>on</strong>g>in</str<strong>on</strong>g>creases. The<br />
rank<str<strong>on</strong>g>in</str<strong>on</strong>g>g <str<strong>on</strong>g>of</str<strong>on</strong>g> Sector 12 as lowest and Sector 2 as highest held, though the gap between them<br />
decreased slightly. The largest decrease occurred <str<strong>on</strong>g>in</str<strong>on</strong>g> Sector 4, which, while rema<str<strong>on</strong>g>in</str<strong>on</strong>g><str<strong>on</strong>g>in</str<strong>on</strong>g>g the<br />
sector with the highest percentage <str<strong>on</strong>g>of</str<strong>on</strong>g> seniors <str<strong>on</strong>g>in</str<strong>on</strong>g> poverty, saw its rate drop from 35.4 to<br />
29.8 percent. Sector 9 came next with a decrease <str<strong>on</strong>g>of</str<strong>on</strong>g> 2.4 percentage po<str<strong>on</strong>g>in</str<strong>on</strong>g>ts, from 17.8 to<br />
15.4. The greatest <str<strong>on</strong>g>in</str<strong>on</strong>g>creases were experienced <str<strong>on</strong>g>in</str<strong>on</strong>g> Sectors 1 and 2. In spite <str<strong>on</strong>g>of</str<strong>on</strong>g> <str<strong>on</strong>g>in</str<strong>on</strong>g>creases <str<strong>on</strong>g>in</str<strong>on</strong>g><br />
poverty rates <str<strong>on</strong>g>in</str<strong>on</strong>g> half the sectors, the number <str<strong>on</strong>g>of</str<strong>on</strong>g> seniors <str<strong>on</strong>g>in</str<strong>on</strong>g> poverty decreased <str<strong>on</strong>g>in</str<strong>on</strong>g> all sectors.<br />
The largest numerical decrease, 3,037, occurred <str<strong>on</strong>g>in</str<strong>on</strong>g> Sector 4, while Sectors 6 and 3 also<br />
experienced large decl<str<strong>on</strong>g>in</str<strong>on</strong>g>es – 1,832 and 1,406, respectively.<br />
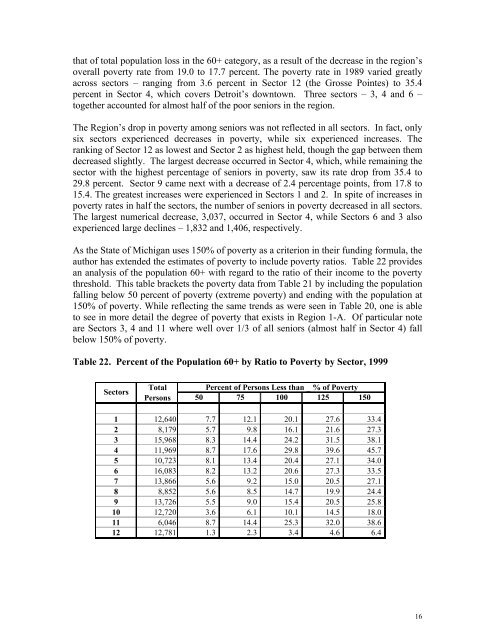
As the State <str<strong>on</strong>g>of</str<strong>on</strong>g> Michigan uses 150% <str<strong>on</strong>g>of</str<strong>on</strong>g> poverty as a criteri<strong>on</strong> <str<strong>on</strong>g>in</str<strong>on</strong>g> their fund<str<strong>on</strong>g>in</str<strong>on</strong>g>g formula, the<br />
author has extended the estimates <str<strong>on</strong>g>of</str<strong>on</strong>g> poverty to <str<strong>on</strong>g>in</str<strong>on</strong>g>clude poverty ratios. Table 22 provides<br />
an analysis <str<strong>on</strong>g>of</str<strong>on</strong>g> the populati<strong>on</strong> 60+ with regard to the ratio <str<strong>on</strong>g>of</str<strong>on</strong>g> their <str<strong>on</strong>g>in</str<strong>on</strong>g>come to the poverty<br />
threshold. This table brackets the poverty data from Table 21 by <str<strong>on</strong>g>in</str<strong>on</strong>g>clud<str<strong>on</strong>g>in</str<strong>on</strong>g>g the populati<strong>on</strong><br />
fall<str<strong>on</strong>g>in</str<strong>on</strong>g>g below 50 percent <str<strong>on</strong>g>of</str<strong>on</strong>g> poverty (extreme poverty) and end<str<strong>on</strong>g>in</str<strong>on</strong>g>g with the populati<strong>on</strong> at<br />
150% <str<strong>on</strong>g>of</str<strong>on</strong>g> poverty. While reflect<str<strong>on</strong>g>in</str<strong>on</strong>g>g the same trends as were seen <str<strong>on</strong>g>in</str<strong>on</strong>g> Table 20, <strong>on</strong>e is able<br />
to see <str<strong>on</strong>g>in</str<strong>on</strong>g> more detail the degree <str<strong>on</strong>g>of</str<strong>on</strong>g> poverty that exists <str<strong>on</strong>g>in</str<strong>on</strong>g> Regi<strong>on</strong> 1-A. Of particular note<br />
are Sectors 3, 4 and 11 where well over 1/3 <str<strong>on</strong>g>of</str<strong>on</strong>g> all seniors (almost half <str<strong>on</strong>g>in</str<strong>on</strong>g> Sector 4) fall<br />
below 150% <str<strong>on</strong>g>of</str<strong>on</strong>g> poverty.<br />
Table 22. Percent <str<strong>on</strong>g>of</str<strong>on</strong>g> the Populati<strong>on</strong> 60+ by Ratio to Poverty by Sector, 1999<br />
Sectors<br />
Total<br />
Pers<strong>on</strong>s<br />
Percent <str<strong>on</strong>g>of</str<strong>on</strong>g> Pers<strong>on</strong>s Less than _ % <str<strong>on</strong>g>of</str<strong>on</strong>g> Poverty<br />
50 75 100 125 150<br />
1 12,640 7.7 12.1 20.1 27.6 33.4<br />
2 8,179 5.7 9.8 16.1 21.6 27.3<br />
3 15,968 8.3 14.4 24.2 31.5 38.1<br />
4 11,969 8.7 17.6 29.8 39.6 45.7<br />
5 10,723 8.1 13.4 20.4 27.1 34.0<br />
6 16,083 8.2 13.2 20.6 27.3 33.5<br />
7 13,866 5.6 9.2 15.0 20.5 27.1<br />
8 8,852 5.6 8.5 14.7 19.9 24.4<br />
9 13,726 5.5 9.0 15.4 20.5 25.8<br />
10 12,720 3.6 6.1 10.1 14.5 18.0<br />
11 6,046 8.7 14.4 25.3 32.0 38.6<br />
12 12,781 1.3 2.3 3.4 4.6 6.4<br />
16