Demographic Profile of Seniors in PSA 1-A - Detroit Area Agency on ...
Demographic Profile of Seniors in PSA 1-A - Detroit Area Agency on ...
Demographic Profile of Seniors in PSA 1-A - Detroit Area Agency on ...

You also want an ePaper? Increase the reach of your titles
YUMPU automatically turns print PDFs into web optimized ePapers that Google loves.
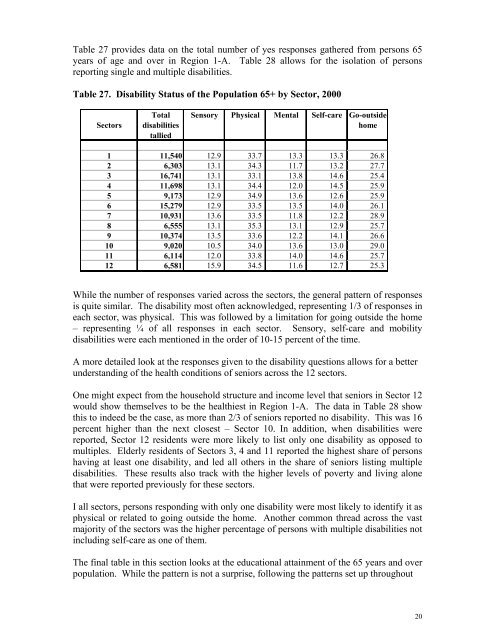
Table 27 provides data <strong>on</strong> the total number <str<strong>on</strong>g>of</str<strong>on</strong>g> yes resp<strong>on</strong>ses gathered from pers<strong>on</strong>s 65<br />
years <str<strong>on</strong>g>of</str<strong>on</strong>g> age and over <str<strong>on</strong>g>in</str<strong>on</strong>g> Regi<strong>on</strong> 1-A. Table 28 allows for the isolati<strong>on</strong> <str<strong>on</strong>g>of</str<strong>on</strong>g> pers<strong>on</strong>s<br />
report<str<strong>on</strong>g>in</str<strong>on</strong>g>g s<str<strong>on</strong>g>in</str<strong>on</strong>g>gle and multiple disabilities.<br />
Table 27. Disability Status <str<strong>on</strong>g>of</str<strong>on</strong>g> the Populati<strong>on</strong> 65+ by Sector, 2000<br />
Sectors<br />
Total<br />
disabilities<br />
tallied<br />
Sensory Physical Mental Self-care Go-outsidehome<br />
1 11,540 12.9 33.7 13.3 13.3 26.8<br />
2 6,303 13.1 34.3 11.7 13.2 27.7<br />
3 16,741 13.1 33.1 13.8 14.6 25.4<br />
4 11,698 13.1 34.4 12.0 14.5 25.9<br />
5 9,173 12.9 34.9 13.6 12.6 25.9<br />
6 15,279 12.9 33.5 13.5 14.0 26.1<br />
7 10,931 13.6 33.5 11.8 12.2 28.9<br />
8 6,555 13.1 35.3 13.1 12.9 25.7<br />
9 10,374 13.5 33.6 12.2 14.1 26.6<br />
10 9,020 10.5 34.0 13.6 13.0 29.0<br />
11 6,114 12.0 33.8 14.0 14.6 25.7<br />
12 6,581 15.9 34.5 11.6 12.7 25.3<br />
While the number <str<strong>on</strong>g>of</str<strong>on</strong>g> resp<strong>on</strong>ses varied across the sectors, the general pattern <str<strong>on</strong>g>of</str<strong>on</strong>g> resp<strong>on</strong>ses<br />
is quite similar. The disability most <str<strong>on</strong>g>of</str<strong>on</strong>g>ten acknowledged, represent<str<strong>on</strong>g>in</str<strong>on</strong>g>g 1/3 <str<strong>on</strong>g>of</str<strong>on</strong>g> resp<strong>on</strong>ses <str<strong>on</strong>g>in</str<strong>on</strong>g><br />
each sector, was physical. This was followed by a limitati<strong>on</strong> for go<str<strong>on</strong>g>in</str<strong>on</strong>g>g outside the home<br />
– represent<str<strong>on</strong>g>in</str<strong>on</strong>g>g ¼ <str<strong>on</strong>g>of</str<strong>on</strong>g> all resp<strong>on</strong>ses <str<strong>on</strong>g>in</str<strong>on</strong>g> each sector. Sensory, self-care and mobility<br />
disabilities were each menti<strong>on</strong>ed <str<strong>on</strong>g>in</str<strong>on</strong>g> the order <str<strong>on</strong>g>of</str<strong>on</strong>g> 10-15 percent <str<strong>on</strong>g>of</str<strong>on</strong>g> the time.<br />
A more detailed look at the resp<strong>on</strong>ses given to the disability questi<strong>on</strong>s allows for a better<br />
understand<str<strong>on</strong>g>in</str<strong>on</strong>g>g <str<strong>on</strong>g>of</str<strong>on</strong>g> the health c<strong>on</strong>diti<strong>on</strong>s <str<strong>on</strong>g>of</str<strong>on</strong>g> seniors across the 12 sectors.<br />
One might expect from the household structure and <str<strong>on</strong>g>in</str<strong>on</strong>g>come level that seniors <str<strong>on</strong>g>in</str<strong>on</strong>g> Sector 12<br />
would show themselves to be the healthiest <str<strong>on</strong>g>in</str<strong>on</strong>g> Regi<strong>on</strong> 1-A. The data <str<strong>on</strong>g>in</str<strong>on</strong>g> Table 28 show<br />
this to <str<strong>on</strong>g>in</str<strong>on</strong>g>deed be the case, as more than 2/3 <str<strong>on</strong>g>of</str<strong>on</strong>g> seniors reported no disability. This was 16<br />
percent higher than the next closest – Sector 10. In additi<strong>on</strong>, when disabilities were<br />
reported, Sector 12 residents were more likely to list <strong>on</strong>ly <strong>on</strong>e disability as opposed to<br />
multiples. Elderly residents <str<strong>on</strong>g>of</str<strong>on</strong>g> Sectors 3, 4 and 11 reported the highest share <str<strong>on</strong>g>of</str<strong>on</strong>g> pers<strong>on</strong>s<br />
hav<str<strong>on</strong>g>in</str<strong>on</strong>g>g at least <strong>on</strong>e disability, and led all others <str<strong>on</strong>g>in</str<strong>on</strong>g> the share <str<strong>on</strong>g>of</str<strong>on</strong>g> seniors list<str<strong>on</strong>g>in</str<strong>on</strong>g>g multiple<br />
disabilities. These results also track with the higher levels <str<strong>on</strong>g>of</str<strong>on</strong>g> poverty and liv<str<strong>on</strong>g>in</str<strong>on</strong>g>g al<strong>on</strong>e<br />
that were reported previously for these sectors.<br />
I all sectors, pers<strong>on</strong>s resp<strong>on</strong>d<str<strong>on</strong>g>in</str<strong>on</strong>g>g with <strong>on</strong>ly <strong>on</strong>e disability were most likely to identify it as<br />
physical or related to go<str<strong>on</strong>g>in</str<strong>on</strong>g>g outside the home. Another comm<strong>on</strong> thread across the vast<br />
majority <str<strong>on</strong>g>of</str<strong>on</strong>g> the sectors was the higher percentage <str<strong>on</strong>g>of</str<strong>on</strong>g> pers<strong>on</strong>s with multiple disabilities not<br />
<str<strong>on</strong>g>in</str<strong>on</strong>g>clud<str<strong>on</strong>g>in</str<strong>on</strong>g>g self-care as <strong>on</strong>e <str<strong>on</strong>g>of</str<strong>on</strong>g> them.<br />
The f<str<strong>on</strong>g>in</str<strong>on</strong>g>al table <str<strong>on</strong>g>in</str<strong>on</strong>g> this secti<strong>on</strong> looks at the educati<strong>on</strong>al atta<str<strong>on</strong>g>in</str<strong>on</strong>g>ment <str<strong>on</strong>g>of</str<strong>on</strong>g> the 65 years and over<br />
populati<strong>on</strong>. While the pattern is not a surprise, follow<str<strong>on</strong>g>in</str<strong>on</strong>g>g the patterns set up throughout<br />
20