Light Truck Frame Joint Stiffness Study Phase 1 Final Report
Light Truck Frame Joint Stiffness Study Phase 1 Final Report
Light Truck Frame Joint Stiffness Study Phase 1 Final Report

You also want an ePaper? Increase the reach of your titles
YUMPU automatically turns print PDFs into web optimized ePapers that Google loves.
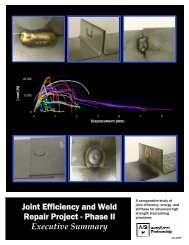
SENSITIVITY STUDY<br />
The influence of the joint parameter on the stiffness of each load case is shown in Figures 16 through 30.<br />
For each plot, the Y-axis shows the relative stiffness. The X-axis, for each component listed, shows how<br />
the stiffness varied over the range of values allowed for each component. For example, the point furthest<br />
left of a parameter’s plotted line would be the minimal allowed value for that parameter, and the point<br />
furthest right of the line would be the stiffness at the upper value for the specified parameter. (i.e. For the<br />
crossmember thickness in Figure 16, the stiffness is 2.5 when the crossmember thickness is lowest at<br />
2mm and the stiffness of the joint is 4.8 when the crossmember thickness is 4mm).<br />
Large<br />
influence on<br />
stiffness<br />
Minimal<br />
influence<br />
on<br />
stiffness<br />
Crossmember<br />
Thickness<br />
Side Rail<br />
Thickness<br />
Crossmember<br />
Tube Diameter<br />
Side Rail<br />
Height<br />
Side Rail Width<br />
Figure 16: Main Effect Plot for <strong>Joint</strong> 1: Tube-Through-Tube Vertical Bending <strong>Stiffness</strong> K θx<br />
Crossmember<br />
Thickness<br />
Side Rail<br />
Thickness<br />
Crossmember<br />
Tube Diameter<br />
Side Rail<br />
Height<br />
Side Rail Width<br />
Figure 17: Main Effect Plot for <strong>Joint</strong> 1: Tube-Through-Tube Bending <strong>Stiffness</strong> K θy<br />
<strong>Report</strong>: A/SP-005-1 <strong>Light</strong> <strong>Truck</strong> <strong>Frame</strong> <strong>Joint</strong> <strong>Stiffness</strong> <strong>Study</strong> 50