Results presentation - MTN Group
Results presentation - MTN Group
Results presentation - MTN Group

Create successful ePaper yourself
Turn your PDF publications into a flip-book with our unique Google optimized e-Paper software.
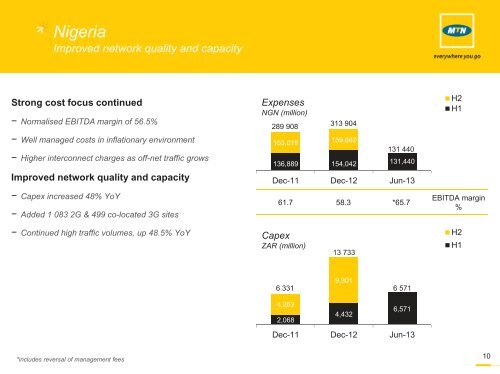
Nigeria<br />
Improved network quality and capacity<br />
Strong cost focus continued<br />
− Normalised EBITDA margin of 56.5%<br />
− Well managed costs in inflationary environment<br />
− Higher interconnect charges as off-net traffic grows<br />
Improved network quality and capacity<br />
− Capex increased 48% YoY<br />
− Added 1 083 2G & 499 co-located 3G sites<br />
Expenses<br />
NGN (million)<br />
289 908<br />
313 904<br />
153,019 159,862<br />
131 440<br />
136,889 154,042 131,440<br />
Dec-11 Dec-12 Jun-13<br />
61.7 58.3 *65.7<br />
H2<br />
H1<br />
EBITDA margin<br />
%<br />
− Continued high traffic volumes, up 48.5% YoY<br />
Capex<br />
ZAR (million)<br />
13 733<br />
H2<br />
H1<br />
6 331<br />
4,263<br />
2,068<br />
9,301<br />
4,432<br />
6 571<br />
6,571<br />
Dec-11 Dec-12 Jun-13<br />
*includes reversal of management fees<br />
10