Results presentation - MTN Group
Results presentation - MTN Group
Results presentation - MTN Group

You also want an ePaper? Increase the reach of your titles
YUMPU automatically turns print PDFs into web optimized ePapers that Google loves.
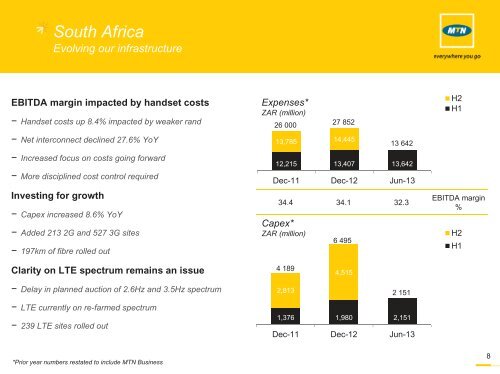
South Africa<br />
Evolving our infrastructure<br />
EBITDA margin impacted by handset costs<br />
− Handset costs up 8.4% impacted by weaker rand<br />
− Net interconnect declined 27.6% YoY<br />
− Increased focus on costs going forward<br />
− More disciplined cost control required<br />
Investing for growth<br />
− Capex increased 8.6% YoY<br />
− Added 213 2G and 527 3G sites<br />
− 197km of fibre rolled out<br />
Expenses*<br />
ZAR (million)<br />
26 000<br />
13,785 14,445<br />
12,215 13,407 13,642<br />
Dec-11 Dec-12 Jun-13<br />
34.4 34.1 32.3<br />
Capex*<br />
ZAR (million)<br />
27 852<br />
6 495<br />
13 642<br />
H2<br />
H1<br />
EBITDA margin<br />
%<br />
H2<br />
H1<br />
Clarity on LTE spectrum remains an issue<br />
4 189<br />
4,515<br />
− Delay in planned auction of 2.6Hz and 3.5Hz spectrum<br />
2,813<br />
2 151<br />
− LTE currently on re-farmed spectrum<br />
− 239 LTE sites rolled out<br />
1,376 1,980 2,151<br />
Dec-11 Dec-12 Jun-13<br />
*Prior year numbers restated to include <strong>MTN</strong> Business<br />
8