General Plan Update - City of Inglewood
General Plan Update - City of Inglewood
General Plan Update - City of Inglewood

You also want an ePaper? Increase the reach of your titles
YUMPU automatically turns print PDFs into web optimized ePapers that Google loves.
<strong>City</strong> <strong>of</strong><br />
August 2006<br />
<strong>General</strong> <strong>Plan</strong> <strong>Update</strong><br />
Technical Background Report
CITY OF INGLEWOOD<br />
GENERAL PLAN UPDATE<br />
Final Technical Background Report<br />
Prepared for<br />
<strong>City</strong> <strong>of</strong> <strong>Inglewood</strong><br />
P.O. Box 6500<br />
<strong>Inglewood</strong>, California 90312<br />
Prepared by<br />
EIP Associates<br />
12301 Wilshire Boulevard, Suite 430<br />
Los Angeles, California 90025<br />
In association with<br />
Meyer, Mohaddes Associates, Inc.<br />
707 Wilshire Boulevard, Suite 4810<br />
Los Angeles, CA 90017<br />
Stanley R. H<strong>of</strong>fman Associates<br />
11661 San Vicente Boulevard, Suite 306<br />
Los Angeles, CA 90049<br />
and<br />
Terry A. Hayes Associates LLC<br />
8522 National Boulevard, Suite 102<br />
Culver <strong>City</strong>, CA 90232<br />
August 2006
Contents<br />
CHAPTER 1 Introduction .................................................................................... 1-1<br />
1.1 Background........................................................................................... 1-1<br />
1.2 <strong>General</strong> <strong>Plan</strong>......................................................................................... 1-1<br />
1.3 Technical Background Report........................................................... 1-2<br />
1.4 Regional Setting ................................................................................... 1-3<br />
1.5 <strong>General</strong> <strong>Plan</strong> <strong>Plan</strong>ning Area............................................................... 1-3<br />
CHAPTER 2<br />
CHAPTER 3<br />
Community Development.............................................................2.1-1<br />
2.1 Land Use............................................................................................ 2.1-1<br />
2.2 Housing.............................................................................................. 2.2-1<br />
2.3 Economic Trends and Conditions................................................. 2.3-1<br />
Infrastructure.................................................................................3.1-1<br />
3.1 Water System..................................................................................... 3.1-1<br />
3.2 Sewer and Wastewater ..................................................................... 3.2-1<br />
3.3 Storm Drains ..................................................................................... 3.3-1<br />
3.4 Solid Waste ........................................................................................ 3.4-1<br />
3.5 Electricity ........................................................................................... 3.5-1<br />
3.6 Natural Gas........................................................................................ 3.6-1<br />
3.7 Telecommunications ........................................................................ 3.7-1<br />
3.8 Circulation.......................................................................................... 3.8-1<br />
CHAPTER 4 Community Services .....................................................................4.1-1<br />
4.1 Schools ............................................................................................... 4.1-1<br />
4.2 Recreation and Parks........................................................................ 4.2-1<br />
4.3 Library Services................................................................................. 4.3-1<br />
CHAPTER 5<br />
CHAPTER 6<br />
Environmental Resources.............................................................5.1-1<br />
5.1 Biological Resources......................................................................... 5.1-1<br />
5.2 Hydrology and Water Quality......................................................... 5.2-1<br />
5.3 Topography and Hillsides ............................................................... 5.3-1<br />
5.4 Visual Resources............................................................................... 5.4-1<br />
5.5 Historical and Cultural Resources.................................................. 5.5-1<br />
5.6 Air Quality ......................................................................................... 5.6-1<br />
Community Safety and Hazards...................................................6.1-1<br />
6.1 Geology, Soils, and Mineral Resources ......................................... 6.1-1<br />
6.2 Seismic Hazards................................................................................ 6.2-1<br />
6.3 Flood Hazards................................................................................... 6.3-1<br />
<strong>City</strong> <strong>of</strong> <strong>Inglewood</strong> <strong>General</strong> <strong>Plan</strong> <strong>Update</strong> Technical Background Report<br />
iii
Contents<br />
6.4 Fire Hazards ......................................................................................6.4-1<br />
6.5 Hazardous Materials.........................................................................6.5-1<br />
6.6 Police Services...................................................................................6.6-1<br />
6.7 Fire Services.......................................................................................6.7-1<br />
6.8 Emergency Preparedness.................................................................6.8-1<br />
6.9 Noise...................................................................................................6.9-1<br />
CHAPTER 7 Synthesis <strong>of</strong> <strong>Plan</strong>ning Issues........................................................... 7-1<br />
• Appendices<br />
Appendix A <strong>City</strong> <strong>of</strong> <strong>Inglewood</strong> <strong>General</strong> <strong>Plan</strong> <strong>Update</strong> Economic Conditions<br />
and Trends Report<br />
Appendix B Sensitive Species Potentially Occurring within the <strong>City</strong> <strong>of</strong><br />
<strong>Inglewood</strong><br />
Appendix C Facilities on LUFT List for the <strong>City</strong> <strong>of</strong> <strong>Inglewood</strong><br />
• Figures<br />
Figure 1-1 Southern California Regional Map................................................................ 1-5<br />
Figure 1-2 <strong>Plan</strong>ning Area ................................................................................................... 1-7<br />
Figure 2.1-1 Existing Land Use.........................................................................................2.1-3<br />
Figure 2.1-2 <strong>General</strong> <strong>Plan</strong> Land Use ..............................................................................2.1-21<br />
Figure 2.1-3 Specific <strong>Plan</strong> Projects in <strong>Inglewood</strong>.........................................................2.1-25<br />
Figure 2.1-4 Redevelopment Project Areas...................................................................2.1-27<br />
Figure 2.1-5 Existing Zoning...........................................................................................2.1-31<br />
Figure 2.2-1 Age <strong>of</strong> Housing Stock: <strong>Inglewood</strong> and Los Angeles County, 2000......2.2-3<br />
Figure 2.3-1 Population Trends: 1970-2005....................................................................2.3-3<br />
Figure 2.3-2 Race and Ethnicity: 2000 .............................................................................2.3-7<br />
Figure 2.3-3 Age Distributions in <strong>Inglewood</strong> and Los Angeles County.....................2.3-8<br />
Figure 2.3-4 AA Degree and Above in <strong>City</strong> <strong>of</strong> <strong>Inglewood</strong>, South Bay Cities,<br />
and L.A County: 2000 ................................................................................2.3-10<br />
Figure 2.3-5 Comparative Unemployment Rates: 2004 ..............................................2.3-12<br />
Figure 2.3-6 Average Annual Household Income: 1990–2000 (in constant 2006<br />
dollars) ..........................................................................................................2.3-14<br />
Figure 2.3-7 Projected Population and Employment Growth: Percent Change<br />
2000 to 2030 1 ...............................................................................................2.3-16<br />
Figure 2.3-8 <strong>City</strong> <strong>of</strong> <strong>Inglewood</strong> Comparative Employment Distribution by<br />
Sector: 1994 to 2004...................................................................................2.3-18<br />
Figure 2.3-9 <strong>City</strong> <strong>of</strong> <strong>Inglewood</strong> Service Sector Categories as Percent <strong>of</strong> Service<br />
Sector Employment: 2004 .........................................................................2.3-20<br />
Figure 2.3-10 <strong>City</strong> <strong>of</strong> <strong>Inglewood</strong> Average Annual Salary in 8 Largest<br />
Employment Sectors: 2004 (Constant 2005 Dollars)............................2.3-22<br />
Figure 2.3-11 <strong>City</strong> <strong>of</strong> <strong>Inglewood</strong> Average Annual Salary in Service Sector<br />
Industries: 2004 (Constant 2005 Dollars) ...............................................2.3-23<br />
iv<br />
<strong>City</strong> <strong>of</strong> <strong>Inglewood</strong> <strong>General</strong> <strong>Plan</strong> <strong>Update</strong> Technical Background Report
Contents<br />
Figure 2.3-12 <strong>City</strong> <strong>of</strong> <strong>Inglewood</strong> Distribution <strong>of</strong> Establishments by Sectors:<br />
2004 ..............................................................................................................2.3-25<br />
Figure 2.3-13 <strong>City</strong> <strong>of</strong> <strong>Inglewood</strong> Sectoral Concentration <strong>of</strong> Establishments by<br />
ZIP Codes: 2003.........................................................................................2.3-27<br />
Figure 2.3-14 <strong>City</strong> <strong>of</strong> <strong>Inglewood</strong> Taxable Sales Trends: 1994 to 2004 (in ’000s<br />
Constant 2005 Dollars)..............................................................................2.3-30<br />
Figure 2.3-15 <strong>City</strong> <strong>of</strong> <strong>Inglewood</strong> and South Bay Cities Per Capita Taxable Retail<br />
Sales: 2004 (in Constant 2005 Dollars)....................................................2.3-32<br />
Figure 2.3-16 <strong>City</strong> <strong>of</strong> <strong>Inglewood</strong> Non-Residential Building Activity: 1994-2004<br />
(in thousands <strong>of</strong> constant 2006 dollars) ..................................................2.3-37<br />
Figure 2.3-17 <strong>City</strong> <strong>of</strong> <strong>Inglewood</strong> Residential Building Activity: 1995 to 2005...........2.3-39<br />
Figure 2.3-18 Comparative Median Contract Rent: 2000 and 2006 1 ...........................2.3-42<br />
Figure 3.1-1 Water Service Areas...................................................................................... 3.1-3<br />
Figure 3.2-1 Sewer Index ................................................................................................... 3.2-3<br />
Figure 3.3-1 Storm Drain Index ....................................................................................... 3.3-3<br />
Figure 3.8-1 Arterial Street Lanes..................................................................................... 3.8-5<br />
Figure 3.8-2 Metro Bus Routes within the <strong>City</strong> <strong>of</strong> <strong>Inglewood</strong>...................................3.8-11<br />
Figure 3.8-3 I-Line Shuttle Trolley.................................................................................3.8-13<br />
Figure 3.8-4 <strong>City</strong> <strong>of</strong> <strong>Inglewood</strong> Proposed Bicycle Routes..........................................3.8-17<br />
Figure 3.8-5 <strong>City</strong> <strong>of</strong> <strong>Inglewood</strong> Designated Truck Routes.........................................3.8-21<br />
Figure 4.1-1 School Locations .......................................................................................... 4.1-5<br />
Figure 4.2-1 Parks and Recreation Centers..................................................................... 4.2-3<br />
Figure 4.3-1 Library Locations.......................................................................................... 4.3-3<br />
Figure 5.1-1 Biological Resources..................................................................................... 5.1-5<br />
Figure 5.2-1 Watersheds..................................................................................................... 5.2-3<br />
Figure 5.3-1 Topography/Slope Analysis........................................................................ 5.3-3<br />
Figure 5.5-1 Historic Resources........................................................................................ 5.5-3<br />
Figure 5.6-1 Wind Rose ..................................................................................................... 5.6-3<br />
Figure 6.2-1 Geology and Fault Lines.............................................................................. 6.2-3<br />
Figure 6.5-1 Location <strong>of</strong> LUFT Sites............................................................................... 6.5-5<br />
Figure 6.6-1 Police Services............................................................................................... 6.6-3<br />
Figure 6.7-1 Fire Stations................................................................................................... 6.7-3<br />
Figure 6.9-1 Noise Monitoring Locations....................................................................... 6.9-5<br />
Figure 6.9-2 Existing Roadway Noise Contours..........................................................6.9-11<br />
Figure 6.9-3 Existing LAX Noise Contours .................................................................6.9-15<br />
• Tables<br />
Table 1-1 Elements <strong>of</strong> the <strong>General</strong> <strong>Plan</strong>........................................................................ 1-2<br />
Table 2.1-1 Existing Land Uses....................................................................................... 2.1-2<br />
Table 2.1-2 <strong>General</strong> <strong>Plan</strong> Land Use Designations......................................................2.1-20<br />
Table 2.1-3 Zoning Designations..................................................................................2.1-33<br />
Table 2.2-1 Housing Unit Growth, 1990, 2000, (2005 Estimates)............................. 2.2-1<br />
Table 2.2-2 <strong>Inglewood</strong> Housing Estimates, 2005......................................................... 2.2-2<br />
<strong>City</strong> <strong>of</strong> <strong>Inglewood</strong> <strong>General</strong> <strong>Plan</strong> <strong>Update</strong> Technical Background Report<br />
v
Contents<br />
Table 2.2-3 Housing Tenure, 1990–2000.......................................................................2.2-2<br />
Table 2.2-4 <strong>Inglewood</strong> Home Resale Activity, by Zip Code, 2005............................2.2-4<br />
Table 2.2-5 <strong>Inglewood</strong> Home Sale Activity, 2004/05..................................................2.2-4<br />
Table 2.2-6 Apartment Rental Rates...............................................................................2.2-5<br />
Table 2.2-7 Housing Affordability ..................................................................................2.2-6<br />
Table 2.2-8 Housing Problems by Tenure and Income...............................................2.2-7<br />
Table 2.2-9 Overcrowding................................................................................................2.2-8<br />
Table 2.2-30 RHNA Construction Need and Income Distribution, 1998-2005........2.2-9<br />
Table 2.2-41 Quantified Objectives ................................................................................2.2-10<br />
Table 2.2-52 Assisted Housing Developments, <strong>City</strong> <strong>of</strong> <strong>Inglewood</strong> ...........................2.2-13<br />
Table 2.3-1 Population Trends: 1990–2000 and 2000–2005.......................................2.3-4<br />
Table 2.3-2 Demographic Pr<strong>of</strong>ile <strong>of</strong> Market Area: 2000 & 2005 ...............................2.3-5<br />
Table 2.3-3 Population by Race and Ethnicity: 2000 ...................................................2.3-6<br />
Table 2.3-4 Age Distribution: 1990 and 2000 ...............................................................2.3-6<br />
Table 2.3-5 Educational Attainment <strong>of</strong> Population 25 Years and Older: 2000........2.3-9<br />
Table 2.3-6 Labor Force: 2000.......................................................................................2.3-11<br />
Table 2.3-7 Comparative Unemployment Rates: 1994 and 2004 .............................2.3-12<br />
Table 2.3-8 Distribution <strong>of</strong> Income: 1990–2000 (in nominal dollars).....................2.3-13<br />
Table 2.3-9 Average Household Income .....................................................................2.3-14<br />
Table 2.3-10 Population, Households and Employment Projections: 2000 to<br />
2030 a ..............................................................................................................2.3-15<br />
Table 2.3-11 <strong>City</strong> <strong>of</strong> <strong>Inglewood</strong> Employment by Sector: 1994 to 2004 a ...................2.3-18<br />
Table 2.3-12 <strong>City</strong> <strong>of</strong> <strong>Inglewood</strong> Employment by Sector: 2001 to 2004 a ...................2.3-19<br />
Table 2.3-13 Number <strong>of</strong> Establishments, Employment, and Wages: 2001–2004 ...2.3-21<br />
Table 2.3-14 <strong>City</strong> <strong>of</strong> <strong>Inglewood</strong> Distribution <strong>of</strong> Establishments by Sectors:<br />
2001 to 2004 ................................................................................................2.3-24<br />
Table 2.3-15 <strong>City</strong> <strong>of</strong> <strong>Inglewood</strong> Distribution <strong>of</strong> Firms by ZIP Codes: 2003............2.3-26<br />
Table 2.3-16 <strong>City</strong> <strong>of</strong> <strong>Inglewood</strong> Locational Index <strong>of</strong> Sectors by ZIP Codes:<br />
2003...............................................................................................................2.3-27<br />
Table 2.3-17 <strong>City</strong> <strong>of</strong> <strong>Inglewood</strong> and Los Angeles County Comparative Sectoral<br />
Specialization by Employment Distribution: 2004................................2.3-28<br />
Table 2.3-18 <strong>City</strong> <strong>of</strong> <strong>Inglewood</strong> Taxable Sales Trends: 1994 to 2004........................2.3-29<br />
Table 2.3-19 <strong>City</strong> <strong>of</strong> <strong>Inglewood</strong> Taxable Sales by Retail Category: 1994 and<br />
2004...............................................................................................................2.3-31<br />
Table 2.3-20 South Bay Cities Taxable Retail Sales Trends: 1994 to 2004<br />
(Constant 2005 Dollars).............................................................................2.3-33<br />
Table 2.3-21 <strong>City</strong> <strong>of</strong> <strong>Inglewood</strong> and County <strong>of</strong> Los Angeles Comparative Per<br />
Capita Taxable Sales: 2004 (Constant 2005 Dollars).............................2.3-34<br />
Table 2.3-22 <strong>City</strong> <strong>of</strong> <strong>Inglewood</strong> Retail Market Inventory, 2006 .................................2.3-35<br />
Table 2.3-23 <strong>City</strong> <strong>of</strong> <strong>Inglewood</strong> Retail Market Lease and Vacancy Rates: 2006 ......2.3-36<br />
Table 2.3-24 <strong>City</strong> <strong>of</strong> <strong>Inglewood</strong> Non-Residential Building Permit Valuations:<br />
1994–2004 (in thousands <strong>of</strong> constant 2006 dollars)..............................2.3-37<br />
Table 2.3-25 <strong>Inglewood</strong> New Residential Building Activity: 1994 to 2004 (in<br />
thousands <strong>of</strong> constant 2006 dollars) ........................................................2.3-38<br />
vi<br />
<strong>City</strong> <strong>of</strong> <strong>Inglewood</strong> <strong>General</strong> <strong>Plan</strong> <strong>Update</strong> Technical Background Report
Contents<br />
Table 2.3-26 <strong>City</strong> <strong>of</strong> <strong>Inglewood</strong>, South Bay Cities, and Los Angeles County<br />
Single-Family Median Sales Price: February 2006..................................2.3-40<br />
Table 2.3-27 <strong>City</strong> <strong>of</strong> <strong>Inglewood</strong>, South Bay Cities, and Los Angeles County<br />
Median Value for Condominiums: February 2006................................2.3-41<br />
Table 2.3-28 <strong>City</strong> <strong>of</strong> <strong>Inglewood</strong> and South Bay Cities Transient Occupancy Tax<br />
Revenues: 2002–2003.................................................................................2.3-44<br />
Table 3.1-1 Current and projected Water Supplies (AF/YR)..................................... 3.1-8<br />
Table 3.1-2 Recycled Water Use...................................................................................... 3.1-9<br />
Table 3.4-1 Transfer Stations........................................................................................... 3.4-2<br />
Table 3.4-2 Overall Residential Waste Stream by Material Type................................ 3.4-4<br />
Table 3.4-3 Overall Commercial Waste Stream By Material Type............................. 3.4-5<br />
Table 3.4-4 Diversion Rate, <strong>City</strong> <strong>of</strong> <strong>Inglewood</strong> ............................................................ 3.4-6<br />
Table 3.8-1 Average Daily Traffic Volume, Lane Configuration and Daily<br />
Level <strong>of</strong> Service for Major Roadways Located in the <strong>City</strong> <strong>of</strong><br />
<strong>Inglewood</strong> ...................................................................................................... 3.8-7<br />
Table 4.1-1 Public Schools Operated by the <strong>Inglewood</strong> Unified School<br />
District............................................................................................................ 4.1-2<br />
Table 4.1-2 Private Schools within <strong>Inglewood</strong>.............................................................. 4.1-4<br />
Table 4.1-3 <strong>Inglewood</strong> Unified School District Alternative Enrollment<br />
Projections Based on Adjusted Matriculation October 2005<br />
(CBEDs) K–12 Enrollments within District Boundaries.....................4.1-11<br />
Table 4.2-1 Parks ............................................................................................................... 4.2-5<br />
Table 5.3-1 Percent <strong>of</strong> <strong>City</strong> Land within Specified Slope Gradients ......................... 5.3-1<br />
Table 5.6-1 Summary <strong>of</strong> Ambient Air Quality Data .................................................... 5.6-9<br />
Table 5.6-2 2004 Estimated Annual Emissions Summary for Los Angeles<br />
County (tons/day) ......................................................................................5.6-10<br />
Table 5.6-3 Existing Carbon Monoxide Concentrations...........................................5.6-12<br />
Table 5.6-4 AQMP Control Strategies for Local Governments...............................5.6-18<br />
Table 6.2-1 Relationship between Greatest Measure Intensity and Magnitude ....... 6.2-5<br />
Table 6.5-1 Facilities on SLIC List for the <strong>City</strong> <strong>of</strong> <strong>Inglewood</strong> ................................... 6.5-4<br />
Table 6.6-1 <strong>Inglewood</strong> Police Department, Staffing Levels, 2006............................. 6.6-2<br />
Table 6.6-2 <strong>City</strong> <strong>of</strong> <strong>Inglewood</strong>, Crime Summary, 1999–2005..................................... 6.6-7<br />
Table 6.7-1 <strong>Inglewood</strong> Fire Stations............................................................................... 6.7-2<br />
Table 6.9-1 Representative Environmental Noise Levels ........................................... 6.9-2<br />
Table 6.9-2 Existing Daytime Noise Levels at Selected Locations a .......................... 6.9-7<br />
Table 6.9-3 Existing Roadway Noise Levels ................................................................. 6.9-8<br />
Table 6.9-4 Land Use/Noise Compatibility Guidelines ............................................6.9-17<br />
Table 6.9-5 Base Ambient Noise Levels ......................................................................6.9-18<br />
Table 6.9-6 Maximum Residential Noise Levels.........................................................6.9-19<br />
<strong>City</strong> <strong>of</strong> <strong>Inglewood</strong> <strong>General</strong> <strong>Plan</strong> <strong>Update</strong> Technical Background Report<br />
vii
CHAPTER 1<br />
Introduction<br />
1.1 BACKGROUND<br />
The current <strong>General</strong> <strong>Plan</strong> for the <strong>City</strong> <strong>of</strong> <strong>Inglewood</strong> contains seven elements, six <strong>of</strong><br />
which were adopted in the 1980s and 1990s and have not since been updated. Although<br />
the <strong>General</strong> <strong>Plan</strong> has not been comprehensively revised until now, there have been<br />
periodic amendments to the Land Use and Housing Elements. The Housing Element was<br />
certified by the State Department <strong>of</strong> Community Development in 2005 in response to the<br />
State Regional Housing Needs Assessment requirements. Much <strong>of</strong> the data, analyses, and<br />
policies in these elements do not reflect the existing conditions in the <strong>City</strong>. Thus, a<br />
comprehensive update <strong>of</strong> the <strong>General</strong> <strong>Plan</strong> is necessary to reflect current conditions as<br />
well as the community’s vision for development within <strong>Inglewood</strong> over the next 20 years.<br />
1.2 GENERAL PLAN<br />
A <strong>General</strong> <strong>Plan</strong> is a state-required legal document that provides guidance to decision<br />
makers regarding the allocation <strong>of</strong> resources, and determining the future physical form<br />
and character <strong>of</strong> development for cities. It is the <strong>of</strong>ficial statement <strong>of</strong> the jurisdiction<br />
regarding the extent and types <strong>of</strong> development needed to achieve the community’s<br />
physical, economic, social, and environmental goals. Although the <strong>General</strong> <strong>Plan</strong> consists<br />
<strong>of</strong> individual sections, or “elements,” that address a specific area <strong>of</strong> concern, it also<br />
embodies a comprehensive and integrated planning approach for the jurisdiction.<br />
The <strong>General</strong> <strong>Plan</strong> clarifies and articulates the <strong>City</strong>’s intentions with respect to the rights<br />
and expectations <strong>of</strong> the general public, property owners, special interest groups,<br />
prospective investors, and business interests. Through the <strong>General</strong> <strong>Plan</strong>, the <strong>City</strong> informs<br />
the community <strong>of</strong> its goals, policies, and development standards, thereby communicating<br />
the <strong>City</strong>’s expectations <strong>of</strong> the private sector in meeting the intentions <strong>of</strong> the <strong>General</strong> <strong>Plan</strong>.<br />
Under state law, each <strong>General</strong> <strong>Plan</strong> must contain seven elements:<br />
• Land Use<br />
• Circulation<br />
• Housing<br />
• Conservation<br />
• Open Space<br />
• Noise<br />
• Safety<br />
A list <strong>of</strong> current elements <strong>of</strong> the <strong>General</strong> <strong>Plan</strong> and when they were last revised is shown<br />
in the table below. It is anticipated that there may be a reorganization <strong>of</strong> the existing<br />
elements with the update <strong>of</strong> the <strong>General</strong> <strong>Plan</strong>; the specific elements proposed will be<br />
determined at a later date.<br />
<strong>City</strong> <strong>of</strong> <strong>Inglewood</strong> <strong>General</strong> <strong>Plan</strong> <strong>Update</strong> Technical Background Report<br />
1-1
Chapter 1 Introduction<br />
Table 1-1<br />
Elements <strong>of</strong> the <strong>General</strong> <strong>Plan</strong><br />
Required Elements<br />
Current Elements<br />
Land Use Land Use (1980)<br />
Housing Housing (certified by HCD in 2005)<br />
Open Space Open Space (1995)<br />
Conservation Conservation (1997)<br />
Circulation Circulation (1992)<br />
Safety Safety (1995)<br />
Noise Noise (1987)<br />
1.3 TECHNICAL BACKGROUND REPORT<br />
• Purpose<br />
The purpose <strong>of</strong> this document, the <strong>City</strong> <strong>of</strong> <strong>Inglewood</strong> <strong>General</strong> <strong>Plan</strong> Technical<br />
Background Report (TBR), is to serve as a comprehensive database that describes the<br />
<strong>City</strong>’s existing conditions for physical, social, and economic resources. This information<br />
includes discussion <strong>of</strong> the existing characteristics, trends and forecasts, and issues<br />
associated with each resource. The planning issues, which were identified based on<br />
existing conditions, will be presented as a separate document. The TBR is the foundation<br />
document from which subsequent planning policies and programs will be formulated. In<br />
addition, the TBR will serve as the “Environmental Setting” section for each technical<br />
environmental issue analyzed in the Environmental Impact Report, which will be<br />
completed as a component <strong>of</strong> the preparation <strong>of</strong> the <strong>General</strong> <strong>Plan</strong>.<br />
• Contents<br />
This document consists <strong>of</strong> six chapters, as described below.<br />
• Chapter 1—Introduction: This chapter outlines the purpose and contents <strong>of</strong> this<br />
document, as well as defines the <strong>City</strong>’s boundaries, and provides the regional<br />
setting.<br />
• Chapter 2—Community Development: Chapter 2 includes exhibits identifying <strong>General</strong><br />
<strong>Plan</strong> and zoning designations for the <strong>City</strong>. Existing land uses within the <strong>City</strong>, as<br />
well as existing specific and development plans, are also described. Lastly, it<br />
provides fiscal, population, demographic, and housing information.<br />
• Chapter 3—Infrastructure: This chapter provides information on existing<br />
infrastructure within the <strong>City</strong>. A section that describes the existing circulation<br />
system, as well as traffic volumes, capacities, and levels <strong>of</strong> service are included.<br />
Other infrastructure associated with water, wastewater, storm drain, solid waste,<br />
energy, and telecommunications are described. Specifically, existing utility<br />
providers, type and capacity <strong>of</strong> services, and location <strong>of</strong> infrastructure are<br />
discussed.<br />
• Chapter 4—Community Services: Information on community services that include<br />
schools, parks and recreation and library services are provided in this chapter.<br />
1-2<br />
<strong>City</strong> <strong>of</strong> <strong>Inglewood</strong> <strong>General</strong> <strong>Plan</strong> <strong>Update</strong> Technical Background Report
Chapter 1 Introduction<br />
Existing school enrollment, as well as locations <strong>of</strong> facilities and planned<br />
improvements, are discussed. Facilities within the community that provide parks<br />
and recreational facilities, and library services are described.<br />
• Chapter 5—Environmental Resources. Chapter 5 provides information on<br />
environmental resources present in the <strong>City</strong>. These include primarily plants and<br />
animals. Existing surface and ground water resources and their quality are<br />
described. Air quality, topography, and visual resources are also discussed in this<br />
chapter. Lastly, historic, archaeological, and paleontological resources are included.<br />
• Chapter 6—Community Safety and Hazards. This chapter provides background<br />
information on public safety issues affecting the area. Hazards associated with<br />
geology, seismic, flooding, hazardous materials and fire are discussed, as well as<br />
public safety services such as police, fire and emergency preparedness. Lastly,<br />
existing noise conditions are described.<br />
• Chapter 7—Synthesis <strong>of</strong> <strong>Plan</strong>ning Issues: This Chapter presents a matrix <strong>of</strong> the issues<br />
identified in the preceding chapters <strong>of</strong> this TBR. The issues presented in this<br />
Chapter, represent opportunities, constraints, challenges, or problems facing the<br />
<strong>City</strong> <strong>of</strong> <strong>Inglewood</strong> as related to each <strong>of</strong> the topical areas to be covered in the<br />
<strong>General</strong> <strong>Plan</strong> update.<br />
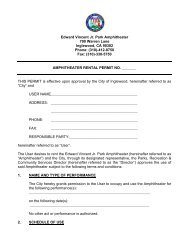
1.4 REGIONAL SETTING<br />
Located in the Southern California region, <strong>Inglewood</strong> is located within southwestern Los<br />
Angeles County, southwest <strong>of</strong> downtown Los Angeles along the northern edge <strong>of</strong> a<br />
subarea commonly referred to as the South Bay. The proximity <strong>of</strong> <strong>Inglewood</strong> to the<br />
historic center <strong>of</strong> Los Angeles makes it one <strong>of</strong> the older and most urbanized <strong>of</strong> all the<br />
South Bay communities. <strong>General</strong>ly, <strong>Inglewood</strong> is bordered by the <strong>City</strong> <strong>of</strong> Hawthorne and<br />
the unincorporated Los Angeles County community <strong>of</strong> Lennox to the south, the <strong>City</strong> <strong>of</strong><br />
Los Angeles to the east, the Los Angeles International Airport (LAX), the <strong>City</strong> <strong>of</strong> El<br />
Segundo and unincorporated portions <strong>of</strong> Los Angeles County to the west. To the north,<br />
<strong>Inglewood</strong> is bordered by the unincorporated Los Angeles County communities <strong>of</strong><br />
Ladera, Baldwin Hills, View Park and Windsor Hills as well as the <strong>City</strong> <strong>of</strong> Los Angeles.<br />
Regional access to the <strong>City</strong> is provided by several freeways. The Santa Monica (I-405)<br />
Freeway runs north to south, and bisects <strong>Inglewood</strong> near the community’s western<br />
border, while the Century (I-105) Freeway runs east to west near the <strong>City</strong>’s southern<br />
boundary. In addition, the State Route (SR) Harbor (110) Freeway transverses north to<br />
south, within close proximity to <strong>Inglewood</strong> on the east (Figure 1-1).<br />
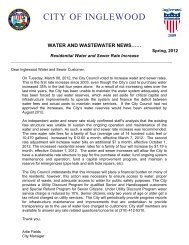
1.5 GENERAL PLAN PLANNING AREA<br />
For the update <strong>of</strong> the <strong>General</strong> <strong>Plan</strong> and preparation <strong>of</strong> the TBR, the <strong>Plan</strong>ning Area will<br />
comprise the <strong>City</strong> limits <strong>of</strong> <strong>Inglewood</strong>, approximately 8.9 square miles and the <strong>City</strong>’s<br />
sphere <strong>of</strong> influence (SOI) area. (Figure 1-2). As referred to in this TBR, a sphere <strong>of</strong><br />
influence is the probably ultimate physical boundary and service area <strong>of</strong> the <strong>City</strong> ,as<br />
determined by the Local Agency Formation Commission. The <strong>City</strong>’s SOI is located<br />
southwest <strong>of</strong> the city boundary located next to the unincorporated Los Angeles County<br />
community <strong>of</strong> Lennox. The total SOI area is approximately 334.7 acres.<br />
<strong>City</strong> <strong>of</strong> <strong>Inglewood</strong> <strong>General</strong> <strong>Plan</strong> <strong>Update</strong> Technical Background Report<br />
1-3
CITY <strong>of</strong> INGLEWOOD<br />
<strong>General</strong> <strong>Plan</strong><br />
REGIONAL MAP<br />
Legend<br />
<strong>City</strong> <strong>of</strong> <strong>Inglewood</strong> Boundary<br />
Regional Park<br />
Los Angeles International Airport<br />
<strong>City</strong> or Unincorporated Area<br />
Los Angeles County Boundary<br />
Source: <strong>City</strong> <strong>of</strong> <strong>Inglewood</strong>, February 2006.<br />
Date: April 26, 2006<br />
A Division <strong>of</strong><br />
Miles<br />
0 0.5 1 1.5 2<br />
Figure 1-1
CITY <strong>of</strong> INGLEWOOD<br />
<strong>General</strong> <strong>Plan</strong><br />
PLANNING AREA<br />
Legend<br />
Sphere <strong>of</strong> Influence<br />
<strong>Plan</strong>ning Area<br />
<strong>City</strong> <strong>of</strong> <strong>Inglewood</strong><br />
Water Body<br />
Metro Rail<br />
Railroad<br />
Source: <strong>City</strong> <strong>of</strong> <strong>Inglewood</strong>, February 2006.<br />
Date: April 26, 2006<br />
Miles<br />
A Division <strong>of</strong> 0 0.25 0.5<br />
Figure 1-2
CHAPTER 2<br />
Community Development<br />
This Chapter describes the existing and projected land uses, population and<br />
demographics, housing, and economic conditions and trends within the <strong>City</strong> <strong>of</strong><br />
<strong>Inglewood</strong>. This Chapter includes the following sections:<br />
• Land Use<br />
• Housing<br />
• Economic Conditions and Trends<br />
2.1 LAND USE<br />
This section presents information regarding existing and planned land uses in the <strong>City</strong> <strong>of</strong><br />
<strong>Inglewood</strong>, and compares the existing land use to the current <strong>General</strong> <strong>Plan</strong> Land Use<br />
Map and Zoning Map. Information is derived from a field survey <strong>of</strong> the <strong>City</strong>, GIS data<br />
provided by the <strong>City</strong>, and review <strong>of</strong> pertinent <strong>City</strong> documents including the adopted<br />
<strong>General</strong> <strong>Plan</strong> and Zoning Code. A full list <strong>of</strong> resources is found under References at the<br />
end <strong>of</strong> this section.<br />
• Existing Conditions<br />
Existing Land Uses<br />
The <strong>City</strong> <strong>of</strong> <strong>Inglewood</strong> contains approximately 8.9 gross square miles and over<br />
5,800 acres <strong>of</strong> land area. The following discussion pertains to the existing land uses in the<br />
<strong>City</strong>, as shown in Figure 2.1-1. The land use data in this figure is based on data obtained<br />
by the <strong>City</strong> from the Los Angeles County Assessor’s <strong>of</strong>fice. Existing land uses fall under<br />
five general categories as follows:<br />
• Residential—1. Residential uses within the <strong>City</strong> include primarily single- and multifamily<br />
development. Other residential uses include mobile homes, elderly homes,<br />
and boarding houses.<br />
• Commercial—Includes uses that <strong>of</strong>fer goods for retail sale to the public such as<br />
department stores, shopping centers, and supermarkets; and service uses such as<br />
restaurants, service stations, and beauty salons. Commercial land uses include<br />
businesses that serve local needs, such as restaurants, neighborhood markets and<br />
dry cleaners, and those that serve community or regional needs, such as auto<br />
dealers, furniture stores, hotels and motels.<br />
• Office—Includes pr<strong>of</strong>essional and administrative <strong>of</strong>fice uses.<br />
• Industrial—Includes low- and high-intensity industrial and manufacturing uses (e.g.<br />
industrial, heavy industrial, light manufacturing, storage, warehouse, etc.).<br />
• Public Facilities—Includes civic and governmental buildings and institutional uses<br />
such as <strong>City</strong> Hall, the Courthouse, police and fire stations, libraries, churches,<br />
schools, hospitals, etc.<br />
• Other—Includes land uses which do not fall into one <strong>of</strong> the specific categories listed<br />
above. As identified in Figure 2.1-1, these uses include utilities, right-<strong>of</strong>-ways,<br />
parking lots, greenhouses, etc.<br />
<strong>City</strong> <strong>of</strong> <strong>Inglewood</strong> <strong>General</strong> <strong>Plan</strong> <strong>Update</strong> Technical Background Report<br />
2.1-1
Chapter 2 Community Development<br />
Existing land uses in the <strong>City</strong> are listed below in Table 2.1-1, including their acreage and<br />
percentage <strong>of</strong> total <strong>City</strong> acres.<br />
Table 2.1-1<br />
Existing Land Uses<br />
Land Use Acres Percent <strong>of</strong> <strong>City</strong><br />
Residential<br />
Single-Family Detached 1 2,077.3 45.6%<br />
Duplex-Three Units 448.9 9.9%<br />
4+ Units 488.8 10.7%<br />
Mobile Home 7.8
CITY <strong>of</strong> INGLEWOOD<br />
<strong>General</strong> <strong>Plan</strong><br />
EXISTING LAND USE<br />
Source: <strong>City</strong> <strong>of</strong> <strong>Inglewood</strong>, February 2006.<br />
Date: May 15, 2006<br />
A Division <strong>of</strong><br />
Miles<br />
0 0.25<br />
0.5<br />
Figure 2.1-1
2.1 Land Use<br />
Duplex and Three-Unit Residential<br />
Land within <strong>Inglewood</strong> developed with duplexes and 3-units per lot totals 448.9 acres,<br />
accounting for 9.9 percent <strong>of</strong> the <strong>City</strong>’s total acreage, and 14.9 percent <strong>of</strong> all residential<br />
land uses. Neighborhoods consisting <strong>of</strong> duplexes and 3-unit lots are predominately<br />
located in the northeastern (Baldwin Hills vicinity) and southern portions <strong>of</strong> <strong>Inglewood</strong>,<br />
and are also scattered near the west-central portion <strong>of</strong> the <strong>City</strong> adjacent to the Santa<br />
Monica Freeway. The existing overall density for this residential category is approximately<br />
11.0 units per acre. These land uses serve as buffers or transition areas between the<br />
single-family areas and more intensive adjacent development.<br />
The general character <strong>of</strong> areas developed with duplexes or 3-unit lots differs depending<br />
on their location within the <strong>City</strong>. For example, within the northeastern and west-central<br />
areas <strong>of</strong> the community, more lots are developed with single-family dwellings than<br />
multiple-family dwellings. Consequently, these areas have sustained the qualities <strong>of</strong> a<br />
single-family neighborhood. These neighborhoods are relatively quiet, with older onestory<br />
homes interspersed with multi-family development, and adequate street parking.<br />
The areas south <strong>of</strong> Century Boulevard, however, are more densely developed, with a<br />
relatively higher proportion <strong>of</strong> multi-family development to single-family development,<br />
causing more congested street parking. Additionally, many homes in this area have bars<br />
on the windows, which indicate that safety is a concern within this area.<br />
Duplexes and Three-Unit Residential Areas<br />
West-Central area<br />
<strong>City</strong> <strong>of</strong> <strong>Inglewood</strong> <strong>General</strong> <strong>Plan</strong> <strong>Update</strong> Technical Background Report<br />
2.1-5
Chapter 2 Community Development<br />
Northeastern area (Baldwin Hills area)<br />
Southeastern area<br />
Four or more units<br />
The <strong>City</strong>’s land area developed with four or more units per lot totals 488.8 acres,<br />
accounting for 10.7 percent <strong>of</strong> the <strong>City</strong>’s total land area and 16.2 percent <strong>of</strong> all residential<br />
land uses. These areas are found primarily surrounding the downtown business district<br />
and Civic Center near the west-central area <strong>of</strong> the <strong>City</strong>, and also along major arterials.<br />
Their locations provide access to the regional freeway network and close proximity to<br />
major shopping facilities in the downtown business district.<br />
The existing overall density for this land use category is approximately 25 units per acre.<br />
This land use helps buffer the lower intensity residential uses from the main commercial<br />
corridors and Civic Center.<br />
The character <strong>of</strong> these neighborhoods generally consists <strong>of</strong> high-density apartment<br />
complexes interspersed with occasional single-family, duplex, and 3-unit developments.<br />
2.1-6<br />
<strong>City</strong> <strong>of</strong> <strong>Inglewood</strong> <strong>General</strong> <strong>Plan</strong> <strong>Update</strong> Technical Background Report
2.1 Land Use<br />
Residential Areas with Four or More Units<br />
Non-Residential Uses<br />
The following section presents the non-residential land uses in the <strong>City</strong>. These uses,<br />
which consist <strong>of</strong> commercial, <strong>of</strong>fice, industrial, public facilities, open space and<br />
recreation, and other non-categorized and undefined land uses, make up 33.6 percent <strong>of</strong><br />
the <strong>City</strong>’s total land area.<br />
Commercial<br />
The existing commercial uses in the <strong>City</strong> total approximately 296.9 acres, accounting for<br />
6.5 percent <strong>of</strong> the <strong>City</strong>’s total land area. Commercial uses, as shown in Table 2.1-1, are<br />
divided into two categories: Commercial and hotel/motel. Commercial uses encompass<br />
all <strong>of</strong> the general retail and service uses in the <strong>City</strong> such as department stores, shopping<br />
centers, restaurants, and service shops; and comprise 271.2 acres, or 6.0 percent <strong>of</strong> the<br />
<strong>City</strong>’s total land area. Hotels and motels comprise 25.7 acres, which is less than<br />
one percent <strong>of</strong> <strong>City</strong>’s total acreage.<br />
Commercial land uses are found primarily along the major arterials in the <strong>City</strong>. The major<br />
north-south commercial arterials include portions <strong>of</strong> La Cienega Boulevard, La Brea<br />
Avenue, and Prairie Avenue; and the east-west arterials include portions <strong>of</strong> Centinela<br />
Avenue, Manchester Boulevard, Arbor Vitae Street, Century Boulevard, and Imperial<br />
Highway. Many <strong>of</strong> these corridors form important gateways into the <strong>City</strong> at major<br />
freeway access points, providing opportunities for high visibility and accessibility into<br />
<strong>Inglewood</strong>. These gateways include entrances into the <strong>City</strong> from the west at Century and<br />
Manchester Boulevards adjacent to the San Diego (I-405) Freeway; and from the south at<br />
Prairie Avenue and Crenshaw Boulevard adjacent to the Century (I-105) Freeway.<br />
While the <strong>City</strong> has made great strides in revitalizing its commercial corridors, there is still<br />
much to be done toward their improvement. The large extent <strong>of</strong> businesses on the <strong>City</strong>’s<br />
commercial arterials competes with and hinders the success <strong>of</strong> a viable downtown. The<br />
over-saturation <strong>of</strong> commercial corridors results in many underutilized businesses that are<br />
non-viable resulting in pour maintenance and visual blight. Many <strong>of</strong> those businesses are<br />
<strong>City</strong> <strong>of</strong> <strong>Inglewood</strong> <strong>General</strong> <strong>Plan</strong> <strong>Update</strong> Technical Background Report<br />
2.1-7
Chapter 2 Community Development<br />
not well-maintained and do not provide adequate <strong>of</strong>f-street parking due to their age (legal<br />
non-conformity) and inadequate lot sizes. The shallow lots and multiple small businesses<br />
lead to frequent curb cuts along the heavy arterials, congested street parking, and<br />
potential conflicts for both cars and pedestrians. Following is a more detailed assessment<br />
<strong>of</strong> the physical condition <strong>of</strong> the commercial portions <strong>of</strong> the <strong>City</strong>’s major commercial<br />
corridors.<br />
La Cienega Boulevard<br />
La Cienega Boulevard, between Florence<br />
Avenue and Century Boulevard, is within<br />
the <strong>City</strong>’s La Cienega Redevelopment<br />
Project Area. This area is generally<br />
characterized by major air cargo uses,<br />
including trucking, warehousing, air cargo<br />
logistics, freight forwarders, customs<br />
brokers, and packing firms. At North La<br />
Cienega Boulevard, at the intersection<br />
with Centinela Avenue, there is some<br />
obsolete development, with two vacant<br />
properties at the northeast and southeast<br />
corners.<br />
La Brea Avenue<br />
The entire length <strong>of</strong> La Brea Avenue is part <strong>of</strong> the <strong>City</strong>’s In-Town Redevelopment<br />
Project Area. This corridor is generally characterized by one-to-two-story strip<br />
commercial development, interspersed with various other land uses including private<br />
schools, chapels, auto shops and dealerships. North <strong>of</strong> Spruce Avenue, La Brea Avenue<br />
parallels Market Street and contains more attractive façades similar to Market Street, as<br />
shown in the photographs below. South <strong>of</strong> Spruce Avenue, the corridor is largely<br />
characterized by multiple vacancies, street-fronting surface parking lots, auto bays<br />
oriented towards the street, poorly maintained building façades and streetscapes, few<br />
street trees with the exception <strong>of</strong> the center median, lack <strong>of</strong> pedestrian amenities, and an<br />
overabundance <strong>of</strong> signage. Even the center median with its nicely-groomed trees reveals<br />
signs <strong>of</strong> aging by the deteriorating ground turf.<br />
2.1-8<br />
<strong>City</strong> <strong>of</strong> <strong>Inglewood</strong> <strong>General</strong> <strong>Plan</strong> <strong>Update</strong> Technical Background Report
2.1 Land Use<br />
La Brea Avenue<br />
North <strong>of</strong> Spruce Avenue (downtown area)<br />
South <strong>of</strong> Spruce Avenue<br />
Downtown Market Street<br />
Market Street is also within the <strong>City</strong>’s In-Town Redevelopment Project Area. Market<br />
Street is an important component in the revitalization and redevelopment plans for<br />
downtown. It is the heart <strong>of</strong> <strong>Inglewood</strong>’s historic downtown shopping center, consisting<br />
primarily <strong>of</strong> retail uses with some <strong>of</strong>fice space and mixed-use retail-residential under<br />
construction north <strong>of</strong> Regent Street. This central business district is only three minutes<br />
away from regional entertainment and recreation facilities within <strong>Inglewood</strong> (Forum,<br />
Hollywood Park Racetrack and Casino), two miles from the LAX airport, and 12 miles<br />
from downtown Los Angeles.<br />
Currently the <strong>City</strong> is taking aggressive measures to revitalize the corridor, including<br />
investing $4.5 million in streetscape improvements including new landscaping, widened<br />
sidewalks, new street lighting, and wayfinding and branding signage. The Office <strong>of</strong><br />
Economic and Business Development and the Redevelopment Agency created the<br />
Market Street Task Force to develop implementation plans for the revitalization <strong>of</strong><br />
Market Street. The <strong>City</strong>’s Development Committee, the <strong>Plan</strong>ning Department, the Mayor,<br />
and the <strong>City</strong> Council will work together to develop a comprehensive Parking and<br />
Transportation plan as part <strong>of</strong> its <strong>General</strong> <strong>Plan</strong> update, to assist Market Street’s new and<br />
existing property owners to attract new retail and business tenants, and to introduce<br />
mixed-use housing developers to downtown.<br />
<strong>City</strong> <strong>of</strong> <strong>Inglewood</strong> <strong>General</strong> <strong>Plan</strong> <strong>Update</strong> Technical Background Report<br />
2.1-9
Chapter 2 Community Development<br />
Most recently, façade improvements have begun at the north 100 block <strong>of</strong> Market Street,<br />
including new paint, awnings, signage, lighting, glass and some molding detailing. The<br />
south end <strong>of</strong> Market Street has also recently been revitalized, including a new bus center<br />
and newly remodeled retail space. 1 Also at the south end the <strong>City</strong> envisions expanding its<br />
Civic Center presence. 2<br />
Market Street—Downtown<br />
Prairie Avenue<br />
Prairie Avenue is located within three Redevelopment Project Areas, including the<br />
Manchester-Prairie, Century, and Imperial-Prairie. From Century Boulevard to Imperial<br />
Highway, the corridor is heavily dominated by service and retail uses, including many<br />
auto services, which create incompatibilities with retail uses and residential development<br />
along the corridor. Large portions <strong>of</strong> this area are developed with residential uses; and<br />
many properties are abandoned, underutilized, or vacant. Significant land uses in this<br />
stretch include a vibrant and active Mexican Mercado on the west side <strong>of</strong> Prairie Avenue<br />
at Lennox Boulevard. Except for the activity occurring at the Mexican Mercado, however,<br />
there is moderate pedestrian activity within this area. Between Florence Avenue and<br />
Century Boulevard, land uses on the east side <strong>of</strong> Prairie Avenue consist <strong>of</strong> the <strong>Inglewood</strong><br />
Park Cemetery, The Forum, and the Hollywood Turf Club. On the west, land uses north<br />
<strong>of</strong> Manchester Boulevard are dominated by residential uses, and the Daniel Freeman<br />
Hospital and supporting services. South <strong>of</strong> Manchester Boulevard in this area, land uses<br />
are largely legal-nonconforming residential uses interspersed with commercial<br />
development.<br />
1 <strong>Inglewood</strong>, <strong>City</strong> <strong>of</strong>. Office <strong>of</strong> Economic & Business Development. Market Street. Website<br />
www.city<strong>of</strong>inglewood.org. <strong>Update</strong>d 7/24/03<br />
2 <strong>Inglewood</strong>, <strong>City</strong> <strong>of</strong>. 2005. <strong>City</strong> <strong>of</strong> <strong>Inglewood</strong> Champions <strong>of</strong> Smart Growth and Development. A Great<br />
Place to Live, Shop, & Work. Spring.<br />
2.1-10<br />
<strong>City</strong> <strong>of</strong> <strong>Inglewood</strong> <strong>General</strong> <strong>Plan</strong> <strong>Update</strong> Technical Background Report
2.1 Land Use<br />
Prairie Avenue<br />
Similar to Century Boulevard, the south entrance into the <strong>City</strong> on Prairie Avenue<br />
intersects with the Century (I-105) Freeway, which <strong>of</strong>fers opportunities for a prominent<br />
gateway into the <strong>City</strong> from the south. Additionally, the large percentage <strong>of</strong> vacant,<br />
underutilized, and abandoned parcels present opportunities for redevelopment and<br />
revitalization <strong>of</strong> this corridor.<br />
Centinela Avenue<br />
Centinela Avenue is not within a Redevelopment Project Area. This corridor is generally<br />
characterized by a mix <strong>of</strong> land uses, including multi- and single-family residential uses,<br />
chapels, mortuaries, auto uses, and other <strong>of</strong>fice and commercial land uses. The major<br />
defining features <strong>of</strong> Centinela Avenue are the major retail/commercial shopping nodes at<br />
its intersection with La Brea and Beach Avenues.<br />
Centinela Avenue<br />
<strong>City</strong> <strong>of</strong> <strong>Inglewood</strong> <strong>General</strong> <strong>Plan</strong> <strong>Update</strong> Technical Background Report<br />
2.1-11
Chapter 2 Community Development<br />
Manchester Boulevard<br />
Manchester Boulevard is located within several Redevelopment Project Areas, including<br />
La Cienega, In-Town, Manchester-Prairie, and Century. The commercial portions <strong>of</strong> this<br />
corridor are dominated by personal and business services. West <strong>of</strong> the San Diego (I-405)<br />
Freeway, Manchester is flanked by strip commercial development. Between the San<br />
Diego Freeway and Prairie Avenue, the corridor is made up <strong>of</strong> a variety <strong>of</strong> land uses,<br />
including largely strip commercial development. However, <strong>City</strong> Hall and <strong>Inglewood</strong> High<br />
School are also in this area, both important landmarks in the <strong>City</strong>.<br />
Between Van Ness Avenue and Crenshaw Boulevard (Morningside Park), Manchester<br />
Boulevard contains one <strong>of</strong> the few remaining Art Deco districts in the <strong>City</strong>. Several<br />
buildings feature Art Deco façades, which is an important resource that the <strong>City</strong> desires<br />
to protect. The Arcade Theater, Old Rexall Drug Building, and several smaller structures<br />
along Manchester Boulevard are consistently featured as good examples <strong>of</strong> Art Deco<br />
architecture in major publications on the subject. The <strong>City</strong> has bestowed this area with an<br />
Art Deco Design overlay to preserve and encourage this architecture, including the neon<br />
signage. The <strong>City</strong> also adopted Art Deco development standards in late 2002 for a<br />
significant area <strong>of</strong> Manchester Boulevard. 3 Due to the large number <strong>of</strong> service and retail<br />
uses, this corridor has a high level <strong>of</strong> pedestrian activity.<br />
Manchester Boulevard<br />
West <strong>of</strong> I-405 East <strong>of</strong> I-405<br />
3 <strong>City</strong> <strong>of</strong> <strong>Inglewood</strong> website, www.city<strong>of</strong>inglewood.org, Office <strong>of</strong> Economic and Business Development,<br />
accessed March 14, 2006.<br />
2.1-12<br />
<strong>City</strong> <strong>of</strong> <strong>Inglewood</strong> <strong>General</strong> <strong>Plan</strong> <strong>Update</strong> Technical Background Report
2.1 Land Use<br />
Art Deco Façades<br />
Arbor Vitae Street<br />
Arbor Vitae Street is also located within several Redevelopment Project Areas, including<br />
La Cienega, In-Town, and Manchester-Prairie. The entire corridor is dominated by stable<br />
residential uses interspersed with commercial uses. Additionally, the <strong>City</strong>’s second<br />
regional medical center, Centinela Hospital, and supporting services are on the south side<br />
<strong>of</strong> the street between La Brea and Prairie Avenues. There are also several public parking<br />
lots along the corridor which are nicely landscaped. Some incompatibilities exist along the<br />
corridor between the few industrial and residential uses to the west <strong>of</strong> the San Diego (I-<br />
405) Freeway. There is a high level <strong>of</strong> pedestrian activity at the west end <strong>of</strong> this corridor.<br />
Arbor Vitae Street<br />
Commercial-Residential Mix<br />
Public parking lot<br />
Century Boulevard<br />
Century Boulevard is located within several Redevelopment Project Areas, including La<br />
Cienega, In-Town, and Century. This corridor is strategically located in proximity to the<br />
LAX Airport just two miles west, has direct access to the San Diego (I-405) Freeway, and<br />
features the <strong>City</strong>’s largest regional retail and entertainment complexes, including<br />
Hollywood Park Marketplace, which includes Target, Home Depot, Staples, Walgreens,<br />
Bally’s, and Gigante grocery store; Costco, which has recently expanded and has sold a<br />
<strong>City</strong> <strong>of</strong> <strong>Inglewood</strong> <strong>General</strong> <strong>Plan</strong> <strong>Update</strong> Technical Background Report<br />
2.1-13
Chapter 2 Community Development<br />
portion <strong>of</strong> its site for development <strong>of</strong> companion retail; and Hollywood Park Race Track<br />
and Casino. Additionally, “The Village at Century”, adjacent to Costco, was recently<br />
completed in 2006, and includes Michael’s, Bed, Bath, & Beyond, Marshall’s, Red<br />
Lobster, and Chili’s. The <strong>City</strong> is also in the exclusive negotiation stage for development <strong>of</strong><br />
the proposed “<strong>Inglewood</strong> Promenade”, located along Century Boulevard across from<br />
Hollywood Park, and will include a state-<strong>of</strong>-the-art movie theater and mixed <strong>of</strong>fice and<br />
retail uses.<br />
While much improvement has occurred and continues to occur along Century Boulevard,<br />
much <strong>of</strong> the corridor, especially west <strong>of</strong> Prairie Avenue, suffers from many abandoned,<br />
underutilized, or vacant properties. The corridor experiences heavy traffic volumes, and is<br />
almost entirely devoid <strong>of</strong> greenery and open space, rendering it pedestrian unfriendly. An<br />
opportunity exists to create an important entry point into the <strong>City</strong> where Century<br />
Boulevard intersects with the 405 Freeway, with special emphasis on an airport-oriented<br />
identity.<br />
Century Boulevard<br />
Imperial Highway<br />
Imperial Highway is located within the Imperial-Prairie Redevelopment Project Area.<br />
Some <strong>of</strong> its assets include a Metro Green line station at the intersection <strong>of</strong> Imperial<br />
Highway and Hawthorne Boulevard; a neighborhood retail center at the northeast corner<br />
<strong>of</strong> the Imperial-Crenshaw intersection; and the Crenshaw-Imperial Village shopping<br />
center, currently undergoing comprehensive renovation, providing a mix <strong>of</strong><br />
neighborhood-serving retail and <strong>of</strong>fice/commercial uses. Much <strong>of</strong> the corridor, however,<br />
is largely characterized by an obsolete mix <strong>of</strong> commercial and retail uses, with high<br />
vacancies and empty parking lots. The Crenshaw Boulevard street trees nearby to the<br />
north create a park like corridor, which could contribute to a potential viable gateway<br />
intersection with Imperial Highway into the <strong>City</strong> from the east.<br />
2.1-14<br />
<strong>City</strong> <strong>of</strong> <strong>Inglewood</strong> <strong>General</strong> <strong>Plan</strong> <strong>Update</strong> Technical Background Report
2.1 Land Use<br />
Imperial Highway<br />
East <strong>of</strong> Crenshaw Boulevard<br />
Crenshaw Boulevard—north <strong>of</strong> Imperial Highway<br />
Office<br />
As shown in Table 2.1-1, <strong>of</strong>fice uses comprise 113.4 acres, or 2.5 percent <strong>of</strong> the <strong>City</strong>’s<br />
total acreage. Each <strong>of</strong> the three subcategories (stores/<strong>of</strong>fice, <strong>of</strong>fice building, and<br />
pr<strong>of</strong>essional building) account for approximately 1.0 percent or less <strong>of</strong> the <strong>City</strong>’s total<br />
acreage. Office uses are generally interspersed with commercial uses along the major<br />
arterials discussed above. There are no large-scale <strong>of</strong>fice complexes in the <strong>City</strong>.<br />
Industrial<br />
<strong>Inglewood</strong> is located in a highly desirable industrial real estate market because <strong>of</strong> its<br />
location adjacent to the LAX airport, the San Diego (I-405) Freeway, and the Century (I-<br />
105) Freeway. As shown in Table 2.1-1, industrial uses comprise 191.7 acres, or<br />
4.2 percent <strong>of</strong> the <strong>City</strong>’s total acreage. Industrial uses are divided into three subcategories,<br />
including industrial, heavy-industrial, and light manufacturing uses. As shown in Figure<br />
2.1-1, the majority <strong>of</strong> industrial uses in the <strong>City</strong> are located west <strong>of</strong> the San Diego<br />
Freeway, and along Florence Avenue.<br />
<strong>City</strong> <strong>of</strong> <strong>Inglewood</strong> <strong>General</strong> <strong>Plan</strong> <strong>Update</strong> Technical Background Report<br />
2.1-15
Chapter 2 Community Development<br />
Industrial Areas<br />
Public Facilities<br />
As shown in Table 2.1-1, public facilities include governmental and institutional uses such<br />
as the Civic Center, hospitals, churches, and schools. Together these land uses comprise<br />
562.5 acres, or 12.4 percent <strong>of</strong> the <strong>City</strong>’s total acreage. The Civic Center, which includes<br />
<strong>City</strong> Hall, the Police Station, main library, and Superior Court are found in the downtown<br />
area in the west-central portion <strong>of</strong> the <strong>City</strong>, while other public facilities are spread out<br />
around the <strong>City</strong>.<br />
Public and Semi Public Land Uses<br />
<strong>Inglewood</strong> Park Cemetery<br />
<strong>City</strong> Hall<br />
Parks<br />
As shown in Table 2.1-1, open space and recreational uses comprise 92.6 acres, or<br />
2.0 percent <strong>of</strong> the <strong>City</strong>’s total land area. This area includes primarily the <strong>City</strong>’s municipal<br />
parks, which are discussed in detail in Section 4.2 (Recreation and Parks) <strong>of</strong> this TBR.<br />
2.1-16<br />
<strong>City</strong> <strong>of</strong> <strong>Inglewood</strong> <strong>General</strong> <strong>Plan</strong> <strong>Update</strong> Technical Background Report
2.1 Land Use<br />
Other<br />
Other land uses do not fit into a specific category but are still important to identify. These<br />
land uses, as described above, include utilities, right-<strong>of</strong>-ways, parking lots, clubs,<br />
greenhouses, and areas not defined by the Los Angeles County Assessors Office from<br />
which these land uses were obtained. Combined, these land uses comprise 253.9 acres, or<br />
5.6 percent <strong>of</strong> the <strong>City</strong>’s total acreage, and are found scattered throughout the <strong>City</strong>.<br />
• <strong>City</strong> <strong>of</strong> <strong>Inglewood</strong> <strong>General</strong> <strong>Plan</strong><br />
This section presents information regarding the <strong>General</strong> <strong>Plan</strong> Land Use Designations that<br />
guide the proposed use and development <strong>of</strong> lands within <strong>Inglewood</strong>. It is derived from<br />
the Land Use Element <strong>of</strong> the <strong>Inglewood</strong> <strong>General</strong> <strong>Plan</strong>, which was adopted in January<br />
1980. The Land Use Element Map was subsequently amended in 1990, 1995, and 2005.<br />
The <strong>General</strong> <strong>Plan</strong> Land Use Designations are illustrated in Figure 2.1-2.<br />
A <strong>General</strong> <strong>Plan</strong> defines a jurisdiction’s policy for land use development within its<br />
boundaries. <strong>General</strong> <strong>Plan</strong> designations identify the proposed distribution, location, and<br />
extent <strong>of</strong> planned land uses. Designations provide guidelines for the maximum intensity<br />
and density <strong>of</strong> development, such as the number <strong>of</strong> dwelling units per acre and<br />
commercial building square footage.<br />
2005 <strong>General</strong> <strong>Plan</strong> Land Use Designations<br />
The <strong>City</strong> <strong>of</strong> <strong>Inglewood</strong> describes the allowable uses within its limits in its Land Use<br />
Element. The <strong>City</strong>’s 2005 Land Use Map illustrates the proposed use and development <strong>of</strong><br />
all lands in six major categories:<br />
• Residential<br />
• Commercial<br />
• Industrial<br />
• Public/Semi-Public<br />
• Hospital-Medical/Residential<br />
• Open Space<br />
The residential and commercial land use categories are divided into subcategories. The<br />
uses described in these categories should be considered predominant, although different<br />
land uses may be present within each category.<br />
Residential<br />
The residential land use categories defined below reflect various housing product types in<br />
the <strong>City</strong> <strong>of</strong> <strong>Inglewood</strong>. In many cases, the descriptions in the classifications allow more<br />
than one product type in the area discussed. In those cases, the map illustration is not<br />
intended to limit future development to that product type, but is merely a depiction <strong>of</strong><br />
anticipated development, given the density allowed in the area. The language in the Land<br />
Use Element text is the controlling factor in these instances.<br />
<strong>City</strong> <strong>of</strong> <strong>Inglewood</strong> <strong>General</strong> <strong>Plan</strong> <strong>Update</strong> Technical Background Report<br />
2.1-17
Chapter 2 Community Development<br />
The residential land use categories are described below in a specific order that forms a<br />
hierarchy <strong>of</strong> residential land uses. Each residential category allows the uses contained in<br />
that description, as well as the allowed residential types described in the preceding<br />
category(ies).<br />
• Low Density Residential: 0–6 D.U./AC. This land use category has been applied to<br />
all single-family development, and is generally located in the eastern, southern,<br />
southwestern, and northwestern portions <strong>of</strong> the <strong>City</strong>. The density standards for this<br />
class provide for from one to six units to the acre.<br />
• Low-Medium Density Residential: 7–22 D.U./AC. This land use category has been<br />
applied to two main areas; the northeastern and southeastern portions <strong>of</strong> the <strong>City</strong><br />
and represent major locations suitable for infill housing and conversion to<br />
townhouse complexes and garden apartments. These areas are presently developed<br />
primarily as single-family but they are well located with respect to convenience and<br />
access to the regional transportation network and serve as buffers or transition<br />
areas between more intensive development and areas <strong>of</strong> less intensive use. This<br />
category has a relatively flexible density standard <strong>of</strong> from seven to twenty-two<br />
dwelling units to the acre.<br />
• Medium Density Residential: 23–43 D.U./AC. This land use category has been<br />
applied to primarily those areas surrounding the downtown business district and<br />
Civic Center. Several <strong>of</strong> these areas are still developed with single-family densities<br />
but are generally in states <strong>of</strong> transition to more intense development. The locations<br />
provide ideal access to the regional freeway network and close-in convenience to<br />
the major shopping facilities <strong>of</strong> the downtown business district. The standards<br />
provide for relative large multiple dwelling complexes at a density <strong>of</strong> 23 to 43<br />
dwellings to the acre.<br />
Commercial<br />
Areas designated for commercial uses are divided into three categories, described below.<br />
Building intensity standards for commercial uses are already controlled by the <strong>City</strong>’s<br />
Zoning Ordinance and no additional regulations are proposed by the Land Use Element.<br />
• Commercial. This land use category basically represents all forms <strong>of</strong> commercial<br />
enterprise. This may include retail and service uses; corporate, medical, and other<br />
<strong>of</strong>fices; restaurants; hotels and motels; and other commercial uses. Commercial<br />
areas are designated along the <strong>City</strong>’s major arterials, including the north-south<br />
arterials <strong>of</strong> La Cienega Boulevard, La Brea Avenue, Prairie Avenue, and Crenshaw<br />
Boulevard; and the east-west arterials <strong>of</strong> Centinela Avenue, Manchester Boulevard,<br />
Arbor-Vitae Street, Century Boulevard, and Imperial Highway.<br />
• Commercial/Residential. This land use category represents areas allowed for mixed<br />
commercial and residential. These areas are primarily concentrated around the<br />
Central Business District and Civic Center in the west-central portion <strong>of</strong> the <strong>City</strong>,<br />
in portions along Prairie Avenue and Imperial Highway, and in nodes at and<br />
around the intersections <strong>of</strong> Centinela Avenue and La Brea Avenue, and Manchester<br />
and Crenshaw Boulevards.<br />
2.1-18<br />
<strong>City</strong> <strong>of</strong> <strong>Inglewood</strong> <strong>General</strong> <strong>Plan</strong> <strong>Update</strong> Technical Background Report
2.1 Land Use<br />
• Commercial/Recreation. This land use category is the area where both commercial<br />
and private recreation and similar uses would be allowed. This includes the area<br />
currently developed as the Hollywood Park Race Track & Casino and The Forum.<br />
Industrial<br />
This land use category has been applied to those areas that encompass both light and<br />
heavy industrial uses. The Element indicates that the distinction between light industrial<br />
or heavy industrial is not crucial in that virtually all new development would be located<br />
within industrial park areas and subject to review by the <strong>City</strong>. The <strong>City</strong>’s industrial areas<br />
take into account three factors involved in their location: infrastructure (transportation<br />
facilities and utilities), compatibility <strong>of</strong> use, and proximity to an adequate labor force.<br />
Industrial areas are designated primarily in the area west <strong>of</strong> the San Diego (I-405)<br />
Freeway, and in large portions along Florence Avenue and Century Boulevard.<br />
Public/Semi-Public<br />
This land use category has been applied to those areas used for civic purposes, including<br />
<strong>City</strong> Hall, the library, and the police station, and also includes other public institutions<br />
such as <strong>Inglewood</strong> High School and the <strong>Inglewood</strong> Park Cemetery. These areas are found<br />
primarily concentrated in the Civic Center area in the west-central portion <strong>of</strong> the <strong>City</strong>,<br />
and scattered as well in various locations throughout the <strong>City</strong>.<br />
Open Space<br />
This land use category distinguishes those lands and uses which are <strong>of</strong> such a nature that<br />
they should be reserved for open space and/or recreational activities. The largest<br />
concentration <strong>of</strong> open space in the <strong>City</strong> is Edward Vincent Jr. Park. Smaller areas include<br />
all <strong>of</strong> the other municipal parks throughout the <strong>City</strong>.<br />
Hospital-Medical/Residential<br />
This land use category is an outgrowth <strong>of</strong> a specialized land use situation. <strong>Inglewood</strong> has<br />
two regional medical centers which are a dominating influence on the surrounding land<br />
pattern. Both Daniel Freeman and Centinela Hospital have grown to the point where<br />
they have attracted adjacent satellite uses such as medical <strong>of</strong>fices, convalescent and<br />
nursing homes, pharmacies and similar uses. The areas designated in Figure 2.1-2 are<br />
those areas which are within the vicinity <strong>of</strong> the respective hospitals and permit both<br />
hospital related uses and residential uses.<br />
Distribution <strong>of</strong> 2005 <strong>General</strong> <strong>Plan</strong> Land Use Designations<br />
The adopted <strong>General</strong> <strong>Plan</strong> land use designations for the <strong>City</strong> <strong>of</strong> <strong>Inglewood</strong> are shown in<br />
Table 2.1-2. Nearly 60 percent <strong>of</strong> the <strong>City</strong>’s total acres are designated for residential<br />
development. Among the residential categories, Low-Density residential makes up the<br />
majority <strong>of</strong> the <strong>City</strong>’s total acreage (30.5 percent), followed by almost equal proportions<br />
<strong>of</strong> Low/Medium-Density and Medium-Density residential, comprising 13.6 and 14.4 percent<br />
<strong>City</strong> <strong>of</strong> <strong>Inglewood</strong> <strong>General</strong> <strong>Plan</strong> <strong>Update</strong> Technical Background Report<br />
2.1-19
Chapter 2 Community Development<br />
respectively. Commercial designated land uses make up the second largest category,<br />
comprising 22.8 percent <strong>of</strong> the <strong>City</strong>’s total land area. Among the commercial categories,<br />
Commercial uses make up the majority <strong>of</strong> land area, comprising 9.4 percent <strong>of</strong> the <strong>City</strong>’s<br />
total acreage, followed closely by Commercial/Residential uses at 7.7 percent.<br />
Table 2.1-2<br />
<strong>General</strong> <strong>Plan</strong> Land Use Designations<br />
Land Use Acres a Percent <strong>of</strong> <strong>City</strong>’s Total Acres<br />
Residential 3,382.9 58.6%<br />
Low Density 1,764.3 30.5%<br />
Low/Medium Density 787.4 13.6%<br />
Medium Density 831.3 14.4%<br />
Commercial 1,317.2 22.8%<br />
Commercial 542.6 9.4%<br />
Commercial/Residential 447.6 7.7%<br />
Commercial/Recreational 326.9 5.7%<br />
Industrial 495.9 8.6%<br />
Public/Semi-Public 369.8 6.4%<br />
Hospital-Medical/Residential 103.9 1.8%<br />
Open-Space 107.6 1.9%<br />
Total 5,777.2 100.0%<br />
SOURCE: <strong>City</strong> <strong>of</strong> <strong>Inglewood</strong> 2006<br />
a Acreage includes street right-<strong>of</strong>-way, and railroad right-<strong>of</strong>-way<br />
Presently, the <strong>City</strong> does not have a corresponding zone specifically for commercialresidential<br />
use; however, in 1982, the <strong>City</strong> amended the zoning code to allow<br />
development <strong>of</strong> residential uses as part <strong>of</strong> mixed-use residential/commercial development<br />
in the downtown C-1 zoned area. 4<br />
Comparison <strong>of</strong> Existing Land Uses and <strong>General</strong> <strong>Plan</strong> Designations<br />
Areas where the existing land uses differ from the <strong>General</strong> <strong>Plan</strong> are described below. Due<br />
to the difference in categories depicted in the existing land use data and the <strong>General</strong> <strong>Plan</strong>,<br />
only a general comparison can be made between the <strong>City</strong>’s <strong>General</strong> <strong>Plan</strong> designations and<br />
existing development.<br />
Residential<br />
Residential areas generally correspond with the <strong>General</strong> <strong>Plan</strong>, with minor exceptions and<br />
inconsistencies. Some parcels within the designated single-family residential areas are<br />
currently developed with higher-density residential land uses, and vice versa. Residential<br />
areas are also found encroaching into commercially- and industrially-designated areas.<br />
4 <strong>Inglewood</strong>, <strong>City</strong> <strong>of</strong>. 2005. Housing Element, <strong>Inglewood</strong> <strong>General</strong> <strong>Plan</strong>. December 6.<br />
2.1-20<br />
<strong>City</strong> <strong>of</strong> <strong>Inglewood</strong> <strong>General</strong> <strong>Plan</strong> <strong>Update</strong> Technical Background Report
CITY <strong>of</strong> INGLEWOOD<br />
<strong>General</strong> <strong>Plan</strong><br />
GENERAL PLAN LAND USE<br />
Source: <strong>City</strong> <strong>of</strong> <strong>Inglewood</strong>, February 2006.<br />
Date: April 25, 2006<br />
A Division <strong>of</strong><br />
Miles<br />
0 0.25<br />
0.5<br />
Figure 2.1-2
2.1 Land Use<br />
Commercial<br />
Existing locations <strong>of</strong> commercial land uses generally correspond with the <strong>General</strong> <strong>Plan</strong>,<br />
however, along the major commercial arterials are also found many other land uses<br />
interspersed, including a large amount <strong>of</strong> residential, and some institutional and industrial<br />
uses. The <strong>General</strong> <strong>Plan</strong> also prescribes an increase in the depth <strong>of</strong> commercial area along<br />
the major arterials such as La Brea Avenue, Prairie Avenue, and Manchester Boulevard,<br />
that does not currently exist. An increase in lot size and depth encourages the provision<br />
<strong>of</strong> adequate <strong>of</strong>f-street parking and the development <strong>of</strong> modern, more concentrated<br />
shopping nodes.<br />
Industrial<br />
Existing industrial areas generally correspond with the <strong>General</strong> <strong>Plan</strong>, except as follows:<br />
the <strong>General</strong> plan designates industrial uses along the south side <strong>of</strong> Century Boulevard,<br />
between approximately <strong>Inglewood</strong> Avenue and Club Drive, which currently exists as<br />
primarily commercial development.<br />
• Specific <strong>Plan</strong> Areas<br />
The <strong>City</strong> <strong>of</strong> <strong>Inglewood</strong> currently has two specific plan areas, the International Business<br />
Park, adopted in 1993, and the Village Specific <strong>Plan</strong>, adopted in 1998. These areas are<br />
identified in Figure 2.1-3 and described below.<br />
International Business Park Specific <strong>Plan</strong><br />
The <strong>Inglewood</strong> International Business Park Specific <strong>Plan</strong> is located in the south-eastern<br />
portion <strong>of</strong> <strong>Inglewood</strong> and bounded by Prairie Avenue on the west, 102 nd Street on the<br />
north, Yukon Avenue on the east, and 104 th Street on the south. The Specific <strong>Plan</strong><br />
establishes development standards for land use, urban design, circulation, site access,<br />
infrastructure requirements and the design character for the area and aims to fulfill the<br />
following objectives 5 :<br />
• The anticipated removal <strong>of</strong> area’s residential units that are impacted by noise<br />
attributable to the aircraft operations <strong>of</strong> Los Angeles International Airport, and the<br />
relocation <strong>of</strong> the residents<br />
• The provision <strong>of</strong> appropriately sized industrial designated parcels<br />
• The provision <strong>of</strong> vehicular and pedestrian circulation facilities, sanitation, sewer<br />
facilities, water, storm drain facilities, utilities and other adequately sized<br />
infrastructure that support the projected industrial park use<br />
• The provision <strong>of</strong> the uses in an aesthetically pleasing “campus like” setting<br />
5 Envicom Corporation, 1993. <strong>Inglewood</strong> International Business Park Specific <strong>Plan</strong>. 21 December.<br />
<strong>City</strong> <strong>of</strong> <strong>Inglewood</strong> <strong>General</strong> <strong>Plan</strong> <strong>Update</strong> Technical Background Report<br />
2.1-23
Chapter 2 Community Development<br />
Village Specific <strong>Plan</strong><br />
The Village, formerly known as Darby-Dixon, is located just east <strong>of</strong> the International<br />
Business Park Specific <strong>Plan</strong>, and is bounded by Club Drive on the west, Century<br />
Boulevard on the north, Crenshaw Boulevard on the east, and 104 th Street on the south.<br />
When the Specific <strong>Plan</strong> was adopted in 1998, the area was experiencing a high level <strong>of</strong><br />
crime and blight, including impacts from high aircraft noise levels, physical deterioration,<br />
increased costs for property owners, and diminished quality <strong>of</strong> life for residents. The<br />
Specific <strong>Plan</strong> was prepared to aid in the economic and residential revitalization <strong>of</strong> the<br />
neighborhood by putting in place a vision, physical plan, development regulations, and<br />
implementation strategy. At the northern portion <strong>of</strong> the Specific <strong>Plan</strong> is the “Village at<br />
Century”, recently completed in 2006, consisting <strong>of</strong> major retail, restaurants, and other<br />
specialty shops including Michael’s, Bed, Bath, & Beyond, Marshall’s, Red Lobster, and<br />
Chili’s. The southern portion consists <strong>of</strong> the new and renovated residential areas which<br />
are buffered from the commercial areas by two areas <strong>of</strong> public open space in the middle<br />
<strong>of</strong> the Specific <strong>Plan</strong> Area. 6<br />
• Redevelopment Project Areas<br />
The <strong>Inglewood</strong> Redevelopment Agency was established in 1969 to revitalize blighted<br />
areas in the <strong>City</strong> that have been designated as Redevelopment Project Areas by the <strong>City</strong><br />
Council. The overall goal <strong>of</strong> the Agency is to eliminate blight to promote new<br />
development and to enhance private sector investment within the Project Areas. The <strong>City</strong><br />
currently has six Redevelopment Project Areas, as illustrated in Figure 2.1-4. Following is<br />
a list <strong>of</strong> current projects planned within some <strong>of</strong> the Project Areas, as <strong>of</strong> February, 2005. 7<br />
In-Town Project Area<br />
D-3 Development. This project includes a 37,000-square-foot Retail Center on a 2.8-acre site<br />
bounded by La Brea Avenue on the west, Regent Avenue on the south, Market Street on<br />
the east, and Florence Avenue on the north. The <strong>City</strong> is currently in the exclusive<br />
negotiation stage with the developer for this project.<br />
Century Project Area<br />
The Village at Century. This project is located on a 19-acre site bounded by Club Drive on<br />
the west, Century Boulevard on the north, Crenshaw Boulevard on the east, and 104 th<br />
Street on the south. The project was recently completed in 2006 by the Haagan<br />
Company. The Village consists <strong>of</strong> a 193,000-square-foot retail shopping center adjacent<br />
to the Costco Center, featuring major retail, restaurants, and other specialty shops<br />
including Ross, Marshall’s, Bed, Bath, & Beyond, Petco, Michael’s, Red Lobster, and<br />
6 Christopher A. Joseph & Associates, 2004. Addendum to the Village Specific <strong>Plan</strong> Environmental Impact<br />
Report fort the Village at Century Project. May.<br />
7 <strong>Inglewood</strong>, <strong>City</strong> <strong>of</strong>. 2005. Redevelopment Project Summaries. February.<br />
2.1-24<br />
<strong>City</strong> <strong>of</strong> <strong>Inglewood</strong> <strong>General</strong> <strong>Plan</strong> <strong>Update</strong> Technical Background Report
W 64TH ST<br />
S LA CIENEGA BLVD<br />
S ASH AV<br />
N MARKET ST<br />
S MARKET ST<br />
S OSAGE AV<br />
CULLEN WY<br />
CLUB DR<br />
CITY <strong>of</strong> INGLEWOOD<br />
<strong>General</strong> <strong>Plan</strong><br />
Ladera Heights<br />
Hills<br />
SPECIFIC PLAN<br />
PROJECTS IN INGLEWOOD<br />
L O S A N G E L E S C O U N T Y<br />
W 64TH ST<br />
W 64TH PL<br />
E FAIRVIEW BLVD<br />
N LA BREA AV<br />
AVIATION BLVD<br />
W OLIVE ST<br />
S ISIS AV<br />
S HINDRY AV<br />
<strong>City</strong><br />
<strong>of</strong><br />
Los Angeles<br />
S GLASGOW AV<br />
l<br />
W FAIRVIEW BLVD<br />
W ELLIS AV<br />
W HILLSDALE ST<br />
CENTINELA AV<br />
W HILL ST<br />
405<br />
W VICTOR AV<br />
W FLORENCE AV<br />
W REGENT ST<br />
W QUEEN ST<br />
W KELSO ST<br />
W HILLCREST BLVD<br />
W ELM AV<br />
W PLYMOUTH ST<br />
W VENICE WY<br />
W MANCHESTER BLVD<br />
W OLIVE ST<br />
W NECTARINE ST<br />
W LIME ST<br />
W SPRUCE AV<br />
W MAGNOLIA AV<br />
W BUCKTHORN ST<br />
W ARBOR VITAE ST<br />
S OAK ST<br />
S HOLLY ST<br />
W 96TH ST<br />
W 97TH ST<br />
W 98TH ST<br />
W 99TH ST<br />
W HYDE PARK BLVD<br />
N OAK ST<br />
S ROSEWOOD AV<br />
S EUCALYPTUS AV<br />
S TRURO AV<br />
N FIR AV<br />
S FIR AV<br />
W IVY AV<br />
S WALNUT ST<br />
S GREVILLEA AV<br />
S MAPLE AV<br />
S BURIN AV<br />
S LA BREA AV<br />
E BRETT ST<br />
E HILLSDALE ST<br />
E STEPNEY ST<br />
S HAWTHORNE BLVD<br />
E HARGRAVE ST<br />
HYDE PARK PL<br />
E HAZEL ST<br />
S ORCHARD DR<br />
E WARREN LN<br />
S LOCUST ST<br />
E SPRUCE AV<br />
S LARCH ST<br />
E TAMARACK AV<br />
S MYRTLE AV<br />
E FLORENCE AV<br />
E GRACE AV<br />
E REGENT ST<br />
E KELSO ST<br />
W 101ST ST<br />
N PARK AV<br />
N PRAIRIE AV<br />
E QUEEN ST<br />
E LA BREA DR<br />
E BUCKTHORN ST<br />
E ARBOR VITAE ST<br />
S FLOWER ST<br />
E AERICK ST<br />
MANCHESTER TER<br />
S OSAGE AV<br />
W 103RD ST<br />
S PRAIRIE AV<br />
E BRETT ST<br />
E HYDE PARK BLVD<br />
E 65TH ST<br />
W MANCHESTER BLVD<br />
E HARDY ST<br />
W CENTURY BLVD<br />
W 102ND ST<br />
W 104TH ST<br />
W 105TH ST<br />
W 106TH ST<br />
KAREEM CT<br />
E 66TH ST<br />
WEST BLVD<br />
REDONDO BLVD<br />
Hollywood<br />
Park<br />
Lake<br />
YUKON AV<br />
WEST BLVD<br />
W 74TH ST<br />
VICTORIA AV<br />
PINCAY DR<br />
LUTHER LN<br />
POETS LN<br />
W 79TH ST<br />
W 81ST ST<br />
W 82ND ST<br />
W 82ND PL<br />
W 83RD ST<br />
W 84TH PL<br />
VILLAGE<br />
SPECIFIC PLAN<br />
S 12TH AV<br />
<strong>City</strong><br />
<strong>of</strong><br />
Los Angeles<br />
11TH AV<br />
S 11TH AV<br />
S 10TH AV<br />
S 10TH AV<br />
S 8TH AV<br />
CRENSHAW BLVD<br />
W 76TH ST<br />
W 77TH ST<br />
W 78TH ST<br />
W 78TH PL<br />
W 79TH ST<br />
W 80TH ST<br />
W 81ST ST<br />
W 82ND ST<br />
W 84TH ST<br />
W 84TH PL<br />
W 85TH ST<br />
W 88TH ST<br />
W 90TH ST<br />
S 8TH AV<br />
S 6TH AV<br />
S 5TH AV<br />
S 5TH AV<br />
W 101ST ST<br />
W 104TH ST<br />
MAITLAND AV<br />
S 4TH AV<br />
S BYRD AV<br />
S 3RD AV<br />
S 2ND AV<br />
S VAN NESS AV<br />
S VAN NESS AV<br />
<strong>City</strong> <strong>of</strong> Los Angeles<br />
Legend<br />
<strong>City</strong> Boundary<br />
Water Body<br />
Lennox<br />
L O S<br />
A N G E L E S<br />
C O U N T Y<br />
<strong>City</strong><br />
<strong>of</strong><br />
Hawthorne<br />
INGLEWOOD<br />
INTERNATIONAL<br />
BUSINESS PARK<br />
SPECIFIC PLAN<br />
S PRAIRIE AV<br />
W 107TH ST<br />
W 108TH ST<br />
W 109TH ST<br />
W 110TH ST<br />
W 111TH ST<br />
W 111TH PL<br />
W 112TH ST<br />
W 113TH ST<br />
S DOTY AV<br />
W IMPERIAL HWY<br />
105<br />
W 116TH ST<br />
W 117TH ST<br />
W 118TH ST<br />
W 118TH PL<br />
S CHERRY AV<br />
S DEHN AV<br />
S LEMOLI AV<br />
S SIMMS AV<br />
W 108TH ST<br />
ATKINSON AV<br />
ARDATH AV<br />
WILKIE AV<br />
THOREAU ST<br />
W 111TH ST<br />
W 112TH ST<br />
W IMPERIAL HWY<br />
S SPINNING AV<br />
W 115TH ST<br />
L O S<br />
A N G E L E S<br />
C O U N T Y<br />
Metro Rail<br />
Railroad<br />
Source: <strong>City</strong> <strong>of</strong> <strong>Inglewood</strong>, February 2006.<br />
Date: April 10, 2006<br />
Miles<br />
A Division <strong>of</strong> 0 0.25 0.5<br />
Figure 2.1-3
CITY <strong>of</strong> INGLEWOOD<br />
<strong>General</strong> <strong>Plan</strong><br />
REDEVELOPMENT PROJECT AREAS<br />
Legend<br />
Century Project Area<br />
Imperial-Prairie Project Area<br />
In-Town Project Area<br />
La Cienega Project Area<br />
Manchester-Prairie Project Area<br />
North <strong>Inglewood</strong> Industrial Project Area<br />
<strong>City</strong> Boundary<br />
Source: <strong>City</strong> <strong>of</strong> <strong>Inglewood</strong>, February 2006.<br />
Date: April 20, 2006<br />
Miles<br />
A Division <strong>of</strong> 0 0.25 0.5<br />
Figure 2.1-4
2.1 Land Use<br />
Chili’s. An estimated 1,334 construction jobs and 612 full-time jobs were to be created by<br />
this project.<br />
<strong>Inglewood</strong> Promenade. This project is located on a 10-acre site at 3700 W. Century<br />
Boulevard, and includes a 60,000-square-foot movie theater complex, 40,000-square-foot<br />
surgical center, and 100,000-square-foot medical <strong>of</strong>fice building. The <strong>City</strong> is currently in<br />
the exclusive negotiation stage with the developer Imperial Partners, LLC, for this<br />
project.<br />
La Cienega Project Area<br />
LA CycleSports. This project is located on a 2.7-acre site at 900–920 W. Olive Street, and<br />
includes a 66,000-square-foot motorcycle/all-terrain vehicle and watercraft vehicle<br />
dealership. The <strong>City</strong> is currently finalizing the Disposition and Development Agreement<br />
with the developer Larry Hart.<br />
Areas Susceptible to Change and Approved Projects<br />
The following areas are identified by the <strong>City</strong> as being susceptible to change due to<br />
development interest, or recently approved projects not yet constructed.<br />
• Hollywood Park Racetrack and Casino. The 68-year-old Hollywood Park is on a 240-<br />
acre parcel that the owner has decided is too expensive to continue maintaining as<br />
its current use as a racetrack. Currently the owner, Churchhill Downs, is in the<br />
process <strong>of</strong> interviewing developers with the ability to purchase the site. The future<br />
use <strong>of</strong> the property has not yet been decided. 8<br />
• Queen Street/Locust Street Senior Housing. This project, developed by the <strong>City</strong>’s<br />
Redevelopment Agency, is a senior housing project and senior citizen center at<br />
Locust Street and Queen Street. The architect, Kennard Design Group/WWCOT,<br />
is currently in the process <strong>of</strong> preparing the construction drawings. The estimated<br />
completion date is September <strong>of</strong> 2008.<br />
• Yukon Avenue and 118 th Place. This project includes nine single-family four-bedroom<br />
affordable homes, estimated for completion in 2006.<br />
• Beach Street Housing Project. This project is located at 716-720 Beach Street and<br />
includes four affordable detached town home condominiums. The estimated<br />
completion date is 2006.<br />
• Commercial-retail Shopping Center. This project is located on a 9-acre site within the<br />
Imperial-Prairie Project Area at the southwest corner <strong>of</strong> Crenshaw Boulevard and<br />
Imperial Highway. The owner <strong>of</strong> the site is beginning the entitlement process for<br />
development <strong>of</strong> a shopping center.<br />
8 Real Estate Quarterly, Los Angeles Business Journal, 2005. The Last Days <strong>of</strong> Hollywood Park, 25 April.<br />
<strong>City</strong> <strong>of</strong> <strong>Inglewood</strong> <strong>General</strong> <strong>Plan</strong> <strong>Update</strong> Technical Background Report<br />
2.1-29
Chapter 2 Community Development<br />
• Regulatory Setting<br />
Zoning<br />
Zoning is an implementation tool that establishes districts <strong>of</strong> permitted and prohibited<br />
uses to control the physical development <strong>of</strong> land consistent with the <strong>General</strong> <strong>Plan</strong>. In<br />
addition to permitted uses, zoning may also establish development standards relating to<br />
issues such as intensity, setbacks, height, and parking. California law requires that zoning<br />
be brought into conformance with the <strong>General</strong> <strong>Plan</strong> within a reasonable time period.<br />
Projects submitted for review and approval are evaluated for consistency with both the<br />
<strong>General</strong> <strong>Plan</strong> and the <strong>City</strong>’s Zoning Code. For large-scale development applications, a<br />
Specific <strong>Plan</strong> may replace the underlying zoning.<br />
Zoning Classifications<br />
The <strong>City</strong> <strong>of</strong> <strong>Inglewood</strong> <strong>General</strong> <strong>Plan</strong>, Zoning Map, and Zoning Ordinance control the<br />
boundaries <strong>of</strong> the zones in the <strong>City</strong> as well as the zoning regulations that are in effect<br />
within each zone classification. In some cases the land use densities within the <strong>General</strong><br />
<strong>Plan</strong> and Zoning Ordinance are slightly inconsistent. Zoning regulations identify land<br />
uses and activities that are allowed, prohibited, or are allowed only with a Conditional Use<br />
Permit or other discretionary permit. <strong>Inglewood</strong> has 24 zoning classifications within its<br />
boundaries as illustrated in Figure 2.1-5. The zoning classifications and their associated<br />
acreages are shown in Table 2.1-3.<br />
Design and Development Standards<br />
The <strong>City</strong>’s Design and Development Standards, adopted January 30, 1979, is a separate<br />
document that does not replace or supersede the <strong>Inglewood</strong> Zoning Ordinance, but<br />
contains required design standards and guidelines for site development. The <strong>City</strong> has<br />
established a design review process and design standards to accomplish the following:<br />
• To maximize freedom, creativity and innovation in the architecture, landscape<br />
design and graphics <strong>of</strong> each individual project within the framework <strong>of</strong> constraints<br />
imposed by the community’s need to control development for the health, safety<br />
and general welfare <strong>of</strong> its citizens<br />
• To promote a visually attractive, safe and well planned community through the use<br />
<strong>of</strong> sound design techniques<br />
• To protect citizens from unsafe or unsightly conditions<br />
• To minimize potential nuisances to the uses surrounding the new development<br />
• To preserve and maximize the image, character and visual quality which is making<br />
<strong>Inglewood</strong> an attractive place to live and work<br />
<strong>Inglewood</strong> Downtown District Main Street Project Area Historic Design<br />
Guidelines<br />
These historic design guidelines, adopted May 15, 2000, are a result <strong>of</strong> a historic resources<br />
survey <strong>of</strong> the <strong>Inglewood</strong> Downtown District/Main Street project area that began in 1998.<br />
The project area is bounded by La Brea Avenue to the west, Locust Street to the east,<br />
2.1-30<br />
<strong>City</strong> <strong>of</strong> <strong>Inglewood</strong> <strong>General</strong> <strong>Plan</strong> <strong>Update</strong> Technical Background Report
CITY <strong>of</strong> INGLEWOOD<br />
<strong>General</strong> <strong>Plan</strong><br />
EXISTING ZONING<br />
Source: <strong>City</strong> <strong>of</strong> <strong>Inglewood</strong>, February 2006.<br />
Date: April 25, 2006<br />
A Division <strong>of</strong><br />
Miles<br />
0 0.25<br />
0.5<br />
Figure 2.1-5
2.1 Land Use<br />
Table 2.1-3<br />
Zoning Designations<br />
Zoning Acres Percentage<br />
Single-Family Residential<br />
R-1 Single-Family 1,082.8 24.0%<br />
R-1Z One-Family/Zero-Lot-Line 5.6 < 1%<br />
Subtotal 1,088.4 24.1%<br />
Multiple Family Residential<br />
R-1.5 Limited Two-Family 4.2 < 1%<br />
R-2 Limited Multiple Family 552.6 12.2%<br />
R-2A Limited Multiple Family 237.5 5.3%<br />
R-3 Multiple Family 685.3 15.2%<br />
R-4 Multiple Family 55.8 1.2%<br />
Subtotal 1,535.4 34.0%<br />
R-M Residential and Medical 80.4 1.2%<br />
Commercial<br />
C-1 Limited Commercial 62.4 1.4%<br />
C-2 <strong>General</strong> Commercial 229.6 5.1%<br />
C-2A Airport Commercial 115.7 2.6%<br />
C-3 Heavy Commercial 77.8 1.7%<br />
C-S Commercial Service 31.4
Chapter 2 Community Development<br />
Florence Avenue to the north, and Hillcrest Boulevard to the south. Based on the<br />
preliminary results <strong>of</strong> the historic survey work and research, and the needs <strong>of</strong> the <strong>City</strong> <strong>of</strong><br />
<strong>Inglewood</strong> and Main Street <strong>Inglewood</strong> with regard to the redevelopment <strong>of</strong> the project<br />
area, the scope <strong>of</strong> work was revised to include development <strong>of</strong> this Design Guidelines<br />
Manual. 9<br />
The design guidelines reflect the unique historic character <strong>of</strong> downtown <strong>Inglewood</strong>. The<br />
built environment <strong>of</strong> downtown reflects the <strong>City</strong>’s growth and development through the<br />
post-World War II period; and should be retained, enhanced, and emulated to ensure that<br />
<strong>Inglewood</strong> continues to convey its historic character. The Historic Design Guidelines is a<br />
comprehensive document that addresses the following: urban design; historic street<br />
patterns; urban scale; streetscape, landscape, and furniture; site elements; building scale,<br />
height, and setback; parking; lighting; building design; corner elements; entries;<br />
fenestration; texture, color, and materials; ro<strong>of</strong>s and ro<strong>of</strong>line features; building signs;<br />
storefronts; awnings; canopies; mechanical or utility screening; and security.<br />
• Issues<br />
• Single-family homes are being increasingly replaced by condominiums or<br />
apartments in multi-family-zoned areas, which has implications related to traffic,<br />
parking, school enrollment, etc.<br />
• The extensive area zoned for commercial along the arterial streets competes with<br />
the maintenance <strong>of</strong> a viable downtown.<br />
• Many businesses along the major arterials have not been maintained and cannot<br />
provide adequate <strong>of</strong>f-street parking due to inadequate lot size. The shallow lots and<br />
multiple small businesses lead to frequent curb cuts, congested streets and a lack<br />
parking.<br />
• The <strong>City</strong> lacks signature development at major gateways into the <strong>City</strong>, such as<br />
Century and Manchester Boulevards from the west, and Prairie Avenue and<br />
Crenshaw Boulevard from the south.<br />
• Many commercial corridors lack the amenities (streetscape, bus shelters, trees, etc.)<br />
necessary to encourage walking.<br />
• References<br />
Christopher A. Joseph & Associates, 2004. Addendum to the Village Specific <strong>Plan</strong><br />
Environmental Impact Report for the Village at Century Project. May.<br />
Envicom Corporation, 1993. <strong>Inglewood</strong> International Business Park Specific <strong>Plan</strong>. 21 December.<br />
<strong>Inglewood</strong>, <strong>City</strong> <strong>of</strong>. 1980. The Land Use Element <strong>of</strong> the <strong>Inglewood</strong> <strong>General</strong> <strong>Plan</strong>. January.<br />
———. 2000. 2000 Housing Element, <strong>Inglewood</strong> <strong>General</strong> <strong>Plan</strong>.<br />
9 <strong>Inglewood</strong>, <strong>City</strong> <strong>of</strong>. 2000. <strong>Inglewood</strong> Downtown District Main Street Project Area Historic Design<br />
Guidelines. May 15.<br />
2.1-34<br />
<strong>City</strong> <strong>of</strong> <strong>Inglewood</strong> <strong>General</strong> <strong>Plan</strong> <strong>Update</strong> Technical Background Report
2.1 Land Use<br />
———. 2000. <strong>Inglewood</strong> Downtown District Main Street Project Area Historic Design Guidelines.<br />
May 15.<br />
———. 2003. Office <strong>of</strong> Economic and Business Development. Market Street. Website.<br />
www.city<strong>of</strong>inglewood.com. 24 July. Accessed March 14, 2006.<br />
———. 2005. Champions <strong>of</strong> Smart Growth & Development. A Great Place to Live, Shop, &<br />
Work. Spring.<br />
———. 2005. Comprehensive <strong>General</strong> <strong>Plan</strong> 2005 Land Use Element Map.<br />
———. Zoning Code.<br />
Kosmont Partners, 2003. <strong>Inglewood</strong> Economic Development Opportunities Assessment Report<br />
Volume No. II. February.<br />
Real Estate Quarterly, Los Angeles Business Journal, 2005. The Last Days <strong>of</strong> Hollywood<br />
Park. 25 April.<br />
The <strong>Plan</strong>ning Center, 1998. <strong>City</strong> <strong>of</strong> <strong>Inglewood</strong> Village Specific <strong>Plan</strong>, December.<br />
<strong>City</strong> <strong>of</strong> <strong>Inglewood</strong> <strong>General</strong> <strong>Plan</strong> <strong>Update</strong> Technical Background Report<br />
2.1-35
2.2 Housing<br />
2.2 HOUSING<br />
This section provides a descriptive pr<strong>of</strong>ile <strong>of</strong> <strong>Inglewood</strong>’s existing housing conditions.<br />
<strong>Inglewood</strong> housing data is compared to Los Angeles County and/or adjacent South Bay<br />
cites, where data is available. Information for this section is taken from a variety <strong>of</strong><br />
sources including the <strong>City</strong>’s 2000–2005 Housing Element, the 2004–2007 Consolidated<br />
<strong>Plan</strong>, the Southern California Association <strong>of</strong> Governments (SCAG) Regional Housing<br />
Needs Assessment (RHNA), California Department <strong>of</strong> Finance (DOF) demographic<br />
statistics, and the 1990 and 2000 U.S. Census.<br />
• Existing Conditions<br />
Housing Development and Dwelling Unit Types<br />
According to 1990 and 2000 Census data, the <strong>City</strong> <strong>of</strong> <strong>Inglewood</strong> has experienced a<br />
decrease in the community’s housing stock since 1990. Between 1990 and 2000, the total<br />
number <strong>of</strong> dwelling units in the <strong>City</strong> decreased by 65; from 38,713 to 38,648 units.<br />
According to 2005 California Department <strong>of</strong> Finance estimates, the number <strong>of</strong> housing<br />
units in the <strong>City</strong> was estimated to be 38,564.<br />
Between 2000 and 2005, an additional 84 units were lost. This indicates an average yearly<br />
decrease in the housing stock <strong>of</strong> almost ten units over a 15-year period. The total number<br />
<strong>of</strong> housing units in the <strong>City</strong> between 1990 and 2005 and the net change in units are<br />
shown in Table 2.2-1 below.<br />
Table 2.2-1 Housing Unit Growth, 1990, 2000, (2005 Estimates)<br />
Year Number <strong>of</strong> Housing Units Net Change in Housing Units<br />
1990 a 38,713 —<br />
2000 a 38,648 -65<br />
2005 b 38,564 -84<br />
SOURCE:<br />
a 1990 and 2000 Census<br />
b California Department <strong>of</strong> Finance<br />
Table 2.2-2 shows the number <strong>of</strong> units for each housing unit type. The majority <strong>of</strong> the<br />
housing stock is made up <strong>of</strong> multi-family housing. The <strong>City</strong>’s 2004-2007 Consolidated<br />
<strong>Plan</strong> reports that the breakdown <strong>of</strong> housing unit type has remained virtually the same<br />
since 1990, with the proportion <strong>of</strong> multi-family development with five or more units<br />
increasing slightly, with a corresponding decrease in single-family detached homes. This<br />
reflects the redistribution <strong>of</strong> lower density single-family homes to higher density multifamily<br />
developments.<br />
<strong>City</strong> <strong>of</strong> <strong>Inglewood</strong> <strong>General</strong> <strong>Plan</strong> <strong>Update</strong> Technical Background Report<br />
2.2-1
Chapter 2 Community Development<br />
Table 2.2-2 <strong>Inglewood</strong> Housing Estimates, 2005<br />
Housing Unit Type Number <strong>of</strong> Units Percent <strong>of</strong> Total<br />
Single-Family Detached 13,958 36.2%<br />
Single-Family Attached 3,228 8.4%<br />
Duplex to Fourplex 4,720 12.2%<br />
Multi-Family 16,420 42.6%<br />
Mobile Home 238 >1.0%<br />
<strong>City</strong> Total 38,564 100.0%<br />
SOURCE: 2005 California Department <strong>of</strong> Finance.<br />
Housing Tenure and Vacancy<br />
In 2000, 36 percent <strong>of</strong> <strong>Inglewood</strong> residents were owners, while 64 percent were renters,<br />
as indicated in Table 2.2-3. Reflecting the minor changes in the composition <strong>of</strong> the<br />
housing stock, the tenure composition within <strong>Inglewood</strong> has remained relatively constant.<br />
In 1990, 36.3 percent <strong>of</strong> households were homeowners, while 63.7 percent were renters.<br />
The percentage <strong>of</strong> owner-households in <strong>Inglewood</strong> was lower in 2000 than the Los<br />
Angeles County average <strong>of</strong> approximately 48 percent.<br />
Table 2.2-3 Housing Tenure, 1990–2000<br />
1990 2000<br />
Tenure Number % Number %<br />
Total Occupied 36,102 93.3% 36,817 95.3%<br />
Owner Occupied 13,110 36.3% 13,396 36.0%<br />
Renter Occupied 22,992 63.7% 23,421 64.0%<br />
Owner Vacancy Rate 1.5% 1.5%<br />
Renter Vacancy Rate 7.1% 3.5%<br />
SOURCES: U.S. Census 1990, 2000<br />
The vacancy rate measures the overall housing availability in a community and is <strong>of</strong>ten a<br />
good indicator <strong>of</strong> how for-sale and rental housing units are meeting the current demand<br />
for housing. Vacancy rates <strong>of</strong> five percent for rental housing and two percent for<br />
ownership housing are generally considered healthy. A higher vacancy rate may indicate<br />
an excess supply <strong>of</strong> units, while a low vacancy rate may indicate that households are<br />
having difficulty in finding housing. Low vacancy rates tend to drive up the prices,<br />
leading to other problems such as housing cost burden and/or overcrowding.<br />
The 2000 Census indicates a homeowner vacancy rate <strong>of</strong> 1.5 percent and rental vacancy<br />
rate <strong>of</strong> 3.5 percent, a decline in vacant rental units since 1990, which was 7.2 percent. This<br />
declining vacancy rate is indicative <strong>of</strong> the competitive housing market in Southern<br />
California. 1<br />
1 <strong>City</strong> <strong>of</strong> <strong>Inglewood</strong>, 2000. Housing Element, <strong>Inglewood</strong> <strong>General</strong> <strong>Plan</strong><br />
2.2-2<br />
<strong>City</strong> <strong>of</strong> <strong>Inglewood</strong> <strong>General</strong> <strong>Plan</strong> <strong>Update</strong> Technical Background Report
2.2 Housing<br />
Age and Condition <strong>of</strong> Housing Stock<br />
Housing age is frequently used as an indicator <strong>of</strong> the type <strong>of</strong> housing condition. Most<br />
residential structures over 30 years <strong>of</strong> age will require minor repair and modernization<br />
improvements, while units over 50 years <strong>of</strong> age are more likely to require major<br />
rehabilitation such as ro<strong>of</strong>ing, plumbing, and electrical system repairs. A unit is generally<br />
deemed to have exceeded its useful life after 70 years <strong>of</strong> age. A notable exception is<br />
housing in the northeastern end <strong>of</strong> the <strong>City</strong> above Manchester Avenue. Despite the age <strong>of</strong><br />
the structures, the original quality <strong>of</strong> construction and subsequent property maintenance<br />
has resulted in relatively little structural deterioration. 1<br />
The <strong>City</strong> <strong>of</strong> <strong>Inglewood</strong> has a relatively old housing stock compared with other South Bay<br />
communities, with 30 percent <strong>of</strong> all units built prior to 1950. Figure 2.2-1 compares the<br />
age <strong>of</strong> <strong>Inglewood</strong>’s housing stock with Los Angeles County. The relatively older age <strong>of</strong><br />
housing stock indicates that a significant number <strong>of</strong> units are in need <strong>of</strong> major repairs.<br />
According to the Consolidated <strong>Plan</strong>, approximately 4,000 <strong>of</strong> the community’s housing<br />
units are identified as substandard in deteriorating or unsound conditions. A majority <strong>of</strong><br />
these units are suitable for rehabilitation. The <strong>City</strong>’s Property Maintenance Division<br />
identified only 15 units as substandard and in need <strong>of</strong> replacement.<br />
Percent <strong>of</strong> Total Housing Stock<br />
<strong>City</strong><br />
County<br />
1990 to<br />
March<br />
2000<br />
1980 to<br />
1989<br />
1970 to<br />
1979<br />
1960 to<br />
1969<br />
Year Structure Built<br />
1950 to<br />
1959<br />
1940 to<br />
1949<br />
1939 or<br />
earlier<br />
Figure 2.2-1 Age <strong>of</strong> Housing Stock: <strong>Inglewood</strong> and Los Angeles County, 2000<br />
SOURCE: U.S. Census 2000<br />
A major constraint to maintaining adequate housing conditions in the <strong>City</strong> is its<br />
geographical proximity to LAX. Many homes are impacted by both direct and indirect<br />
effect <strong>of</strong> aircraft noise. The <strong>City</strong> continues to operate an Airport Noise Mitigation<br />
Program, whereby sound insulation is provided to some homes, while homes where<br />
insulation will not be effective are removed.<br />
1 <strong>City</strong> <strong>of</strong> <strong>Inglewood</strong> 2004-2007 Consolidated <strong>Plan</strong>.<br />
<strong>City</strong> <strong>of</strong> <strong>Inglewood</strong> <strong>General</strong> <strong>Plan</strong> <strong>Update</strong> Technical Background Report<br />
2.2-3
Chapter 2 Community Development<br />
Housing Costs and Affordability<br />
As reported in the <strong>City</strong>’s Consolidated <strong>Plan</strong>, the median price <strong>of</strong> homes and<br />
condominiums in <strong>Inglewood</strong> was $232,000, as <strong>of</strong> May 2004. More recent home resale<br />
activity from Dataquick, in December 2005, reveals that for the five zip codes within<br />
<strong>Inglewood</strong>, the median sale price for a home has substantially increased in the <strong>City</strong>.<br />
As indicated in Table 2.2-4, the median home price for single-family homes ranged from<br />
$448,000 in zip code 90302 within northwestern <strong>Inglewood</strong>, to $505,000 in zip code<br />
90305 within the northeastern portion <strong>of</strong> the community. The price for condominium<br />
units was substantially lower, ranging from a median <strong>of</strong> $313,000 in zip code 90301 to<br />
$384,000 in zip code 90305.<br />
Table 2.2-4 <strong>Inglewood</strong> Home Resale Activity, by Zip Code, 2005<br />
Single Family Homes Condominiums SFR Only<br />
ZIP Code<br />
Sales <strong>of</strong> Single<br />
Family Homes<br />
Price Median<br />
SFR ($1,000)<br />
Price % Chg<br />
from Dec 04<br />
Sales Count<br />
Condos<br />
Price Median<br />
Condos ($1,000)<br />
Price % Chg<br />
from Dec 04<br />
Median Home<br />
Price/ Sq. Ft<br />
90301 13 $458 20.5% 12 $313 27.6% $430<br />
90302 14 $448 9.1% 7 $333 38.8% $444<br />
90303 11 $465 19.2% n/a n/a n/a $394<br />
90304 6 $469 44.2% n/a n/a n/a $376<br />
90305 15 $505 6.3% 12 $384 -1.0% $368<br />
SOURCE: DataQuick, Southern California Home Resale Activity, December 2005<br />
Overall, the average sales price among all <strong>of</strong> the homes sold in <strong>Inglewood</strong> during 2004<br />
and 2005 increased by 20 percent, from $325,000 in 2004, to $390,000 in 2005, as shown<br />
in Table 2.2-5.<br />
Table 2.2-5 <strong>Inglewood</strong> Home Sale Activity, 2004/05<br />
No. Sold Year 2005 Year 2004 % Change Yr-to-Yr<br />
<strong>Inglewood</strong> 905 $390,000 $325,000 20%<br />
SOURCE: DataQuick, California Home Sale Activity by <strong>City</strong>, 2005.<br />
Data on apartment rents in 2004 were compiled within <strong>Inglewood</strong> as part <strong>of</strong> the<br />
Consolidated <strong>Plan</strong>. Data was obtained from advertisements placed on the internet rental<br />
services, and is presented in Table 2.2-6. As shown, rents for one-bedroom units range<br />
from $675 to $900, while two-bedroom rents range from $950 to $1,750. Relatively few<br />
three-bedroom rentals are available in <strong>Inglewood</strong>, ranging from $1,225 to $1,450 per<br />
month.<br />
2.2-4<br />
<strong>City</strong> <strong>of</strong> <strong>Inglewood</strong> <strong>General</strong> <strong>Plan</strong> <strong>Update</strong> Technical Background Report
2.2 Housing<br />
Table 2.2-6<br />
Apartment Rental Rates<br />
Unit Size<br />
Rental Range<br />
Studio $350–$500<br />
1 bedroom $675–$900<br />
2 bedroom $950–$1,750<br />
3 bedroom $1,225–$1,450<br />
SOURCES: www. apartments.com; Yahoo! Real Estate. Compiled by the <strong>City</strong><br />
<strong>of</strong> <strong>Inglewood</strong>, 2004.<br />
Housing affordability can be calculated by comparing the maximum affordable payment<br />
<strong>of</strong> the income groups with the cost <strong>of</strong> housing. The maximum affordable payment is<br />
based on 30 percent <strong>of</strong> gross income spent on housing costs including taxes and utilities,<br />
while the income for each group is based on the percentage <strong>of</strong> the HUD MFI <strong>of</strong> $53,500<br />
for Los Angeles County in 2004. The median family income has since increased to<br />
$55,500 in 2005. 1 Table 2.2-7 illustrates the maximum affordable home and rental price<br />
for households in <strong>Inglewood</strong>.<br />
As the table shows, few housing opportunities within <strong>Inglewood</strong> exist for very low<br />
income households. Low-income households are able to afford many apartment units<br />
and some lower priced homes, while moderate income households can afford a majority<br />
<strong>of</strong> rental units and many low to moderate priced homes. However, a continuing obstacle<br />
to home purchase is the down payment required by most lending institutions, which may<br />
place home purchase out <strong>of</strong> reach for low and moderate income households. 2 This table<br />
was also based on 2004 home prices. As discussed above, prices have significantly<br />
increased in <strong>Inglewood</strong> and the region since 2004, causing the purchase <strong>of</strong> many homes<br />
to be out <strong>of</strong> reach for lower and moderate-income households.<br />
Housing Needs<br />
According to the Department <strong>of</strong> Housing and Urban Development (HUD) standards,<br />
households with housing problems are those households that (1) occupy housing units<br />
with physical defects (lacking complete kitchen or bathroom); (2) live in overcrowded<br />
conditions (more than one person per room); or (3) pay more than 30 percent <strong>of</strong> gross<br />
income for housing costs, including utilities.<br />
Table 2.2-8 shows the prevalence <strong>of</strong> housing problems by the tenure and income <strong>of</strong><br />
households in <strong>Inglewood</strong>. More than half <strong>of</strong> all households suffered from a housing<br />
problem, including 63 percent <strong>of</strong> renters and 42 percent <strong>of</strong> owners. Housing problems<br />
were most prevalent among lower income households, especially among renters.<br />
1 California Department <strong>of</strong> Housing and Community Development, 2005. State Income Limits for 2005.<br />
2 <strong>City</strong> <strong>of</strong> <strong>Inglewood</strong> Consolidated <strong>Plan</strong> 2004-2007<br />
<strong>City</strong> <strong>of</strong> <strong>Inglewood</strong> <strong>General</strong> <strong>Plan</strong> <strong>Update</strong> Technical Background Report<br />
2.2-5
Chapter 2 Community Development<br />
Income Group<br />
Annual<br />
Income<br />
Table 2.2-7<br />
Income Levels Housing Costs Maximum Affordable Price<br />
Affordable<br />
Payment Utilities b<br />
Extremely Low (30% <strong>of</strong> MFI)<br />
One Person $12,500 $313 $50 $150 $20,302 $263<br />
Small Family a $16,050 $401 $80 $200 $21,881 $321<br />
Large Family a $19,300 $483 $100 $250 $23,911 $383<br />
Housing Affordability<br />
Taxes &<br />
Insurance d Home e Rental c Housing Available<br />
No housing available at this price range<br />
Very Low (50% <strong>of</strong> MFI)<br />
One Person $20,850 $521 $50 $150 $57,972 $471 Studios<br />
Small Family a $26,800 $670 $80 $200 $70,379 $590<br />
No adequately sized units<br />
Large Family a $32,150 $804 $100 $250 $81,883 $704<br />
Low (80% <strong>of</strong> MFI)<br />
One Person $33,300 $833 $50 $150 $114,140 $783 Small apartments<br />
Small Family a $42,850 $1,071 $80 $200 $142,787 $991 Small apartments and 1-bedroom condos<br />
Large Family a $51,400 $1,285 $100 $250 $168,728 $1,185 Most apartments and 1- and 2-bedroom condos<br />
Moderate (120% <strong>of</strong> MFI)<br />
One Person $46,250 $1,156 $50 $150 $172,563 $1,106 Most apartments and 1- and 2-bedroom condos<br />
Small Family a $59,500 $1,488 $80 $200 $217,903 $1,408 Most apartments and 1- and 2-bedroom condos, some 3-bedroom condos<br />
Large Family a $71,400 $1,785 $100 $250 $258,957 $1,685<br />
Most apartments and condos, and some small 1- and 2-bedroom homes<br />
(inadequately sized)<br />
SOURCE: Cotton Bridges & Associates (CBA), June 2004<br />
a Small Family=3 persons; Large Families=5 or more persons<br />
b Utility costs for renters assumed at $50/$100/$150 per month<br />
c Monthly affordable rent based on payments <strong>of</strong> no more than 30% <strong>of</strong> household income<br />
d Property taxes and insurance based on averages for the region with adjustments for size <strong>of</strong> homes<br />
e Calculation <strong>of</strong> affordable home sales prices based on a down payment <strong>of</strong> 10%, annual interest rate <strong>of</strong> 6.25%, 30-year mortgage, and monthly payment <strong>of</strong> gross household<br />
income<br />
2.2-6<br />
<strong>City</strong> <strong>of</strong> <strong>Inglewood</strong> <strong>General</strong> <strong>Plan</strong> <strong>Update</strong> Technical Background Report
2.2 Housing<br />
Table 2.2-8<br />
Housing Problems by Tenure and Income<br />
Income Group (% <strong>of</strong> MFI)<br />
Housing Problem & Tenure 0-30% 31-50% 51-80% 81-95% 95%+ Total<br />
Households with any Problem<br />
Renters 84% 93% 75% 37% 23% 63%<br />
Owners 60% 65% 62% 63% 28% 42%<br />
Total 80% 87% 71% 45% 26% 55%<br />
Households with Cost Burden<br />
Renters 81% 82% 53% 18% 4% 48%<br />
Owners 58% 65% 60% 55% 23% 38%<br />
Total 77% 78% 55% 30% 15% 45%<br />
Households with Overcrowding<br />
Renters 30% 40% 34% 18% 17% 28%<br />
Owners 19% 30% 25% 26% 9% 16%<br />
Total 28% 38% 32% 21% 13% 24%<br />
SOURCE: SCAG Existing Need Statement, 1999.<br />
Housing Cost Burden<br />
As shown in Table 2.2-8, housing cost burden among renters is widespread. However, in areas<br />
east <strong>of</strong> Prairie Avenue and south <strong>of</strong> Century Boulevard, housing cost burden among renters<br />
seems to be more prevalent than in other areas. 14<br />
Overcrowding<br />
Overcrowding in residential units is defined as having more than 1.01 persons per room.<br />
Severe overcrowding is defined as having more than 1.51 persons per room. As shown in<br />
Table 2.2-8 above, approximately one-quarter <strong>of</strong> all households lived in overcrowded<br />
conditions in <strong>Inglewood</strong>, with 28 percent <strong>of</strong> the renters and 16 percent <strong>of</strong> the owners<br />
experiencing overcrowding. Renters earning less than 50 percent <strong>of</strong> the Los Angeles County<br />
Median Family Income (MFI) had the highest incidence <strong>of</strong> overcrowding, with 30 percent <strong>of</strong><br />
the extremely low income (0–30 percent <strong>of</strong> MFI) renters and 40 percent <strong>of</strong> the low income<br />
(31–50 percent <strong>of</strong> MFI) renters living in overcrowded conditions.<br />
As shown in Table 2.2-9 below, both overcrowding and severe overcrowding increased<br />
significantly between 1990 and 2000 in both the <strong>City</strong> <strong>of</strong> <strong>Inglewood</strong> and Los Angeles County.<br />
There are two primary factors likely contributing to overcrowding in <strong>Inglewood</strong> 15 :<br />
1. An increase in the number <strong>of</strong> large families residing in units constructed for smallersized<br />
families. This is probably the primary cause and is being exacerbated by the<br />
continuing increase in the number <strong>of</strong> larger households.<br />
14 <strong>Inglewood</strong>, <strong>City</strong> <strong>of</strong>. Consolidated <strong>Plan</strong> 2004-2007.<br />
15 <strong>Inglewood</strong>, <strong>City</strong> <strong>of</strong>. 2005. 2000 Housing Element. December 6.<br />
<strong>City</strong> <strong>of</strong> <strong>Inglewood</strong> <strong>General</strong> <strong>Plan</strong> <strong>Update</strong> Technical Background Report<br />
2.2-7
Chapter 2 Community Development<br />
2. An increase in the number <strong>of</strong> large families who are “doubling-up” caused by the lack<br />
<strong>of</strong> available, affordable housing units. “Doubling-up” refers to two (or more) families<br />
residing in a unit designed for a single family.<br />
Table 2.2-9<br />
Overcrowding<br />
1990 2000 Change % Change<br />
<strong>City</strong> <strong>of</strong> <strong>Inglewood</strong><br />
1.00 or less occupants per room 27,841 26,546 (1,295) -4.7%<br />
1.01 to 1.50 occupants per room 2,871 3,366 495 17.2%<br />
1.51 or more occupants per room 5,390 6,905 1,515 28.1%<br />
Total Units 36,102 36,817 715 2.0%<br />
Overcrowding Units % <strong>of</strong> Total 22.9% 27.9%<br />
Los Angeles County<br />
1.00 or less occupants per room 2,433,804 2,413,405 (20,399) -0.8%<br />
1.01 to 1.50 occupants per room 207,528 249,094 41,566 20.0%<br />
1.51 or more occupants per room 348,220 471,275 123,055 35.3%<br />
Total Units 2,989,552 3,133,774 144,222 4.8%<br />
Overcrowded Units % <strong>of</strong> Total 18.6% 23.0%<br />
SOURCES: Stanley R. H<strong>of</strong>fman Associates, Inc., U.S. Bureau <strong>of</strong> the Census, 1990 and 2000<br />
More than 1.0 occupants per room is defined as an overcrowded condition<br />
Based on the Southern California Association <strong>of</strong> Governments (SCAG) Needs Statement<br />
(1999), the 2000 Housing Element reported an apparent correlation between Census tracts<br />
having higher populations <strong>of</strong> Hispanic residents (who have the highest populations-perhousehold)<br />
and Census tracts with the highest percentage <strong>of</strong> overcrowded units. The Hispanic<br />
population has increased substantially since 1990, and the incidence <strong>of</strong> overcrowding has had<br />
a corresponding increase.<br />
Regional Housing Needs Assessment (RHNA)<br />
Every five to seven years, the Southern California Association <strong>of</strong> Governments (SCAG)<br />
produces the Regional Housing Needs Assessment (RHNA) for southern California. The<br />
purpose <strong>of</strong> the RHNA is to evaluate current housing data and to forecast future housing<br />
needs for all the municipal and county jurisdictions in the area. The intent <strong>of</strong> RHNA is to<br />
balance the distribution <strong>of</strong> various income-level households among the jurisdictions and<br />
specifically to avoid the impact <strong>of</strong> certain communities with a disproportionately large share <strong>of</strong><br />
low income households. The RHNA is not a mandate to construct the full number <strong>of</strong> housing<br />
units assigned to the <strong>City</strong>.<br />
The 1998–2005 RHNA allocation determined that <strong>Inglewood</strong> needs to provide a total <strong>of</strong> 852<br />
new housing units, as shown in Table 2.2-30. Of these units, 534 must be affordable to low,<br />
very low and moderate income households in order to satisfy the <strong>City</strong>’s share <strong>of</strong> regional<br />
housing needs. This would constitute almost 62 percent <strong>of</strong> future housing needs during this<br />
period.<br />
2.2-8<br />
<strong>City</strong> <strong>of</strong> <strong>Inglewood</strong> <strong>General</strong> <strong>Plan</strong> <strong>Update</strong> Technical Background Report
2.2 Housing<br />
Table 2.2-30 RHNA Construction Need and Income Distribution, 1998-2005<br />
Construction Need<br />
Very Low Income<br />
Units<br />
Low Income<br />
Units<br />
Moderate<br />
Income Units<br />
Above Moderate<br />
Income Units Total<br />
Number <strong>of</strong> Dwelling Units Needed<br />
1998-2005<br />
221 141 172 317 852<br />
SOURCE: Draft 2000 Housing Element, <strong>City</strong> <strong>of</strong> <strong>Inglewood</strong><br />
The <strong>City</strong> was very active in its objective to provide new construction, rehabilitation, and<br />
conservation <strong>of</strong> its housing stock over the 2000–2005 planning period. According to<br />
Table 2.2-41 below, the figures for new construction exceed the projection <strong>of</strong> RHNA for all<br />
income groups except the very-low income persons, which fall short by 73 units. The majority<br />
<strong>of</strong> units were constructed on in-fill sites. The rehabilitation figures shown are the total <strong>of</strong> the<br />
housing programs utilizing federal funds aimed at housing and neighborhood preservation.<br />
The Deferred Loan Program, Senior Emergency Grant Program, Code Enforcement Exterior<br />
Façade Improvement Program and Lead Base Paint Removal Programs are intended to<br />
improve the existing housing stock. The conservation figures utilize existing base line and<br />
portable voucher (2,718) and proposed (160) rental subsidy programs, the prospect <strong>of</strong><br />
replacement and conservation housing programs under the <strong>Inglewood</strong> Residential Sound<br />
Insulation program (3,014 units), and actions to maintain the existing housing stock (735<br />
units). Certain actions that could have been considered in the planning period include zoning<br />
code revisions to the M1-L zoned area in the North Lockhaven neighborhood.<br />
Land Availability<br />
<strong>Inglewood</strong> is a fully developed and subdivided <strong>City</strong> virtually lacking any vacant land to<br />
accommodate new subdivisions, nor is there any abutting vacant land that the <strong>City</strong> could<br />
annex. All new residential development will likely occur on the few vacant lots scattered<br />
throughout existing residential neighborhoods or on underutilized residential properties. This<br />
latter situation will <strong>of</strong>fer the greatest potential for new units and will usually occur in the <strong>City</strong>’s<br />
higher-density residential zone where, typically, an older single-family residence will be<br />
replaced with a multiple-unit apartment or condominium complex. 16<br />
16 <strong>Inglewood</strong>, <strong>City</strong> <strong>of</strong>. 2005. 2000 Housing Element.December 6.<br />
<strong>City</strong> <strong>of</strong> <strong>Inglewood</strong> <strong>General</strong> <strong>Plan</strong> <strong>Update</strong> Technical Background Report<br />
2.2-9
Chapter 2 Community Development<br />
Table 2.2-41<br />
Quantified Objectives<br />
Income Category New Construction Rehabilitation Conservation<br />
Very Low-Income<br />
Low-Income<br />
Moderate-Income<br />
Above Moderate<br />
Income<br />
148 UNITS<br />
In-Fill Sites—106<br />
Vacant Sites—0<br />
Approved/Under Construction Sites—<br />
42<br />
529 UNITS<br />
In-Fill Sites—224<br />
Vacant Sites—0<br />
Approved/Under Construction Sites—<br />
305<br />
501 UNITS<br />
In-Fill Sites—334<br />
Vacant Sites—131<br />
Approved/Under Construction Sites—<br />
36<br />
272 UNITS<br />
In-Fill Sites—114<br />
Vacant Sites—145<br />
Approved/Under Construction Sites—<br />
13<br />
490 UNITS<br />
30 Units—INHS Deferred Loans<br />
30 Units—Community Housing Develop. Org. Rehab<br />
250 Units—Code Enforcement Exterior Paint Rehab<br />
50 Units—Code Enforcement façade improvements<br />
80 Units—Lead Based Paint Removal<br />
50 Units—Emergency Grant Improvement INHS<br />
467 UNITS<br />
55 Units—INHS Deferred Loans<br />
25 Units—INHS PRIDE Paint Program<br />
2 Units—CDBG/CHDO Disabled Housing<br />
250 Units—Code Enforcement exterior paint<br />
program<br />
50 Units—Code Enforcement façade improvement<br />
50 Units—Lead Based Paint Removal<br />
35 Units—Grant Improvement INHS<br />
22 UNITS<br />
2 Units—CDBG-CHDO disabled housing<br />
20 Units—Lead Based Paint Removal<br />
_________________<br />
3,010 UNITS<br />
30 Units—CDBG Senior Housing<br />
300 Units—Senior/At Risk Housing<br />
1778 Units—Section 8 Vouchers<br />
1500 Units—RSI home sound<br />
insulation<br />
30 Units—Section 8 Home Acquisition<br />
Vouchers<br />
50 Units—INHS 1 st Time Homebuyers<br />
2,026 UNITS<br />
50 Units—CDBG Senior Housing<br />
125 Units—Senior/At Risk Housing<br />
1100 Units—Section 8 vouchers<br />
14 Units—Redevelopment/Replace<br />
1000 Units—RSI Sound insulation<br />
75 Units—INHS 1 st Time Homebuyers<br />
575 UNITS<br />
500 Units—RSI sound insulation<br />
75 Units—CDBG Senior/At Risk<br />
Housing<br />
__________________<br />
Total Through 2005 1,450 Units 979 Units 5,611 Units<br />
SOURCE: 2000–2005 Housing Element, <strong>City</strong> <strong>of</strong> <strong>Inglewood</strong><br />
2.2-10<br />
<strong>City</strong> <strong>of</strong> <strong>Inglewood</strong> <strong>General</strong> <strong>Plan</strong> <strong>Update</strong> Technical Background Report
2.2 Housing<br />
The zoning classifications <strong>of</strong> land in <strong>Inglewood</strong> do not preclude developers from<br />
constructing additional housing units. Unlike many cities which are predominantly zoned<br />
for single-family dwellings and thereby exclude or limit multiple-unit structures,<br />
<strong>Inglewood</strong>’s R-1 (One-family) zoned properties constitute only about 42 percent <strong>of</strong> all<br />
residentially-zoned land. The remaining 58 percent will permit two or more dwelling units<br />
per lot, and the great majority <strong>of</strong> these properties have not yet been fully utilized to<br />
provide additional housing units.<br />
Affordable Housing Programs/Resources<br />
The <strong>City</strong> <strong>of</strong> <strong>Inglewood</strong> provides a variety <strong>of</strong> housing programs to encourage<br />
development, conservation and maintenance <strong>of</strong> affordable housing, funded through<br />
various local, state, federal and private sources. Following is a brief description <strong>of</strong> some<br />
<strong>of</strong> the most significant housing funding sources used in <strong>Inglewood</strong>:<br />
• Community Development Block Grant (CDBG). The CDBG program is funded<br />
by the federal Department <strong>of</strong> Housing and Urban Development (HUD). Project<br />
priorities include maintaining and upgrading the existing housing stock in the <strong>City</strong><br />
through housing rehabilitation loans and grant programs; increasing the supply <strong>of</strong><br />
affordable housing through new construction, first time homebuyers assistance,<br />
and Section 8 rental assistance. Other activities include developing housing<br />
opportunities for special needs populations, particularly seniors and the disabled;<br />
and providing emergency housing assistance for homeless individuals and families<br />
through a shelter and voucher program, case management, employment services<br />
and transitional housing leading to permanent housing.<br />
• Housing Division <strong>of</strong> <strong>Inglewood</strong>. This Division receives funds from the federal<br />
Department <strong>of</strong> Housing and Urban Development (HUD) to provide Section 8<br />
rental assistance to low-income individuals and families. The Housing Division<br />
administers a range <strong>of</strong> programs and services that are aimed at increasing housing<br />
stability, livability and tenant/landlord responsibility. The Housing Resource Center<br />
is located within the Division and helps tenant and owner organizations increase<br />
their effectiveness in working with tenants, landlords, government <strong>of</strong>ficials,<br />
prospective buyers and sellers. The Tenant-Based Rental Assistance Program is also<br />
managed by this Division, and provides early-intervention, self-sufficiency, and<br />
crisis-intervention for families that are threatened by homelessness.<br />
• Redevelopment Set-Aside Funds. The Redevelopment Agency is instrumental in<br />
the construction, maintenance, preservation, and conservation <strong>of</strong> housing in the<br />
<strong>City</strong> <strong>of</strong> <strong>Inglewood</strong>. California state law requires the Agency to set aside 20 percent<br />
<strong>of</strong> tax increment revenue generated from redevelopment projects to support<br />
activities that increase, improve, or preserve the supply <strong>of</strong> affordable housing.<br />
During fiscal years 2000 through 2004, the Redevelopment Agency rehabilitated<br />
and constructed 114 units using Redevelopment Agency Set-Aside Funds. The<br />
Agency also participated in negotiating construction <strong>of</strong> low to moderate-income<br />
units required to allow an amendment to the Redevelopment <strong>Plan</strong> for a project at<br />
3500 West 90 th Street. The objective during the fiscal year 2005 was to assist an<br />
additional ten households.<br />
<strong>City</strong> <strong>of</strong> <strong>Inglewood</strong> <strong>General</strong> <strong>Plan</strong> <strong>Update</strong> Technical Background Report<br />
2.2-11
Chapter 2 Community Development<br />
• HOME Housing Rehabilitation. The first objective <strong>of</strong> this program is to improve<br />
the quality <strong>of</strong> housing for very low- to moderate-income households in residential<br />
neighborhoods by providing deferred loans, grants and free home exterior paint to<br />
homeowners for housing rehabilitation. The second objective is to implement a<br />
federal mandate requiring lead hazard assessment and abatement on all units built<br />
before 1978 that receive HUD funds for housing rehabilitation.<br />
• First Time Homebuyer Program. This program combines HOME 80 percent<br />
funding with 20 percent Redevelopment Agency Housing Set-Aside funding. The<br />
program objective is to increase the supply <strong>of</strong> affordable housing available in the<br />
community by providing down payment assistance to low- and moderate-income<br />
first time homebuyers. The <strong>City</strong> intends to expand this program to create and fund<br />
an on-going rental rehabilitation program that provides low-interest loans and<br />
grants to very-low and low-income renters to make repairs to residential units.<br />
• <strong>Inglewood</strong> Neighborhood Housing Services (INHS). INHS contracts with the<br />
<strong>Inglewood</strong> Redevelopment Agency to administer the First-Time Homebuyer<br />
Program, and preserve and expand affordable housing through refurbishing<br />
existing housing and developing new housing.<br />
• Community Housing and Development Organization (CHDO). This program<br />
guarantees an increase in the supply <strong>of</strong> affordable housing available in the<br />
community for very-low and low-income residents by encouraging development,<br />
sponsorship or ownership <strong>of</strong> affordable housing by designated CHDOs. The <strong>City</strong><br />
is required to reserve 15 percent <strong>of</strong> the annual HOME allocation for investment in<br />
housing to be developed, sponsored or owned by CHDOs.<br />
• Residential Sound Insulation Program. This program is funded through the Federal<br />
Aviation Administration. It provides sound insulation for residences located<br />
underneath the flight approach to Los Angeles World Airport that has a minimum<br />
noise level <strong>of</strong> 65 decibels.<br />
• Housing Rehabilitation/Home Improvement Programs. These programs are<br />
provided to correct code violations and alleviate any health and safety problems in<br />
the home. Financial assistance is provided in the form <strong>of</strong> deferred loans and grants<br />
to eligible homeowners.<br />
• Emergency Shelter Grant Program. This program provides temporary and<br />
transitional shelter, food, case management, referral services and employment<br />
services to individuals and families without housing. The <strong>City</strong> has selected St.<br />
Margaret’s Center and People Assisting the Homeless (PATH) to provide<br />
emergency shelter services during the 2000–2005 period. PATH is a communitybased<br />
non-pr<strong>of</strong>it housing and homeless assistance provider, which was designated<br />
by the <strong>City</strong> in 2002 as a community housing development organization.<br />
Public and Assisted Housing<br />
The Section 8 Rental Assistance Program is administered by the <strong>Inglewood</strong> Housing<br />
Division, and is a federally-funded program available to low-income persons and families<br />
that meet HUD eligibility criteria. The program provides rent subsidies, on behalf <strong>of</strong> the<br />
low and moderate-income tenants, to the owners and developers <strong>of</strong> private rental housing<br />
within <strong>Inglewood</strong>. The assistance is in the form <strong>of</strong> a certificate or voucher which is issued<br />
2.2-12<br />
<strong>City</strong> <strong>of</strong> <strong>Inglewood</strong> <strong>General</strong> <strong>Plan</strong> <strong>Update</strong> Technical Background Report
2.2 Housing<br />
to an eligible household. As <strong>of</strong> January 1, 2003, there were 2,718 housing units. Among<br />
the vouchers issued, over 91 percent were given to households headed by a female. In<br />
March 1998, 93 percent <strong>of</strong> the units were occupied; the <strong>City</strong> reported 100 percent<br />
occupancy for years 2000 through 2003.<br />
Table 2.2-52 below is an inventory <strong>of</strong> assisted housing developments within the <strong>City</strong>. As<br />
shown in the table, the <strong>City</strong> <strong>of</strong> <strong>Inglewood</strong> has exceeded its regional housing need<br />
allocation for lower-income households overall, and has successfully facilitated<br />
development <strong>of</strong> a variety <strong>of</strong> housing types for all segments <strong>of</strong> the community, including<br />
lower-income households and special needs groups. 17 However, as discussed above, the<br />
<strong>City</strong> still lacks the required number <strong>of</strong> units for very-low-income persons, which have a<br />
need for 221 new units and are currently provided 148 units. Additional housing projects<br />
are underway in the <strong>City</strong>, including the Locust Senior Center/Senior Housing<br />
development, which proposes approximately 20,000 to 30,000 square feet <strong>of</strong> senior<br />
center space and 60 units <strong>of</strong> senior housing.<br />
Table 2.2-52 Assisted Housing Developments, <strong>City</strong> <strong>of</strong> <strong>Inglewood</strong><br />
Property Name Number <strong>of</strong> Units Assisted Units<br />
Eucalyptus Park 93 93<br />
Good Shepherd I 40 39<br />
Homeward Bound-<strong>Inglewood</strong> 4 4<br />
<strong>Inglewood</strong> Meadows 199 199<br />
Market Park Apartments 50 50<br />
Pacific Rim Apartments 40 39<br />
Regency Towers 104 104<br />
Regent Plaza 106 106<br />
Crippled Children Home 40 39<br />
Good Shepherd II 30 29<br />
Kelso Street 18 17<br />
924 Osage Avenue/Senior Housing 91 91<br />
733 South Hindry Avenue/Veteran’s Housing Project 301 301<br />
Total 1,116 1,111<br />
SOURCE:<br />
Housing Element, <strong>Inglewood</strong> <strong>General</strong> <strong>Plan</strong><br />
• Issues<br />
• The <strong>City</strong> is experiencing a decrease in the single-family housing stock due, in part,<br />
to the demolition <strong>of</strong> older single-family homes in multi-family zones replaced by<br />
apartment or condominium development.<br />
• The low percentage <strong>of</strong> home owners is an issue. Only 36 percent <strong>of</strong> <strong>Inglewood</strong><br />
residents were owners in 2000, compared to 48 percent for the County.<br />
17 <strong>City</strong> <strong>of</strong> <strong>Inglewood</strong> Consolidated <strong>Plan</strong> 2004-2007. Adopted July 13, 2004.<br />
<strong>City</strong> <strong>of</strong> <strong>Inglewood</strong> <strong>General</strong> <strong>Plan</strong> <strong>Update</strong> Technical Background Report<br />
2.2-13
Chapter 2 Community Development<br />
• Housing availability in <strong>Inglewood</strong> is an issue. The vacancy rate for rental units<br />
declined dramatically over the last decade, from 7.1 percent in 1990 to 3.5 percent<br />
in 2000.<br />
• <strong>Inglewood</strong>’s housing stock is relatively old, compared to other South Bay<br />
communities. This represents a potential problem since a large number <strong>of</strong> the units<br />
are approaching the latter stages <strong>of</strong> their physical life span, which is generally<br />
associated with a more rapid rate <strong>of</strong> structural deterioration.<br />
• Many homes are impacted by both direct and indirect effect <strong>of</strong> aircraft noise from<br />
LAX, which creates a major constraint to maintaining adequate housing conditions<br />
in the <strong>City</strong>.<br />
• Home prices have significantly increased in <strong>Inglewood</strong> and the region since 2004,<br />
causing the purchase <strong>of</strong> many homes to be out <strong>of</strong> reach for a large portion <strong>of</strong> the<br />
<strong>City</strong>’s residents.<br />
• Overcrowding in the <strong>City</strong> increased substantially between 1990 and 2000, reflecting<br />
an increase in population growth without a relative increase in the number <strong>of</strong><br />
housing units to meet this need. Additionally, overcrowding indicates that there<br />
may be a lack <strong>of</strong> housing that is suitable or affordable.<br />
• References<br />
<strong>Inglewood</strong>, <strong>City</strong> <strong>of</strong>. 2004. Consolidated <strong>Plan</strong> 2004-2007, August 15.<br />
<strong>Inglewood</strong>, <strong>City</strong> <strong>of</strong>. 2005. 2000-2005 Housing Element. December 6.<br />
Southern California Association <strong>of</strong> Governments (SCAG). 1999. Existing Need<br />
Statement.<br />
———. 2004. Regional Transportation <strong>Plan</strong> <strong>Update</strong>.<br />
DataQuick. 2005. Southern California Home Sale Activity. L.A. Times Sunday Edition<br />
Charts. Home Sales Recorded in the Year 2005. December.<br />
———. Data for the Year 2005.<br />
U.S. Department <strong>of</strong> Commerce. U.S. Census Bureau. 1990. United States Census 1990.<br />
———. 2000. United States Census 2000.<br />
California Department <strong>of</strong> Finance. 2005. E-5 <strong>City</strong>/County Population and Housing Estimates,<br />
with Annual percent Change, January 1, 2004 and 2005, May.<br />
———. Historical Census Populations <strong>of</strong> California, State, Counties, Cities, Places, and Towns<br />
1850–2000.<br />
California Department <strong>of</strong> Housing and Community Development, 2005. State Income<br />
Limits for 2005.<br />
Yahoo! Real Estate, 2004. www.apartments.com<br />
2.2-14<br />
<strong>City</strong> <strong>of</strong> <strong>Inglewood</strong> <strong>General</strong> <strong>Plan</strong> <strong>Update</strong> Technical Background Report
2.3 Economic Trends and Conditions<br />
2.3 ECONOMIC TRENDS AND CONDITIONS<br />
The purpose <strong>of</strong> this section is to provide an understanding <strong>of</strong> the existing demographic<br />
and economic conditions and trends in the <strong>City</strong> <strong>of</strong> <strong>Inglewood</strong> and the larger growth<br />
dynamics <strong>of</strong> the surrounding area. This section includes baseline data and trends related<br />
to population, employment, taxable sales and residential and non-residential market<br />
conditions. This section was prepared from a report by Stanley R. H<strong>of</strong>fman Associates,<br />
Inc., which is much more extensive. The full report is found in Appendix A.<br />
The findings <strong>of</strong> this section will provide the framework for preparing economic goals and<br />
policies and facilitate discussion <strong>of</strong> existing and future economic development efforts.<br />
These goals and policies will be developed within the context <strong>of</strong> the <strong>General</strong> <strong>Plan</strong> to<br />
ensure that the <strong>City</strong> is able to maintain a strong economic base and take advantage <strong>of</strong><br />
future employment opportunities. A strong economy not only provides the local workers<br />
with adequate income to afford a high quality <strong>of</strong> life, but it also provides local<br />
government with adequate public revenues to maintain a high quality <strong>of</strong> public services.<br />
The goal is to identify target economic opportunities that are both realistic and<br />
compatible with the <strong>City</strong>’s <strong>General</strong> <strong>Plan</strong> vision. In this context, the growth <strong>of</strong> the <strong>City</strong>’s<br />
economic base will depend on the identification <strong>of</strong> key industries that can be attracted to<br />
the <strong>City</strong> and support a diversified economy. Job types, salary and skill levels, income, land<br />
availability and location, and housing affordability are also important attributes <strong>of</strong> the<br />
economy.<br />
• Existing Conditions<br />
Regional Setting<br />
<strong>Inglewood</strong> is centrally located within the Los Angeles Basin. The <strong>City</strong> <strong>of</strong> <strong>Inglewood</strong> is the<br />
northernmost <strong>City</strong> in the South Bay region <strong>of</strong> Los Angeles County. This region includes<br />
the cities <strong>of</strong> <strong>Inglewood</strong>, El Segundo, Hawthorne, Gardena, Lawndale, Manhattan Beach,<br />
Hermosa Beach, Redondo Beach, Torrance, Carson, Palos Verdes Estates, Lomita,<br />
Rolling Hills, Rolling Hills Estates, and Rancho Palos Verdes. The South Bay also<br />
includes portions <strong>of</strong> the <strong>City</strong> <strong>of</strong> Los Angeles along the Harbor Freeway and<br />
unincorporated parts <strong>of</strong> Los Angeles County. <strong>Inglewood</strong> is bordered by the <strong>City</strong> <strong>of</strong> Los<br />
Angeles to the north and east, Hawthorne to the south, and LAX to the west. The <strong>City</strong> is<br />
adjacent to Los Angeles International Airport (LAX) and also about 15 miles from the<br />
Los Angeles/Long Beach Port Complex.<br />
Two freeways directly serve <strong>Inglewood</strong>. The Century (105) Freeway runs from Norwalk<br />
to LAX and is accessible in the southern part <strong>of</strong> the <strong>City</strong>. The San Diego (405) Freeway<br />
runs from southern Orange County through the San Fernando Valley and is accessible in<br />
the western part <strong>of</strong> the <strong>City</strong>. In addition to direct freeway access, <strong>Inglewood</strong> is in close<br />
proximity to the Harbor (110) Freeway, which runs from Pasadena through Downtown<br />
Los Angeles to the Port <strong>of</strong> Los Angeles and the Santa Monica (10) Freeway, which runs<br />
<strong>City</strong> <strong>of</strong> <strong>Inglewood</strong> <strong>General</strong> <strong>Plan</strong> <strong>Update</strong> Technical Background Report<br />
2.3-1
Chapter 2 Community Development<br />
east from the ocean in Santa Monica through Downtown Los Angeles to the Inland<br />
Empire. A regional vicinity map is presented in Figure 1-1 <strong>of</strong> Chapter 1 (Introduction) <strong>of</strong><br />
this TBR<br />
Community Overview<br />
Following is a descriptive pr<strong>of</strong>ile <strong>of</strong> demographic characteristics and trends for the <strong>City</strong><br />
<strong>of</strong> <strong>Inglewood</strong>. This includes population, households, household income, and<br />
employment. In addition, key demographics for the South Bay communities, including<br />
population, households and income are discussed.<br />
Population<br />
Population Growth from 1970 to 2005<br />
• Figure 2.3-1 illustrates the population growth trends for the <strong>City</strong> <strong>of</strong> <strong>Inglewood</strong><br />
from 1970 to 2005; in this period <strong>of</strong> time, the average annualized growth rate was<br />
0.78 percent.<br />
• As shown, modest growth occurred in the period from 1970 to 1980; this increase<br />
from 89,985 in 1970 to 94,162 in 1980 represents an increase in the population <strong>of</strong><br />
4,177, which amounts to an average annualized growth rate <strong>of</strong> 0.46 percent.<br />
• As shown, the most rapid rate <strong>of</strong> growth occurred in the 1980’s when the<br />
population jumped from 94,162 in 1980 to 109,602 in 1990. This increase <strong>of</strong> over<br />
15,000 represents more than a 15 percent increase in the total population and<br />
amounts to an average annualized growth rate <strong>of</strong> 1.53 percent.<br />
• As shown, population growth leveled <strong>of</strong>f considerably in the 1990’s. In this ten year<br />
period, the population increased from 109,602 in 1990 to 112,580 in 2000; this<br />
amounts to an average annualized growth rate <strong>of</strong> only 0.29 percent.<br />
• In the five-year period from 2000 to 2005, <strong>Inglewood</strong>’s population has increased<br />
significantly. As shown, the population increased from 112,580 in 2000 to 118,164<br />
in 2005, a net increase <strong>of</strong> 5,584. This amounts to an average annualized growth rate<br />
<strong>of</strong> 0.97 percent.<br />
• Only about 13.4 percent <strong>of</strong> the housing stock in the <strong>City</strong> was built from 1980 to<br />
2000. In comparison, 19.2 percent <strong>of</strong> the housing stock in the County was built<br />
during this period.<br />
2.3-2<br />
<strong>City</strong> <strong>of</strong> <strong>Inglewood</strong> <strong>General</strong> <strong>Plan</strong> <strong>Update</strong> Technical Background Report
2.3 Economic Trends and Conditions<br />
120,000<br />
118,164<br />
115,000<br />
110,000<br />
109,602<br />
110,900<br />
112,580<br />
105,000<br />
103,500<br />
100,000<br />
95,000<br />
89,900<br />
94,162<br />
90,000<br />
89,985<br />
85,000<br />
80,000<br />
1970 1975 1980 1985 1990 1995 2000 2005<br />
Figure 2.3-1 Population Trends: 1970-2005<br />
SOURCE: Stanley R. H<strong>of</strong>fman Associates, Inc., U.S. Bureau <strong>of</strong> the Census, 1990 and 2000.<br />
Population Growth from 2000 to 2005 in <strong>Inglewood</strong> and the South Bay Cities<br />
• Table 2.3-1 presents the populations for the <strong>City</strong> <strong>of</strong> <strong>Inglewood</strong> and select South<br />
Bay Cities in 1990, 2000, and from 2001 to 2005. The 1990 and 2000 data come<br />
from the decennial census while the 2005 data is provided by the California State<br />
Department <strong>of</strong> Finance.<br />
• Though the population <strong>of</strong> the <strong>City</strong> <strong>of</strong> <strong>Inglewood</strong> went up only slightly in the period<br />
from 1990 to 2000 (2.7 percent), within the five year period from 2000 to 2005, the<br />
<strong>City</strong> <strong>of</strong> <strong>Inglewood</strong>’s population increased by 5.0 percent. Compared to other South<br />
Bay communities, however, <strong>Inglewood</strong>’s population growth has been quite modest.<br />
• The <strong>City</strong> <strong>of</strong> <strong>Inglewood</strong>’s average annual growth rate was also lower than the<br />
average <strong>of</strong> the South Bay Cities, 0.27 percent as compared to 0.63 percent in the<br />
period from 1990 to 2000 and 0.97 as compared to 1.27 in the period from 2000 to<br />
2005.<br />
<strong>City</strong> <strong>of</strong> <strong>Inglewood</strong> <strong>General</strong> <strong>Plan</strong> <strong>Update</strong> Technical Background Report<br />
2.3-3
Chapter 2 Community Development<br />
Table 2.3-1 Population Trends: 1990–2000 and 2000–2005<br />
Annualized<br />
Growth Rate<br />
1990-2000<br />
Annualized<br />
Growth Rate<br />
2000-2005<br />
1990 2000 2005<br />
<strong>Inglewood</strong> 112,602 112,580 118,164 0.27% 0.97%<br />
Carson 83,995 89,730 98,329 0.66% 1.85%<br />
El Segundo 15,223 16,033 17,024 0.52% 1.21%<br />
Gardena 49,847 57,746 61,072 1.48% 1.13%<br />
Hawthorne 71,349 84,112 88,790 1.66% 1.09%<br />
Hermosa Beach 18,219 18,566 19,608 0.19% 1.10%<br />
Lawndale 27,331 31,711 33,458 1.50% 1.08%<br />
Lomita 19,382 20,046 21,153 0.34% 1.08%<br />
Manhattan Beach 32,063 33,852 36,843 0.54% 1.71%<br />
Palos Verdes Estates 13,512 13,340 14,208 -0.13% 1.27%<br />
Rancho Palos Verdes 41,659 41,145 43,525 -0.12% 1.13%<br />
Redondo Beach 60,167 63,261 67,325 0.50% 1.25%<br />
Rolling Hills 1,871 1,871 1,983 0.00% 1.17%<br />
Rolling Hills Estates 7,789 7,676 8,191 -0.15% 1.31%<br />
Torrance 133,107 137,946 147,405 0.36% 1.31%<br />
Total South Bay Cities 685,116 729,615 777,078 0.63% 1.27%<br />
SOURCE: Stanley R. H<strong>of</strong>fman Associates, Inc.<br />
U.S. Bureau <strong>of</strong> the Census, 1990 and 2000<br />
California Department <strong>of</strong> Finance<br />
Households<br />
The following presents the most recent population and demographic estimates for the<br />
<strong>City</strong> <strong>of</strong> <strong>Inglewood</strong>, the South Bay, and Los Angeles County.<br />
• Table 2.3-2 presents the most recent demographic information available as<br />
provided by the California State Department <strong>of</strong> Finance. As shown, as <strong>of</strong> January 1,<br />
2005, The <strong>City</strong> <strong>of</strong> <strong>Inglewood</strong> had an estimated population <strong>of</strong> 118,164. The South<br />
Bay Cities had an estimated population <strong>of</strong> 777,078.<br />
• The <strong>City</strong> <strong>of</strong> <strong>Inglewood</strong> is the second largest incorporated city in the South Bay,<br />
representing about 15 percent <strong>of</strong> the South Bay’s population.<br />
• As shown, <strong>Inglewood</strong> has an average household size <strong>of</strong> 3.22 persons per<br />
household. This is larger than the other South Bay Cities communities with the<br />
exceptions <strong>of</strong> Carson and Lawndale, which have average persons per households <strong>of</strong><br />
3.83 and 3.49, respectively.<br />
• <strong>Inglewood</strong>’s Persons per Household average has increased from 2.91 in 2000 to<br />
3.22 in 2005. Similar increases in average household size have occurred in both the<br />
South Bay Cities and Los Angeles County.<br />
2.3-4<br />
<strong>City</strong> <strong>of</strong> <strong>Inglewood</strong> <strong>General</strong> <strong>Plan</strong> <strong>Update</strong> Technical Background Report
2.3 Economic Trends and Conditions<br />
Table 2.3-2 Demographic Pr<strong>of</strong>ile <strong>of</strong> Market Area: 2000 & 2005<br />
2000 2005<br />
Population Occupied Units<br />
Persons per<br />
Household Population Occupied Units<br />
Persons per<br />
Household<br />
<strong>Inglewood</strong> 112,580 38,648 2.91 118,164 36,724 3.22<br />
Carson 89,730 25,337 3.54 98,329 25,667 3.83<br />
El Segundo 16,033 9,261 2.21 17,024 7,124 2.39<br />
Gardena 57,746 21,041 2.74 61,072 20,437 2.99<br />
Hawthorne 84,112 29,629 2.84 88,790 28,630 3.10<br />
Hermosa Beach 18,566 9,840 1.89 19,608 9,510 2.06<br />
Lawndale 31,711 9,869 3.21 33458 9,580 3.49<br />
Lomita 20,046 8,295 2.42 21,153 8,038 2.63<br />
Manhattan Beach 33,852 15,034 2.25 36,843 14,975 2.46<br />
Palos Verdes Estates 13,340 5,202 2.56 14,208 5,054 2.81<br />
Rancho Palos Verdes 41,145 15,709 2.62 43525 15,344 2.84<br />
Redondo Beach 63,261 29,543 2.14 67,325 28,889 2.33<br />
Rolling Hills 1,871 682 2.74 1,983 650 3.05<br />
Rolling Hills Estates 7,676 2,880 2.67 8,191 2,847 2.88<br />
Torrance 137,946 55,967 2.46 147,405 55,407 2.66<br />
Total South Bay Cities 729,615 274,937 2.65 777,078 268,876 2.89<br />
Los Angeles County 9,519,330 3,270,906 2.91 10,226,506 3,201,352 3.19<br />
SOURCE: Stanley R. H<strong>of</strong>fman Associates, Inc.<br />
California State Department <strong>of</strong> Finance, January 1, 2005<br />
Race and Ethnicity<br />
• As shown in Table 2.3-3 and Figure 2.3-2, the <strong>City</strong>’s racial composition is markedly<br />
different from that <strong>of</strong> Los Angeles County as whole. In 2000, the non-Hispanic<br />
White population comprised only 4.1 percent <strong>of</strong> <strong>Inglewood</strong>’s population, compared<br />
with 31.1 percent in the County.<br />
• In addition, the Black population in <strong>Inglewood</strong> is much greater than that <strong>of</strong> the<br />
County; 46.4 percent <strong>of</strong> <strong>Inglewood</strong>’s population is Black as compared to just<br />
9.5 percent <strong>of</strong> the County as a whole.<br />
• Also, while Asians makeup 11.8 percent <strong>of</strong> the County’s population, they makeup<br />
just 1.1 percent <strong>of</strong> the <strong>City</strong> <strong>of</strong> <strong>Inglewood</strong>’s population.<br />
• Persons <strong>of</strong> Hispanic origin are relatively equally represented in both the <strong>City</strong> and<br />
County. The <strong>City</strong> <strong>of</strong> <strong>Inglewood</strong>’s population is 46.0 percent Hispanic while Los<br />
Angeles County is 44.6 percent Hispanic.<br />
<strong>City</strong> <strong>of</strong> <strong>Inglewood</strong> <strong>General</strong> <strong>Plan</strong> <strong>Update</strong> Technical Background Report<br />
2.3-5
Chapter 2 Community Development<br />
Table 2.3-3 Population by Race and Ethnicity: 2000<br />
Race <strong>Inglewood</strong> % <strong>of</strong> Total Los Angeles County % <strong>of</strong> Total<br />
Non-Hispanic White 4,628 4.1% 2,959,614 31.1%<br />
Hispanic or Latino (<strong>of</strong> any race) 51,829 46.0% 4,242,213 44.6%<br />
African American 52,260 46.4% 901,472 9.5%<br />
Asian 1,217 1.1% 1,124,569 11.8%<br />
Other a 802 0.7% 68,809 0.7%<br />
Two or More Races b 1,844 1.6% 222,661 2.3%<br />
Total 112,580 100.0% 9,519,338 100.0%<br />
SOURCE: Stanley R. H<strong>of</strong>fman Associates, Inc.; U.S. Census Bureau, 2000, P8 Hispanic or Latino by Race<br />
a Other category includes American Indian, Alaska Native alone, Native Hawaiian and Other Pacific Islander<br />
alone, and some other race alone as classified in the 2000 census<br />
b The new Classification system in the 2000 Census includes an additional category for origin <strong>of</strong> two or more<br />
races<br />
Age Distribution <strong>of</strong> Population<br />
• As shown in Table 2.3-4 and Figure 2.3-3, in both <strong>Inglewood</strong> and Los Angeles<br />
County, the age group 35 to 64 is the largest portion <strong>of</strong> the population. This broad<br />
age group is considered to be the most experienced segment <strong>of</strong> the labor force.<br />
• As shown, in both <strong>Inglewood</strong> and Los Angeles County, those under age 18 are<br />
continuing to become an even larger segment <strong>of</strong> the population. This group<br />
consists primarily <strong>of</strong> minors who are not <strong>of</strong> working age. With increased childhood<br />
populations, growing needs for more children and youth services will continue.<br />
• In both <strong>Inglewood</strong> and Los Angeles County, those in the entry level labor force age<br />
group, 18 to 34 years <strong>of</strong> age, have declined significantly from their 1990 levels.<br />
• With respect to those 65 years and over, the proportion <strong>of</strong> the population in this<br />
age group has remained relatively constant in both the <strong>City</strong> <strong>of</strong> <strong>Inglewood</strong> and Los<br />
Angeles County as a whole.<br />
Table 2.3-4 Age Distribution: 1990 and 2000<br />
1990 Percent Distribution 2000 Percent Distribution<br />
<strong>City</strong> <strong>of</strong> <strong>Inglewood</strong><br />
Under 18 Years 329,988 30.1% 36,437 32.4%<br />
18 to 34 Years 36,513 33.3% 29,929 26.6%<br />
35 to 64 Years 32,597 29.7% 38,236 34.0%<br />
65 Years & Over 7,494 6.8% 7,978 7.1%<br />
Total 109,602 100.0% 112,580 100.0%<br />
Median Age 29.1 29.6<br />
Los Angeles County<br />
Under 18 Years 2,326,110 26.2% 2,667,976 28.0%<br />
18 to 34 Years 2,846,835 32.1% 2,562,379 26.9%<br />
35 to 64 Years 2,829,632 31.9% 3,362,310 35.3%<br />
65 Years & Over 860,587 9.7% 926,673 9.7%<br />
Total 8,863,164 100.0% 9,519,338 100.0%<br />
Median Age 30.6 32.0<br />
SOURCE: Stanley R. H<strong>of</strong>fman Associates, Inc.; U.S. Bureau <strong>of</strong> the Census, 1990 and 2000<br />
2.3-6<br />
<strong>City</strong> <strong>of</strong> <strong>Inglewood</strong> <strong>General</strong> <strong>Plan</strong> <strong>Update</strong> Technical Background Report
2.3 Economic Trends and Conditions<br />
<strong>City</strong> <strong>of</strong> <strong>Inglewood</strong><br />
Other, 0.7%<br />
Two or More<br />
Races, 1.6%<br />
Non-Hispanic<br />
Asian, 1.1%<br />
White, 4.1%<br />
African American,<br />
46.4%<br />
Hispanic or Latino<br />
(<strong>of</strong> any race),<br />
46.0%<br />
Los Angeles County<br />
Other, 0.7%<br />
Two or More<br />
Races, 2.3%<br />
African American,<br />
9.5%<br />
Asian, 11.8%<br />
Non-Hispanic<br />
White, 31.1%<br />
Hispanic or Latino<br />
(<strong>of</strong> any race),<br />
44.6%<br />
Figure 2.3-2 Race and Ethnicity: 2000<br />
SOURCE:<br />
Stanley R. H<strong>of</strong>fman Associates, Inc.<br />
U.S. Bureau <strong>of</strong> the Census 1990 and 2000<br />
<strong>City</strong> <strong>of</strong> <strong>Inglewood</strong> <strong>General</strong> <strong>Plan</strong> <strong>Update</strong> Technical Background Report<br />
2.3-7
Chapter 2 Community Development<br />
<strong>City</strong> <strong>of</strong> <strong>Inglewood</strong><br />
40.0%<br />
35.0%<br />
30.0%<br />
32.4%<br />
30.1%<br />
33.3%<br />
26.6%<br />
29.7%<br />
34.0%<br />
25.0%<br />
20.0%<br />
1990<br />
2000<br />
15.0%<br />
10.0%<br />
5.0%<br />
6.8%<br />
7.1%<br />
0.0%<br />
Under 18 Years 18 to 34 Years 35 to 64 Years 65 Years &<br />
Over<br />
Los Angeles County<br />
40.0%<br />
35.0%<br />
30.0%<br />
25.0%<br />
28.0%<br />
26.2%<br />
32.1%<br />
26.9%<br />
31.9%<br />
35.3%<br />
20.0%<br />
1990<br />
2000<br />
15.0%<br />
10.0%<br />
9.7%<br />
9.7%<br />
5.0%<br />
0.0%<br />
Under 18 Years 18 to 34 Years 35 to 64 Years 65 Years &<br />
Over<br />
Figure 2.3-3<br />
Age Distributions in <strong>Inglewood</strong> and Los Angeles County<br />
2.3-8<br />
<strong>City</strong> <strong>of</strong> <strong>Inglewood</strong> <strong>General</strong> <strong>Plan</strong> <strong>Update</strong> Technical Background Report
2.3 Economic Trends and Conditions<br />
Educational Attainment<br />
• As shown in Table 2.3-5 and Figure 2.3-4, the <strong>City</strong>’s population age 25 years and<br />
older has achieved markedly lower levels <strong>of</strong> higher education than those for the<br />
South Bay Cities and Los Angeles County.<br />
• In 2000, about 20.4 percent <strong>of</strong> the population age 25 years and older in <strong>Inglewood</strong><br />
had received an Associate Arts or higher college degree, compared to 31.9 percent<br />
in the South Bay and 31.1 percent in the County.<br />
• About 36.3 percent <strong>of</strong> the adult population in <strong>Inglewood</strong> had not achieved a high<br />
school diploma, compared to 31.2 percent in the South Bay and 30.0 percent in the<br />
County.<br />
• Nearly 80 percent <strong>of</strong> the population <strong>of</strong> <strong>Inglewood</strong> 25 years and older have not<br />
received a college degree, compared to 68.1 percent in the South Bay and<br />
68.8 percent in the County. This has strong implications for the future skills and<br />
training requirements <strong>of</strong> the labor force <strong>of</strong> <strong>Inglewood</strong>.<br />
Table 2.3-5<br />
Educational Attainment <strong>of</strong> Population 25 Years and Older:<br />
2000<br />
Highesst Level <strong>of</strong> Education Attained <strong>Inglewood</strong> % <strong>of</strong> Total<br />
South Bay<br />
Cities % <strong>of</strong> Total<br />
Los Angeles<br />
County % <strong>of</strong> Total<br />
Less than 9 th grade 12,073 18.7% 45,803 7.8% 955,932 16.2%<br />
Less than 12 th grade, no<br />
diploma<br />
11,346 17.6% 13,181 23.4% 814,592 13.8%<br />
High school graduate<br />
(includes equivalency)<br />
12,979 20.1% 120,950 20.5% 1,108,314 18.8%<br />
Some college, no degree 15,021 23.3% 96,826 16.4% 1,174,477 20.0%<br />
Associate’s degree 4,562 7.1% 23,040 3.9% 367,244 6.2%<br />
Bachelor’s degree 5,536 8.6% 147,777 25.0% 945,634 16.1%<br />
Post-graduate degree 3,072 4.8% 17,547 3.0% 516,755 8.8%<br />
Total 64,589 100.0% 590,124 100.0% 5,882,948 100.0%<br />
Associate degree or higher 13,170 20.4% 188,364 31.9% 1,829,633 31.1%<br />
SOURCE: Stanley R. H<strong>of</strong>fman Associates, Inc<br />
U.S. Census Bureau, 2000, P37<br />
<strong>City</strong> <strong>of</strong> <strong>Inglewood</strong> <strong>General</strong> <strong>Plan</strong> <strong>Update</strong> Technical Background Report<br />
2.3-9
Chapter 2 Community Development<br />
90.0%<br />
80.0%<br />
70.0%<br />
79.6%<br />
68.1%<br />
68.9%<br />
60.0%<br />
50.0%<br />
40.0%<br />
30.0%<br />
20.0%<br />
10.0%<br />
20.4%<br />
31.9% 31.1%<br />
0.0%<br />
Below AA<br />
AA or Higher<br />
<strong>Inglewood</strong> South Bay Cities Los Angeles County<br />
Figure 2.3-4 AA Degree and Above in <strong>City</strong> <strong>of</strong> <strong>Inglewood</strong>, South Bay Cities,<br />
and L.A County: 2000<br />
SOURCE: Stanley R. H<strong>of</strong>fman Associates, Inc., U.S. Bureau <strong>of</strong> the Census, 2000.<br />
Labor Force<br />
Distribution by Type <strong>of</strong> Job<br />
• As shown in Table 2.3-6, sales and <strong>of</strong>fice occupations are the largest category <strong>of</strong><br />
the labor force in the <strong>City</strong> <strong>of</strong> <strong>Inglewood</strong> at 30.7 percent. This is slightly higher than<br />
Los Angeles County, which has 27.6 percent <strong>of</strong> the labor force employed in sales<br />
and <strong>of</strong>fice occupations.<br />
• The Management and Pr<strong>of</strong>essional occupations comprised 24.6 percent <strong>of</strong><br />
<strong>Inglewood</strong>’s labor force while 34.3 percent <strong>of</strong> Los Angeles County’s labor force fell<br />
into this category.<br />
• Within <strong>Inglewood</strong>, 20.5 percent <strong>of</strong> the labor force is employed in service<br />
occupations compared with 14.7 percent for Los Angeles County.<br />
• Production and Construction related occupations employ nearly identical<br />
proportions <strong>of</strong> <strong>Inglewood</strong>’s and Los Angeles County’s labor forces.<br />
2.3-10<br />
<strong>City</strong> <strong>of</strong> <strong>Inglewood</strong> <strong>General</strong> <strong>Plan</strong> <strong>Update</strong> Technical Background Report
2.3 Economic Trends and Conditions<br />
Table 2.3-6 Labor Force: 2000<br />
2000 % <strong>of</strong> Total<br />
<strong>City</strong> <strong>of</strong> <strong>Inglewood</strong><br />
Management and Pr<strong>of</strong>essional 10,425 24.6%<br />
Service 8,707 20.5%<br />
Sales and Office 13,027 30.7%<br />
Farming, Fishing and Forestry 84 0.2%<br />
Construction, extraction, and management 3,216 7.6%<br />
Production, Transportation and Material Move 6,916 16.3%<br />
Total 42,375 100.0%<br />
Los Angeles County<br />
Management and Pr<strong>of</strong>essional 1,355,973 34.3%<br />
Service 580,809 14.7%<br />
Sales and Office 1,090,059 27.6%<br />
Farming, Fishing and Forestry 6,650 0.2%<br />
Construction, extraction, and management 306,450 7.8%<br />
Production, Transportation and Material Move 613,474 15.5%<br />
Total 3,953,415 100.0%<br />
SOURCE:<br />
Stanley R. H<strong>of</strong>fman Associates, Inc.<br />
U.S. Bureau <strong>of</strong> the Census, 2000<br />
Comparative Unemployment Rates<br />
• Table 2.3-7 and Figure 2.3-5 shows the unemployment rates for the <strong>City</strong> <strong>of</strong><br />
<strong>Inglewood</strong> in comparison to cities in the South Bay with populations over 25,000,<br />
and Los Angeles County. These cities include Carson, Gardena, Hawthorne,<br />
Lawndale, Manhattan Beach, Rancho Palos Verdes, Redondo Beach, and Torrance.<br />
• As shown, in 2004, the unemployment rate in <strong>Inglewood</strong> was the second highest<br />
among the South Bay Cities at 8.3 percent, compared to 6.6 percent for Los<br />
Angeles County.<br />
• Amongst the South Bay Cities with populations over 25,000, Hawthorne had the<br />
highest rate <strong>of</strong> unemployment at 8.7. In contrast, Manhattan Beach and Rancho<br />
Palos Verdes had the lowest rates <strong>of</strong> unemployment with 2.2 percent each.<br />
• Between 1994 and 2004, all <strong>of</strong> the South Bay Cities shown had substantial<br />
decreases in unemployment rates with the exception <strong>of</strong> Hawthorne, which<br />
remained constant.<br />
• Between 1994 and 2004, <strong>Inglewood</strong>’s unemployment rate dropped by 50.6 percent<br />
from 12.5 percent in 1994 to 8.3 percent in 2004.<br />
<strong>City</strong> <strong>of</strong> <strong>Inglewood</strong> <strong>General</strong> <strong>Plan</strong> <strong>Update</strong> Technical Background Report<br />
2.3-11
Chapter 2 Community Development<br />
Table 2.3-7 Comparative Unemployment Rates: 1994 and 2004<br />
Jurisdictions 1994 2004<br />
1994–2004<br />
Percent Change<br />
South Bay Cities<br />
<strong>Inglewood</strong> 12.5% 8.3% -50.6%<br />
Carson 9.1% 6.6% -37.9%<br />
Gardena 7.5% 6.1% -23.0%<br />
Hawthorne 8.7% 8.7% 0.0%<br />
Lawndale 9.5% 6.5% -46.2%<br />
Manhattan Beach 3.0% 2.2% -36.4%<br />
Rancho Palos Verdes 3.0% 2.2% -36.4%<br />
Redondo Beach 4.3% 3.4% 26.5%<br />
Torrance 5.0% 3.2% -56.3%<br />
Los Angeles County 9.3% 6.6% -40.9%<br />
SOURCE:<br />
Stanley R. H<strong>of</strong>fman Associates, Inc.<br />
Bureau <strong>of</strong> Labor Statistics<br />
10.0%<br />
9.0%<br />
8.0%<br />
7.0%<br />
6.0%<br />
8.7%<br />
8.3%<br />
6.6%<br />
6.5%<br />
6.1%<br />
6.6%<br />
5.0%<br />
4.0%<br />
3.0%<br />
2.0%<br />
3.4%<br />
3.2%<br />
2.2%<br />
2.2%<br />
1.0%<br />
0.0%<br />
Hawthorne<br />
<strong>Inglewood</strong><br />
Carson<br />
Lawndale<br />
Gardena<br />
Redondo Beach<br />
Torrance<br />
Manhattan Beach<br />
Rancho Palos Verdes<br />
Los Angeles County<br />
Figure 2.3-5 Comparative Unemployment Rates: 2004<br />
SOURCE: Stanley R. H<strong>of</strong>fman Associates, Inc.; Bureau <strong>of</strong> Labor Statistics<br />
Household Income<br />
• As shown in Table 2.3-8, in 2000 about 68.4 percent <strong>of</strong> <strong>Inglewood</strong> households<br />
earned below $50,000, compared with 47.7 percent in the South Bay. In Los<br />
Angeles County, an estimated 56.9 percent <strong>of</strong> households earned below $50,000.<br />
2.3-12<br />
<strong>City</strong> <strong>of</strong> <strong>Inglewood</strong> <strong>General</strong> <strong>Plan</strong> <strong>Update</strong> Technical Background Report
2.3 Economic Trends and Conditions<br />
• As shown in Table 2.3-9 and Figure 2.3-6, the average household income in<br />
nominal dollars for the <strong>City</strong> was $44,656 in 2000, significantly lower than the South<br />
Bay and the County.<br />
• As shown, the average household income in constant 2006 dollars for the <strong>City</strong> was<br />
$54,732 in 2000, much lower than the average household incomes <strong>of</strong> the South Bay<br />
cities and the County.<br />
• As shown in constant 2006 dollars, the average household income in the <strong>City</strong><br />
remained relatively flat, actually declining slightly, from 1990 to 2000, compared to<br />
the South Bay and Los Angeles County where average household incomes grew by<br />
about 4.3 and 3.2 percent, respectively.<br />
Table 2.3-8<br />
Distribution <strong>of</strong> Income: 1990–2000 (in nominal dollars)<br />
1990 % <strong>of</strong> Total 2000 % <strong>of</strong> Total<br />
1990–2000<br />
Change in<br />
Households<br />
<strong>Inglewood</strong><br />
Less than $10,000 5,282 14.5% 5,162 14.0% -2.3%<br />
$10,000–24,999 9,578 26.3% 8,048 21.8% -16.0%<br />
$25,000–49,999 13,108 36.0% 11,992 32.6% -8.5%<br />
$50,000–99,999 7,539 20.7% 9,127 24.8% 21.1%<br />
$100,000+ 892 2.5% 2,505 6.8% 180.8%<br />
Total 36,399 100.0% 36,834 100.0% 1.2%<br />
SouthBay Cities<br />
Less than $10,000 21,524 8.4% 19,771 7.4% -8.1%<br />
$10,000–24,999 44,745 17.5% 39,309 14.8% -12.1%<br />
$25,000–49,999 79,862 31.2% 67,618 25.4% -15.3%<br />
$50,000–99,999 80,212 31.4% 83,204 31.3% 3.7%<br />
$100,000+ 29,218 11.4% 55,882 21.0% 91.3%<br />
Total 255,561 100.0% 265,784 100.0% 4.0%<br />
Los Angeles County<br />
Less than $10,000 383,060 12.8% 330,000 10.5% -13.9%<br />
$10,000–24,999 680,398 22.7% 602,111 19.2% -11.5%<br />
$25,000–49,999 953,229 31.8% 853,372 27.2% -10.8%<br />
$50,000–99,999 742,333 24.8% 877,071 28.0% 18.2%<br />
$100,000+ 235,323 7.9% 473,725 15.1% 101.3%<br />
Total 2,994,323 100.0% 3,136,279 100.0% 4.7%<br />
SOURCE: Stanley R. H<strong>of</strong>fman Associates, Inc.<br />
U.S. Census Data, 1990 and 2000<br />
<strong>City</strong> <strong>of</strong> <strong>Inglewood</strong> <strong>General</strong> <strong>Plan</strong> <strong>Update</strong> Technical Background Report<br />
2.3-13
Chapter 2 Community Development<br />
Table 2.3-9<br />
Average Household Income<br />
Description 1990 a 2000 a % Change<br />
<strong>Inglewood</strong> $35,433 $44,656 26.0%<br />
South Bay cities $55,614 $73,477 32.1%<br />
Los Angeles County $47,252 $61,811 30.8%<br />
Description 1990 b 2000 b % Change<br />
<strong>Inglewood</strong> $55,033 $54,732 -0.5%<br />
South Bay cities $86,377 $90,056 4.3%<br />
Los Angeles County $73,390 $75,758 3.2%<br />
SOURCES: Stanley R. H<strong>of</strong>fman Associates, Inc.<br />
U.S. Census Data, 1990 and 2000<br />
a In nominal dollars<br />
b In constant 2006 dollars<br />
$100,000<br />
$90,000<br />
$86,377<br />
$90,056<br />
$80,000<br />
$70,000<br />
$73,390<br />
$75,758<br />
$60,000<br />
$50,000<br />
$55,033<br />
$54,732<br />
$40,000<br />
$30,000<br />
<strong>Inglewood</strong> South Bay Cities Los Angeles County<br />
1990 2000<br />
Figure 2.3-6 Average Annual Household Income: 1990–2000<br />
(in constant 2006 dollars)<br />
SOURCE: Stanley R. H<strong>of</strong>fman Associates, Inc. U.S. Bureau <strong>of</strong> the Census, 1990 and 2000<br />
Projected Population, Household and Employment Growth<br />
• As shown in Table 2.3-10 and Figure 2.3-7, projections provided by the Southern<br />
California Association <strong>of</strong> Governments; (SCAG) Regional Transportation <strong>Plan</strong><br />
(RTP) 2004 suggest that the <strong>City</strong> <strong>of</strong> <strong>Inglewood</strong> will experience modest growth in<br />
population, households, and employment over the period 2000-2030.<br />
2.3-14<br />
<strong>City</strong> <strong>of</strong> <strong>Inglewood</strong> <strong>General</strong> <strong>Plan</strong> <strong>Update</strong> Technical Background Report
2.3 Economic Trends and Conditions<br />
Table 2.3-10<br />
Population, Households and Employment Projections:<br />
2000 to 2030 a 2000–2030<br />
Jurisdiction 2000 2030<br />
Numerical<br />
Change<br />
Average<br />
Annual Change<br />
Percent<br />
Change<br />
<strong>City</strong> <strong>of</strong> <strong>Inglewood</strong><br />
Population 112,580 133,072 20,492 0.56% 18.2%<br />
Households 36,834 44,812 7,978 0.66% 21.7%<br />
Employment b 32,900 37,000 4,100 0.39% 12.5%<br />
Jobs/Household Ratio 0.89 0.83 -0.07 -0.26% 7.6%<br />
South Bay Cities c<br />
Population 729,615 886,020 156,405 0.65% 21.4%<br />
Households 265,784 311,966 46,182 0.54% 17.4%<br />
Employment 394,200 497,491 103,291 0.78% 26.2%<br />
Jobs/Household Ratio 1.48 1.59 0.11 0.24% 7.5%<br />
Los Angeles County<br />
Population 9,519,330 12,096,899 2,577,569 0.80% 27.1%<br />
Households 3,108,889 4,083,459 974,570 0.91% 31.3%<br />
Employment 4,431,307 5,633,695 1,202,388 0.80% 27.1%<br />
Jobs/Household Ratio 1.43 1.38 -0.05 -0.11% -3.2%<br />
SOURCES: Stanley R. H<strong>of</strong>fman Associates, Inc.<br />
Southern California Association <strong>of</strong> Governments (SCAG), RTP 2004<br />
U.S. Bureau <strong>of</strong> the Census, Census2000<br />
Notes:<br />
a All estimates for employment estimates and projections are based on SCAG RTP 2004 projections. Population<br />
and household estimates for the year 2000 are from the U.S. Census 2000.<br />
b Preliminary estimates <strong>of</strong> revision to the SCAG RTP 2004 as provided by SCAG staff in April 2006.<br />
c The South Bay Cities includes the Cities <strong>of</strong> Carson, El Segundo, Gardena, Hawthorne, Hermosa Beach,<br />
<strong>Inglewood</strong>, Lawndale, Lomita, Manhattan Beach, Palos Verdes Estates, Rancho Palos Verdes, Redondo Beach,<br />
Rolling Hills, Rolling Hills Estates, and Torrance<br />
• As shown, population is projected to grow from 112,580 in 2000 (U.S. Census<br />
estimates) to 133,072 in 2030, representing an annual average growth rate <strong>of</strong><br />
0.56 percent.<br />
• Households are expected to grow slightly faster than population at an annual rate<br />
<strong>of</strong> about 0.66 percent.<br />
• Employment in <strong>Inglewood</strong> is projected to increase by nearly 4,100 jobs, according<br />
to preliminary corrections being made to SCAG RTP 2004.<br />
• Employment is projected to increase from about 32,900 jobs in 2000 to an<br />
estimated 37,000 by the year 2030. At an average annual rate <strong>of</strong> 0.39 percent.<br />
• As a result <strong>of</strong> the faster population growth relative to employment growth, the<br />
jobs-housing ratio in <strong>Inglewood</strong> <strong>of</strong> 0.89 in 2000 is expected to decrease slightly to<br />
0.83 in 2030.<br />
<strong>City</strong> <strong>of</strong> <strong>Inglewood</strong> <strong>General</strong> <strong>Plan</strong> <strong>Update</strong> Technical Background Report<br />
2.3-15
Chapter 2 Community Development<br />
40.0%<br />
Percent Change: 2000 to 2030<br />
35.0%<br />
30.0%<br />
25.0%<br />
20.0%<br />
15.0%<br />
10.0%<br />
5.0%<br />
0.0%<br />
26.2%<br />
27.1% 27.1%<br />
21.4%<br />
18.2%<br />
12.5%<br />
<strong>Inglewood</strong> South Bay Los Angeles County<br />
Population<br />
Employment<br />
Figure 2.3-7<br />
Projected Population and Employment Growth: Percent Change<br />
2000 to 2030 1<br />
SOURCE: Stanley R. H<strong>of</strong>fman Associates, Inc. Southern California Association <strong>of</strong> Governments (SCAG), RTP 2004,<br />
U.S. Bureau <strong>of</strong> the Census, 1990 and 2000<br />
South Bay Cities<br />
• As shown in Table 2.3-10, projections for the South Bay Cities are shown to<br />
provide a demographic picture <strong>of</strong> an area more closely related to <strong>Inglewood</strong> than<br />
Los Angeles County as a whole.<br />
• The South Bay Cities’ population and households are projected to increase at<br />
relatively similar average annual rates to the <strong>City</strong> <strong>of</strong> <strong>Inglewood</strong>, 0.65 percent and<br />
0.54 percent, respectively.<br />
• Employment is projected to increase at an annual rate <strong>of</strong> about 0.78 percent and<br />
the number <strong>of</strong> jobs per household is expected to increase from 1.48 in 2000 to 1.59<br />
in 2030.<br />
• It is important to note that the jobs-per-household ratio for the South Bay Cities is,<br />
in 2000, appreciably higher than that <strong>of</strong> <strong>Inglewood</strong>. In addition, the ratio is<br />
projected to continue widening from 2000 to 2030, while <strong>Inglewood</strong> is expected to<br />
increase slightly to 1.38 in 2030.<br />
Los Angeles County<br />
• The County is projected to grow more rapidly than both <strong>Inglewood</strong> and the South<br />
Bay Cities as a whole over this time period, increasing in population at an average<br />
annual rate <strong>of</strong> 0.80 percent, and number <strong>of</strong> households increasing at an annual rate<br />
<strong>of</strong> 0.91 percent.<br />
• The County’s employment is project to increase at an average rate <strong>of</strong> 0.80 percent<br />
annually, about the same as population growth. However, since the number <strong>of</strong><br />
2.3-16<br />
<strong>City</strong> <strong>of</strong> <strong>Inglewood</strong> <strong>General</strong> <strong>Plan</strong> <strong>Update</strong> Technical Background Report
2.3 Economic Trends and Conditions<br />
households is growing more rapidly than employment, the jobs-to-household ratio<br />
is expected to decline marginally over this projection period.<br />
Business Overview<br />
Employment data for the <strong>City</strong> <strong>of</strong> <strong>Inglewood</strong> and Los Angeles County from 1994 to 2004<br />
was provided by the California Economic Development Department (EDD). This<br />
information categorizes employment and payroll data by industry sector. Employment<br />
data is grouped by the North American Industrial Classification System (NAICS) from<br />
2001 to 2004 and the Standard Industrial Classification (SIC) for 1994. The North<br />
American Industry Classification System was developed by representatives from the<br />
United States, Canada, and Mexico, and replaces each country's separate classification<br />
system with one uniform system for classifying industries. In the United States, NAICS<br />
replaces the SIC, a system that federal, state, and local governments, the business<br />
community, and the general public have used since the 1930s.<br />
Almost 70.0 percent <strong>of</strong> the jobs in <strong>Inglewood</strong> were in three sectors; Retail &<br />
Entertainment; Health Care and Other Services; and Government and Local Services. In<br />
contrast, Manufacturing and Transportation only represent about 9.0 percent <strong>of</strong> the jobs.<br />
Overall 1994 to 2004 Employment Trends<br />
• As shown in Table 2.3-11, the <strong>City</strong>’s total employment (including self-employment)<br />
grew marginally from 30,886 in 1994 to 31,127 in 2004, at an annual average<br />
growth rate <strong>of</strong> 0.1 percent.<br />
• In 2004, services formed the largest employment sector in the <strong>City</strong> with nearly<br />
32 percent <strong>of</strong> the total jobs, as shown in Figure 2.3-8.<br />
• Employment in services grew by a total <strong>of</strong> 1.0 percent from 9,814 in 1994 to 9,914<br />
in 2004, at annual average rate <strong>of</strong> 0.1 percent.<br />
• Manufacturing and Retail jobs declined by about 36 percent and 31 percent,<br />
respectively, over the1994 to 2004 time period.<br />
• Wholesale Trade, Finance, Insurance and Real Estate (FIRE), and Construction<br />
declined in the 8 percent to 13 percent range from 1994 to 2004, as shown in<br />
Table 2.3-11.<br />
NAICS Sectoral Employment and Salary Trends: 2001 to 2004<br />
The following presents sectoral trends by NAICS categories from 2001 to 2004 based on<br />
data provided by the California Employment Development Department (EDD). The data<br />
provided included information on employment by sector, number <strong>of</strong> establishments per<br />
sector and payroll and wage trends by sector.<br />
Employment by NAICS 2001 -2004<br />
• Employment data from EDD was adjusted to include estimated self-employment<br />
by NAICS sectors using factors shown in Appendix A (Appendix Table A-2).<br />
<strong>City</strong> <strong>of</strong> <strong>Inglewood</strong> <strong>General</strong> <strong>Plan</strong> <strong>Update</strong> Technical Background Report<br />
2.3-17
Chapter 2 Community Development<br />
Table 2.3-11<br />
<strong>City</strong> <strong>of</strong> <strong>Inglewood</strong> Employment by Sector: 1994 to 2004 a<br />
Sectors b 1994 2004 Percent Change Annual Average Growth Rate<br />
Construction 627 578 -7.8% -0.8%<br />
Farming, Fishing, Forestry, Mining 82 30 -63.4% -9.6%<br />
FIRE 1,326 1,201 -9.4% -1.0%<br />
Government 5,429 4,977 -8.3% -0.9%<br />
Manufacturing 2,867 1,829 -36.2% -4.4%<br />
Retail 4,300 2,957 31.2% -3.7%<br />
Services 9,814 9,914 1.0% 0.1%<br />
Wholesale 1,619 1,410 -12.9% -1.4%<br />
Other c 4,823 8,321 72.5% 5.6%<br />
Total 30,889 31,217 1.1% 0.1%<br />
SOURCE: Stanley R. H<strong>of</strong>fman Associates, Inc.<br />
California Employment Development Department<br />
a Based on SIC for 1994 and NAICS for 2004, as shown in Appendix Table 1.<br />
b Includes estimates for self-employment by sectoral rates as shown in Appendix Table 2.<br />
C Other includes Transportation, Utilities, Warehousing, Non-classified and suppressed data<br />
35.0%<br />
31.8% 31.8%<br />
30.0%<br />
25.0%<br />
1994 2004<br />
20.0%<br />
17.6%<br />
15.0%<br />
15.9%<br />
13.9%<br />
10.0%<br />
9.5%<br />
9.3%<br />
5.0%<br />
0.0%<br />
5.9%<br />
Services Government Retail Manufacturing Wholesale FIRE Construction Farming,<br />
Fishing,<br />
Forestry,<br />
Mining<br />
5.2%<br />
4.5%<br />
4.3%<br />
3.8%<br />
2.0%<br />
1.9%<br />
0.3%<br />
0.1%<br />
Figure 2.3-8<br />
<strong>City</strong> <strong>of</strong> <strong>Inglewood</strong> Comparative Employment Distribution by<br />
Sector: 1994 to 2004<br />
2.3-18<br />
<strong>City</strong> <strong>of</strong> <strong>Inglewood</strong> <strong>General</strong> <strong>Plan</strong> <strong>Update</strong> Technical Background Report
2.3 Economic Trends and Conditions<br />
• The adjusted employment distribution including self-employment from 2001 to<br />
2004 is shown in Table 2.3-12.<br />
• As shown in Table 2.3-12, total employment declined by 6.2 percent from 33,298<br />
in 2001 to 31,217 in 2004, at an annual average rate <strong>of</strong> 2.1 percent.<br />
• Employment declined in all major non-Public Sector categories except Services,<br />
Retail, and Construction.<br />
• Service sector employment grew by 5.4 percent from 9,402 in 2001 to 9,914 in<br />
2004, whereas employment in the Retail sector grew by 2.9 percent from 2,873 in<br />
2001 to 2,957 in 2004.<br />
• Manufacturing declined by 31.9 percent from an estimated 2,685 jobs in 2001 to<br />
1829 jobs in 2004.<br />
• Finance, Insurance and Real Estate (FIRE) declined by 32.2 percent and<br />
Pr<strong>of</strong>essional and Technical Services declined by 45.8 percent.<br />
Table 2.3-12<br />
<strong>City</strong> <strong>of</strong> <strong>Inglewood</strong> Employment by Sector: 2001 to 2004 a<br />
Industrial Categories 2001 2002 2003 2004<br />
2001 to 2004<br />
Percent<br />
Change<br />
2001 to 2004<br />
Annual Average<br />
Growth Rate<br />
Pr<strong>of</strong>essional, Scientific and<br />
Technical<br />
759 674 418 411 -45.8% -18.5%<br />
Finance and Real Estate 1,772 1,475 1,406 1,201 -32.2% -12.2%<br />
Information 295 282 237 259 -12.2% -4.3%<br />
Arts, Entertainment and<br />
Recreation<br />
3,079 2,693 2,590 2,712 -11.9% -4.1%<br />
Services 9,402 10,347 9,734 9,914 5.4% 1.8%<br />
Manufacturing 2,685 2,487 2,244 1,829 -31.9% -12.0%<br />
Retail 2,873 2,762 2,884 2,957 2.9% 1.0%<br />
Wholesale 1,449 1,408 1,437 1,410 -2.7% -0.9%<br />
Government 4,651 5,181 5,079 4,977 7.0% 2.3%<br />
Construction 454 445 523 578 27.4% 8.4%<br />
Transportation<br />
4,099 3,445 3,227 3,344 -18.4% -6.6%<br />
Warehousing<br />
Other 1,780 2,045 1,788 1,626 -8.6% -3.0%<br />
Total 33,298 33,246 31,565 31,217 -6.2% -2.1%<br />
Services<br />
Accommodation and Food<br />
Services<br />
1,963 2,007 2,134 2,209 12.5% 4.0%<br />
Admin Support, Waste<br />
Mgmt<br />
1,203 924 737 998 -17.0% -6.0%<br />
Educational Services 345 374 374 373 8.0% 2.6%<br />
Health Care and Social<br />
Services<br />
4,385 5,588 4,974 4,930 12.4% 4.0%<br />
Other Services 1,506 1,454 1,514 1,404 -6.7% -2.3%<br />
Total 9,402 10,347 9,734 9,914 5.4% 1.8%<br />
SOURCE: Stanley R. H<strong>of</strong>fman Associates, Inc.; California Employment Development Department<br />
a Includes estimates for self-employment by sector not originally provided in the California Employment<br />
Development Department<br />
<strong>City</strong> <strong>of</strong> <strong>Inglewood</strong> <strong>General</strong> <strong>Plan</strong> <strong>Update</strong> Technical Background Report<br />
2.3-19
Chapter 2 Community Development<br />
• Of the service sector categories, as shown in Table 2.3-12, Accommodation and<br />
Food Services, and Health Care and Social Services each grew by 12.5 percent each<br />
from 2001 to 2004, at annual average growth rates <strong>of</strong> 4.0 percent.<br />
• As shown in Figure 2.3-9, in 2004 Health Care and Social Services comprised<br />
nearly 50 percent <strong>of</strong> Services-related employment followed by Accommodation and<br />
Food Services at 22.3 percent.<br />
60.0%<br />
50.0%<br />
49.7%<br />
40.0%<br />
30.0%<br />
22.3%<br />
20.0%<br />
14.2%<br />
10.0%<br />
10.1%<br />
3.8%<br />
0.0%<br />
Health Care and Social<br />
Services<br />
Accomodation and<br />
Food Services<br />
Other Services<br />
Admin Support, Waste<br />
Mgmt<br />
Educational Services<br />
Figure 2.3-9<br />
SOURCE:<br />
<strong>City</strong> <strong>of</strong> <strong>Inglewood</strong> Service Sector Categories as Percent <strong>of</strong> Service<br />
Sector Employment: 2004<br />
Stanley R.H<strong>of</strong>fman Associates, Inc., California Employment Development Department (EDD)<br />
Wage and Salary Trends 2001–2004<br />
• Table 2.3-13 shows payroll data, in Constant 2005 dollars, for the <strong>City</strong> <strong>of</strong><br />
<strong>Inglewood</strong> from the EDD for the 2001 to 2004.<br />
• According to the EDD, the <strong>City</strong> <strong>of</strong> <strong>Inglewood</strong> had 1,853 establishments with<br />
28,564 employees in 2004.<br />
• As shown in Table 2.3-13, the annual average salary in the <strong>City</strong> <strong>of</strong> <strong>Inglewood</strong><br />
declined by 4.5 percent in constant 2005 dollars from $42,683 to $40,773 from<br />
2001 to 2004.<br />
• As shown in Figure 2.3-10, in 2004, Arts, Entertainment and Recreation jobs had<br />
the highest average salary <strong>of</strong> $81,424, followed by Government and Manufacturing<br />
jobs at $47,253 and $44,159, respectively.<br />
2.3-20<br />
<strong>City</strong> <strong>of</strong> <strong>Inglewood</strong> <strong>General</strong> <strong>Plan</strong> <strong>Update</strong> Technical Background Report
2.3 Economic Trends and Conditions<br />
Table 2.3-13 Number <strong>of</strong> Establishments, Employment, and Wages: 2001–2004<br />
Establishments Employment Annual Average Salary (Constant 2005)<br />
2001 1004 % Change<br />
Average Growth<br />
Rate (%) 2001 1004 % Change 2001 1004 % Change<br />
Pr<strong>of</strong>essional, Scientific, and Technical 65 67 3.08 1.02 602 326 -45.85 $38,180 $32,634 -14.5<br />
Finance and Real Estate 122 120 -1.64 -0.55 1,571 1,045 -33.48 71355 41,209 -42.2<br />
Information 15 19 26.67 8.20 278 244 -12.23 77,008 55,288 -28.2<br />
Arts, Entertainment, and Recreation 27 31 14.81 4.71 2,433 2,143 -11.92 66,194 81,424 23.0<br />
Services 720 760 5.56 11.82 8,694 9,188 5.68 29,159 31,954 9.6<br />
Manufacturing 90 76 -15.56 -5.48 2,616 1,782 -31.88 41,924 44,153 5.3<br />
Retail 267 265 -0.75 -0.25 2,873 2,957 2.92 27,935 24,062 -13.9<br />
Wholesale 87 97 11.49 3.69 1,363 1,326 -2.71 42,295 36,102 -14.6<br />
Government 11 13 18.18 5.73 4,618 4,916 6.44 46,999 47,253 0.5<br />
Construction 55 62 12.73 4.07 369 470 27.37 36,049 32,115 -10.9<br />
Transportation Warehousing 304 328 7.89 2.57 3,913 3,192 -18.43 39,277 42,526 8.3<br />
Other 12 15 32.61 9.86 1,138 975 -14.28 85,990 49,761 -42.1<br />
Total 1,775 1,853 4.44 1.46 30,468 28,564 -6.25 $42,683 $40,773 -4.5<br />
Services<br />
Accommodation and Food Services 143 160 11.89 3.82 1,868 2,102 12.53 $15,281 $14,549 -4.8<br />
Admin. Support, Waste Mgmt. 73 75 2.74 0.91 1,010 838 -17.03 24,565 24,873 1.3<br />
Educational Services 17 24 41.18 12.18 339 366 7.96 37,176 38,873 4.6<br />
Health Care and Social Services 299 316 5.69 1.86 4,039 4,541 12.43 44,103 42,627 -3.3<br />
Other Services 188 185 -1.6 -053 1,438 3,341 -6.75 23,803 25,630 7.7<br />
Subtotal 720 760 5.56 1.82 8,694 9,188 9.15 $32,013 $31,954 -0.2<br />
SOURCE: Stanley R. H<strong>of</strong>fmann Associates, Inc.<br />
California Employment Development Department (EDD)<br />
<strong>City</strong> <strong>of</strong> <strong>Inglewood</strong> <strong>General</strong> <strong>Plan</strong> <strong>Update</strong> Technical Background Report<br />
2.3-21
Chapter 2 Community Development<br />
• As shown in Figure 2.3-10, average salaries in the Wholesale, Services and Retail<br />
sectors are below the <strong>City</strong> average salaries <strong>of</strong> $40,733. These sectors comprised<br />
nearly 47 percent <strong>of</strong> the total employment in the <strong>City</strong> in 2004.<br />
• As shown in Figure 2.3-11, amongst the Services-related jobs, the average salary in<br />
Health Care and Social Services was the highest at $42,627—slightly higher than<br />
the <strong>City</strong> average. Average salary in the Accommodation and Food Services sector<br />
was the lowest at $14,549.<br />
$90,000<br />
$80,000<br />
$81,424<br />
$70,000<br />
$60,000<br />
$50,000<br />
$40,000<br />
$47,253<br />
$44,153<br />
$42,526<br />
$41,209 $40,773<br />
$36,102<br />
$31,954<br />
$30,000<br />
$24,062<br />
$20,000<br />
$10,000<br />
$0<br />
Arts,<br />
Ente r tainm e nt<br />
and Recreation<br />
Government Manufacturing Transportation<br />
Warehousing<br />
Finance and<br />
Real Estate<br />
Average <strong>City</strong><br />
Wage<br />
Wholesale Services Retail<br />
Figure 2.3-10<br />
SOURCE:<br />
<strong>City</strong> <strong>of</strong> <strong>Inglewood</strong> Average Annual Salary in 8 Largest<br />
Employment Sectors: 2004 (Constant 2005 Dollars)<br />
Stanley R. H<strong>of</strong>fman Associates, Inc., California Employment Development Department.<br />
2.3-22<br />
<strong>City</strong> <strong>of</strong> <strong>Inglewood</strong> <strong>General</strong> <strong>Plan</strong> <strong>Update</strong> Technical Background Report
2.3 Economic Trends and Conditions<br />
$45,000<br />
$40,000<br />
$42,627<br />
$38,873<br />
$35,000<br />
$30,000<br />
$25,000<br />
$25,630<br />
$24,873<br />
$20,000<br />
$15,000<br />
$14,549<br />
$10,000<br />
$5,000<br />
$0<br />
Health Care and<br />
Social Services<br />
Educational Services Other Services Admin Support,<br />
Waste Mgm t<br />
Accomodation and<br />
Food Services<br />
Figure 2.3-11<br />
SOURCE:<br />
<strong>City</strong> <strong>of</strong> <strong>Inglewood</strong> Average Annual Salary in Service Sector<br />
Industries: 2004 (Constant 2005 Dollars)<br />
Stanley R. H<strong>of</strong>fman Associates, Inc., California Employment Development Department.<br />
Distribution <strong>of</strong> Establishments by Sector and Size: 2001 to 2004<br />
• As shown in Table 2.3-14, the number <strong>of</strong> establishments in the <strong>City</strong> grew<br />
marginally by 4.4 percent between 2001 and 2004 from 1,775 in 2001 to 1,853 in<br />
2004.<br />
• Services-related establishments grew by 5.56 percent from 720 in 2001 to 760 in<br />
2004.<br />
• Manufacturing establishments declined by 15.5 percent from 90 in 2001 to 76 in<br />
2004.<br />
• As shown in Figure 2.3-12, in 2004, Transportation and Warehousing comprised<br />
about 18 percent <strong>of</strong> the <strong>City</strong>’s total establishments, followed closely by Health Care<br />
and Social Services establishments at about 17 percent.<br />
• The average number <strong>of</strong> employees per establishment in the <strong>City</strong> across all sectors<br />
declined from 17 in 2001 to 15 in 2004, as shown in Table 2.3-14.<br />
• Employee per establishment in the Pr<strong>of</strong>essional, Scientific and Technical sector<br />
declined by about 48 percent from 9 in 2001 to 5 in 2004.<br />
• Per establishment employment for the Services and Retail sectors remained<br />
constant between 2001 and 2004 at 12 and 11, respectively.<br />
<strong>City</strong> <strong>of</strong> <strong>Inglewood</strong> <strong>General</strong> <strong>Plan</strong> <strong>Update</strong> Technical Background Report<br />
2.3-23
Chapter 2 Community Development<br />
Table 2.3-14<br />
<strong>City</strong> <strong>of</strong> <strong>Inglewood</strong> Distribution <strong>of</strong> Establishments by Sectors:<br />
2001 to 2004<br />
Average Establishment Size<br />
Establishments<br />
(Employees)<br />
2001 2004 % Change 2001 2004 % Change<br />
Pr<strong>of</strong>essional, Scientific, and Technical 65 67 3.08 9 5 -47.5<br />
Finance and Real Estate 122 120 -1.64 13 9 -32.4<br />
Information 15 19 26.67 19 13 -30.7<br />
Arts, Entertainment, and Recreation 27 31 14.81 90 69 -23.3<br />
Services 720 760 5.56 12 12 00.1<br />
Manufacturing 90 76 -15.56 29 23 -19.3<br />
Retail 267 265 -0.75 11 11 3.7<br />
Wholesale 87 97 11.49 16 14 -12.7<br />
Government 11 13 18.18 420 278 -9.9<br />
Construction 55 62 12.73 7 8 13.0<br />
Transportation Warehousing 304 328 7.89 13 10 -24.4<br />
Other 12 15 32.61 99 64 -35.4<br />
Total 1,775 1,853 4.44 17 15 -10.2<br />
Services<br />
Accommodation and Food Services 143 160 11.89 13 13 0.6<br />
Admin. Support, Waste Mgmt. 73 75 2.74 14 11 -19.2<br />
Educational Services 17 24 41.18 20 15 -23.5<br />
Health Care and Social Services 299 316 5.69 14 14 6.4<br />
Other Services 188 185 -1.60 8 7 -5.2<br />
Subtotal 720 760 5.56 12 12 0.1<br />
SOURCE: Stanley R. H<strong>of</strong>fmann Associates, Inc.<br />
California Employment Development Department (EDD)<br />
2.3-24<br />
<strong>City</strong> <strong>of</strong> <strong>Inglewood</strong> <strong>General</strong> <strong>Plan</strong> <strong>Update</strong> Technical Background Report
2.3 Economic Trends and Conditions<br />
20.0%<br />
18.0%<br />
17.7%<br />
17.1%<br />
16.0%<br />
14.0%<br />
14.3%<br />
12.0%<br />
10.0%<br />
8.6%<br />
8.0%<br />
6.5%<br />
6.0%<br />
4.0%<br />
5.2%<br />
4.1%<br />
2.0%<br />
0.0%<br />
Transportation<br />
Warehousing<br />
Health Care and<br />
Social Services<br />
Retail<br />
Accom odation<br />
and Food<br />
Services<br />
Finance and Real<br />
Es tate<br />
Wholesale<br />
Manufacturing<br />
Figure 2.3-12<br />
SOURCE:<br />
<strong>City</strong> <strong>of</strong> <strong>Inglewood</strong> Distribution <strong>of</strong> Establishments by Sectors:<br />
2004<br />
Stanley R. H<strong>of</strong>fman Associates, Inc., California Employment Development Department<br />
Sectoral Clustering in the <strong>City</strong> <strong>of</strong> <strong>Inglewood</strong><br />
• Table 2.3-15 shows the distribution <strong>of</strong> firms by ZIP codes based on data from the<br />
U.S. Census 2003 County Business Patterns. The number <strong>of</strong> establishments in the<br />
County Business Patterns data is about 8 percent higher than the EDD estimates<br />
for 2004.<br />
• As shown Table 2.3-15, the <strong>City</strong> <strong>of</strong> <strong>Inglewood</strong>, as defined by the ZIP codes 90301,<br />
90302, 90303, 90304 and 90305, had a total <strong>of</strong> 1,996 firms in 2003. Establishments<br />
listed under ZIP code 90304 also include those in the <strong>City</strong> <strong>of</strong> Lennox.<br />
• As shown in Figure 2.3-13, nearly 50 percent <strong>of</strong> the firms in the <strong>City</strong> are located in<br />
ZIP code 90301, followed by 16.8 percent in 90302.<br />
• Using the distribution <strong>of</strong> firms by sector within each ZIP code, and comparing this<br />
distribution to the citywide distribution provides a rough estimate <strong>of</strong> concentration<br />
<strong>of</strong> sectors by geography.<br />
• As shown in Table 2.3-16, indexing the distribution <strong>of</strong> firms by sector by ZIP<br />
codes to the <strong>City</strong>-wide sectoral distribution results in locational indices or relative<br />
concentration <strong>of</strong> firms by sector by ZIP code.<br />
• Location <strong>of</strong> Health Care and Social Services firms is 1.8 and 1.3 times higher in<br />
ZIP codes 90305 and 90301, respectively, compared to the average sectoral<br />
distribution in the <strong>City</strong>.<br />
• Manufacturing related firms are around 2.3 times more concentrated in ZIP code<br />
90302 compared to the <strong>City</strong> average.<br />
• Transportation and Warehousing related firms are relatively more concentrated in<br />
ZIP codes 90301 and 90304.<br />
<strong>City</strong> <strong>of</strong> <strong>Inglewood</strong> <strong>General</strong> <strong>Plan</strong> <strong>Update</strong> Technical Background Report<br />
2.3-25
Chapter 2 Community Development<br />
Table 2.3-15 <strong>City</strong> <strong>of</strong> <strong>Inglewood</strong> Distribution <strong>of</strong> Firms by ZIP Codes: 2003<br />
90301 90302 90303 90304 90305 90311 Total<br />
NAICS Categories Qty. % Qty. % Qty. % Qty. % Qty. % Qty. % Qty. %<br />
Forestry, Fishing,<br />
Hunting, and<br />
1 0.1 — — 1 0.4 — — — — — — 2 0.1<br />
Agriculture<br />
Utilities — — — — 1 0.4 — — — — — — 1 0.1<br />
Construction 19 1.9 26 7.7 5 2.0 9 2.9 4 3.3 — — 63 3.2<br />
Manufacturing 37 3.8 33 9.8 5 2.0 8 2.6 2 1.7 — — 85 4.3<br />
Wholesale Trade 58 5.9 31 9.2 13 5.3 14 4.5 4 3.3 — — 120 6.0<br />
Retail Trade 112 11.4 38 111.3 63 25.6 51 16.5 21 17.4 — — 285 14.3<br />
Transportation &<br />
Warehousing<br />
190 19.3 49 14.6 29 11.8 75 24.3 1 0.8 — — 344 17.2<br />
Information 9 0.9 5 1.5 4 1.6 3 1.0 — — — — 21 1.1<br />
Finance & Insurance 32 3.3 9 2.7 13 5.3 2 0.6 3 2.5 1 50.0 60 3.0<br />
Real Estate & Rental<br />
& Leasing<br />
37 3.8 15 4.5 10 4.1 12 3.9 4 3.3 — — 78 3.9<br />
Pr<strong>of</strong>essional, Scientific<br />
& Technical Services<br />
43 4.4 15 4.5 10 4.1 10 3.2 3 2.5 — — 81 4.1<br />
Management <strong>of</strong><br />
Companies &<br />
2 0.2 — — 1 0.4 1 0.3 — — — — 4 0.2<br />
Enterprises<br />
Admin. Support,<br />
Waste Mgmt., 31 3.2 14 4.2 5 2.0 13 4.2 6 5.0 1 50.0 70 3.5<br />
Remediation Services<br />
Educational Services 14 1.4 5 1.5 2 0.8 1 00.3 6 5.0 — — 28 1.4<br />
Health Care And<br />
Social Assistance<br />
216 22.0 33 9.8 30 12.2 18 5.8 37 30.6 — — 334 16.7<br />
Arts, Entertainment &<br />
Recreation<br />
13 1.3 4 1.2 6 2.4 5 1.6 2 1.7 — — 30 1.5<br />
Accommodation &<br />
Food Services<br />
57 5.8 18 5.4 17 6.9 57 18.4 10 8.3 — — 159 8.0<br />
Other Services<br />
(Except Public 107 10.9 36 10.7 28 11.4 29 9.4 17 14.0 — — 217 10.9<br />
Administration<br />
Unclassified<br />
Establishments<br />
4 0.4 5 1.5 3 1.2 1 0.3 1 0.8 — — 14 0.7<br />
Total 982 100 336 100 246 100 309 100 121 100 2 100 1,996 100<br />
% <strong>of</strong> <strong>City</strong> Total 49.2 16.8 12.3 15.5 6.1 0.1 100<br />
SOURCE: U.S. Census Bureau, County Business Patterns, 2003<br />
2.3-26<br />
<strong>City</strong> <strong>of</strong> <strong>Inglewood</strong> <strong>General</strong> <strong>Plan</strong> <strong>Update</strong> Technical Background Report
2.3 Economic Trends and Conditions<br />
Figure 2.3-13 <strong>City</strong> <strong>of</strong> <strong>Inglewood</strong> Sectoral Concentration <strong>of</strong> Establishments by<br />
ZIP Codes: 2003<br />
SOURCE: Stanley R. H<strong>of</strong>fman Associates, Inc., U.S. Census Bureau, County Business Patterns, 2003.<br />
Table 2.3-16 <strong>City</strong> <strong>of</strong> <strong>Inglewood</strong> Locational Index <strong>of</strong> Sectors by ZIP Codes: 2003<br />
NAICS Categories 90301 90302 90303 90304 90305 90311 Total<br />
Forestry, Fishing, Hunting, and Agriculture 1.0 0.0 4.1 0.0 0.0 0.0 1.0<br />
Utilities 0.0 0.0 8.1 0.0 0.0 0.0 1.0<br />
Construction 0.6 2.5 0.6 0.9 1.0 0.0 1.0<br />
Manufacturing 0.9 2.3 0.5 0.6 0.4 0.0 1.0<br />
Wholesale Trade 1.0 1.5 0.9 0.8 0.5 0.0 1.0<br />
Retail Trade 0.8 0.8 1.8 1.2 1.2 0.0 1.0<br />
Transportation & Warehousing 1.1 0.8 0.7 1.4 0.0 0.0 1.0<br />
Information 0.9 1.4 1.5 0.9 0.0 0.0 1.0<br />
Finance & Insurance 1.1 0.9 1.8 0.2 0.8 16.6 1.0<br />
Real Estate & Rental & Leasing 1.0 1.1 1.0 1.0 0.8 0.0 1.0<br />
Pr<strong>of</strong>essional, Scientific & Technical Services 1.1 1.1 1.0 0.8 0.6 0.0 1.0<br />
Management Of Companies & Enterprises 1.0 0.0 2.0 1.6 0.0 0.0 1.0<br />
Admin. Support, Waste Mgt, Remediation Services 0.9 1.2 0.6 1.2 1.4 14.3 1.0<br />
Educational Services 1.0 1.1 0.6 0.2 3.5 0.0 1.0<br />
Health Care And Social Assistance 1.3 0.6 0.7 0.3 1.8 0.0 1.0<br />
Arts, Entertainment & Recreation 0.9 0.8 1.6 1.1 1.1 0.0 1.0<br />
Accommodation & Food Services 0.7 0.7 0.9 2.3 1.0 0.0 1.0<br />
Other Services (Except Public Administration 1.0 1.0 1.0 0.9 1.3 0.0 1.0<br />
Unclassified Establishments 0.6 2.1 1.7 0.5 1.2 0.0 1.0<br />
SOURCE: U.S. Census Bureau, County Business Patterns, 2003<br />
<strong>City</strong> <strong>of</strong> <strong>Inglewood</strong> <strong>General</strong> <strong>Plan</strong> <strong>Update</strong> Technical Background Report<br />
2.3-27
Chapter 2 Community Development<br />
<strong>City</strong> <strong>of</strong> <strong>Inglewood</strong> Compared with the Los Angeles County Economy<br />
• Table 2.3-17 shows the relative specialization <strong>of</strong> <strong>Inglewood</strong> compared to Los<br />
Angles County. This is shown by indexing the employment distribution <strong>of</strong> the <strong>City</strong><br />
<strong>of</strong> <strong>Inglewood</strong> to the County.<br />
• In 2004, <strong>Inglewood</strong> had a 4.4-times higher share <strong>of</strong> employment in the Arts,<br />
Entertainment and Recreation sector compared to the County. This can be<br />
explained by the relatively higher impact <strong>of</strong> the Hollywood Park Race Track and<br />
Casino on the <strong>City</strong>’s employment base.<br />
• The economy <strong>of</strong> <strong>Inglewood</strong> was also relatively more specialized in Transportation<br />
and Warehousing (3.2) and Health Care and Social Services (1.7).<br />
• Employment share in Retail, and Accommodation and Food Services sectors were<br />
comparable to the County-wide shares.<br />
• However, the below–average employment shares in Pr<strong>of</strong>essional, Scientific and<br />
Technical (0.2), Information (0.2), Manufacturing (0.5) and Finance, Insurance and<br />
Real Estate (0.6) indicate sectors for potential future growth in the <strong>City</strong>.<br />
Table 2.3-17<br />
<strong>City</strong> <strong>of</strong> <strong>Inglewood</strong> and Los Angeles County Comparative Sectoral<br />
Specialization by Employment Distribution: 2004<br />
<strong>Inglewood</strong><br />
Los Angeles County Index: LA =<br />
Employment<br />
%<br />
Distribution Employment<br />
%<br />
Distribution<br />
1<br />
<strong>Inglewood</strong><br />
Pr<strong>of</strong>essional, Scientific, and Technical 326 1.1 239,998 5.9 0.2<br />
Finance and Real Estate 1,045 3.7 236,790 5.8 0.6<br />
Information 244 0.9 216,122 5.3 0.2<br />
Arts, Entertainment, and Recreation 2,143 7.5 68,511 1.7 4.4<br />
Services* 9,188 32.2 1,234,624 30.5 1.1<br />
Manufacturing 1,782 6.2 481,790 11.9 0.5<br />
Retail 2,957 10.4 406,540 10.0 1.0<br />
Wholesale 1,326 4.6 215,636 5.3 0.9<br />
Government 4,916 17.2 516,058 12.7 1.4<br />
Construction 470 1.6 140,813 3.5 0.5<br />
Transportation Warehousing 3,192 11.2 142,261 3.5 3.2<br />
Other 975 3.4 150,791 3.7 0.9<br />
Total 28,564 100.0 4,049,934 100.0<br />
* Services<br />
Accommodation and Food Services 2,102 7.4 304,889 7.5 1.0<br />
Admin. Support, Waste Mgmt. 838 2.9 252,292 6.2 0.5<br />
Educational Services 366 1.3 85,117 2.1 0.6<br />
Health Care and Social Services 4,541 15.9 370,424 9.1 1.7<br />
Other Services 1,341 4.7 221,902 5.5 0.9<br />
Subtotal 9,188 32.2 1,234,624 30.5 1.1<br />
SOURCE: Stanley R. H<strong>of</strong>fmann Associates, Inc.<br />
California Employment Development Department (EDD)<br />
2.3-28<br />
<strong>City</strong> <strong>of</strong> <strong>Inglewood</strong> <strong>General</strong> <strong>Plan</strong> <strong>Update</strong> Technical Background Report
2.3 Economic Trends and Conditions<br />
Market Conditions and Trends<br />
<strong>City</strong> <strong>of</strong> <strong>Inglewood</strong> Taxable Sales: 1994 to 2004<br />
As a major municipal <strong>General</strong> Fund revenue source, sales tax is a significant contributor<br />
to the economic vitality <strong>of</strong> the <strong>City</strong>. Taxable sales data as obtained from the California<br />
State Board <strong>of</strong> Equalization show the following trends:<br />
• As shown in Table 2.3-18 and Figure 2.3-14, total taxable sales transactions in the<br />
<strong>City</strong> <strong>of</strong> <strong>Inglewood</strong> have grown from 1994 to 2004, increasing in constant 2005<br />
dollars from about $675.0 million in 1993 to $833.2 million in 2004.<br />
• Taxable Retail sales in the <strong>City</strong> grew annually at an average annual rate <strong>of</strong> 2.6<br />
percent over the period 1994-2004. Taxable non-retail sales grew at less than onesixth<br />
that rate, or about 0.4 percent annually.<br />
• Trends from 1994 to 2004 show that the <strong>City</strong>’s taxable sales consist primarily <strong>of</strong><br />
retail sales, and this share has grown. In 1994, taxable retail sales comprised<br />
77.5 percent <strong>of</strong> the total taxable sales and in 2004 it comprised 81.1 percent <strong>of</strong> the<br />
total taxable sales. This consistent with the decline in manufacturing activity in the<br />
<strong>City</strong> from 1994 to 2004.<br />
Table 2.3-18 <strong>City</strong> <strong>of</strong> <strong>Inglewood</strong> Taxable Sales Trends: 1994 to 2004<br />
(in '000s Constant 2005 Dollars)<br />
Retail Non Retail Total Share <strong>of</strong> Retail<br />
1994 $522,915 $152,058 $674,973 77.5%<br />
1995 479,344 193,972 673,316 71.2%<br />
1996 480,565 199,206 679,771 70.7%<br />
1997 465,249 186,598 651,847 71.4%<br />
1998 438,059 192,426 630,484 69.5%<br />
1999 441,728 201,335 643,062 68.7%<br />
2000 586,583 245,260 831,843 70.5%<br />
2001 610,516 197,260 807,776 75.6%<br />
2002 605,810 170,708 776,518 78.0%<br />
2003 591,870 151,922 743,792 79.6%<br />
2004 $675,549 $157,614 $833,163 81.1%<br />
1994 to 2004 Annual<br />
Average Growth Rate<br />
2.60% 0.40% 2.10%<br />
SOURCE: Stanley R. H<strong>of</strong>fman Associates, Inc.<br />
California State Board <strong>of</strong> Equalization<br />
<strong>City</strong> <strong>of</strong> <strong>Inglewood</strong> <strong>General</strong> <strong>Plan</strong> <strong>Update</strong> Technical Background Report<br />
2.3-29
Chapter 2 Community Development<br />
$900,000<br />
$800,000<br />
$831,843<br />
$776,518<br />
$833,163<br />
$700,000<br />
$600,000<br />
$674,973 $679,771<br />
$630,484<br />
$586,583<br />
$605,810<br />
$675,549<br />
$522,915<br />
$500,000<br />
$400,000<br />
$300,000<br />
$480,565<br />
$438,059<br />
Retail<br />
Non-retail<br />
Total<br />
$200,000<br />
$100,000<br />
$0<br />
1994 1995 1996 1997 1998 1999 2000 2001 2002 2003 2004<br />
Figure 2.3-14 <strong>City</strong> <strong>of</strong> <strong>Inglewood</strong> Taxable Sales Trends: 1994 to 2004 (in ’000s<br />
Constant 2005 Dollars)<br />
SOURCE: Stanley R. H<strong>of</strong>fman Associates, Inc., California State Board <strong>of</strong> Equalization.<br />
<strong>City</strong> <strong>of</strong> <strong>Inglewood</strong> Taxable Retail Sales Trends: 1994 to 2004<br />
• Taxable Retail sales in the <strong>City</strong> <strong>of</strong> <strong>Inglewood</strong> followed a pattern <strong>of</strong> initial decline<br />
from 1994 to1999 and then rose appreciably from 2000 to 2004. These trends can<br />
be explained by stronger sales performance in key retail categories including<br />
<strong>General</strong> Merchandise, Building Materials and Apparel.<br />
• As shown in Table 2.3-19, <strong>General</strong> Merchandise, which is the single largest retail<br />
category in the <strong>City</strong>, initially declined from $135.6 million in 1994 to $109.9 million<br />
in 2000 and then increasing to $159.3 million by 2004 in constant 2005 dollars<br />
• Building Materials and Apparel retail sales followed patterns similar to <strong>General</strong><br />
Merchandise, reaching a high <strong>of</strong> $65.1 million and $25.2 million, respectively.<br />
• The spurt in <strong>General</strong> Merchandise and Apparel retail sales can be attributed to new<br />
big box retail development in the <strong>City</strong>, including the Hollywood Park Marketplace.<br />
Similarly, the growth in Building Materials sales can be attributed to the Home<br />
Depot store opened recently at the same center.<br />
2.3-30<br />
<strong>City</strong> <strong>of</strong> <strong>Inglewood</strong> <strong>General</strong> <strong>Plan</strong> <strong>Update</strong> Technical Background Report
2.3 Economic Trends and Conditions<br />
Table 2.3-19 <strong>City</strong> <strong>of</strong> <strong>Inglewood</strong> Taxable Sales by Retail Category: 1994<br />
and 2004<br />
Taxable Transactions ('000s)<br />
(constant 2005)<br />
PANEL A<br />
1994–2000<br />
% Change<br />
2000–2004<br />
% Change<br />
1994 2000 2004<br />
Apparel Stores $10,864 $10,654 $25,216 -1.90% 136.70%<br />
<strong>General</strong> Merchandise Stores 135,576 109,892 159,289 -18.9% 45.00%<br />
Food Stores 49,697 50,479 44,582 1.6% -11.70%<br />
Eating and Drinking Places 78,016 82,736 86,720 6.1% 4.80%<br />
Home Furnishings 8,460 9,407 8,875 11.2% -5.70%<br />
Buildings Materials 49,454 38,159 65,102 -22.8% 70.60%<br />
Auto Dealers and parts 74,153 68,379 83,234 7.8% 21.70%<br />
Service Stations 59,037 68,939 74,239 16.8% 7.70%<br />
Other Retail 57,658 147,938 158,363 156.6% 7.00%<br />
Total Retail $522,915 $586,583 $705,620 12.2% 20.30%<br />
Non-Retail $201,479 $245,260 $164,630 21.7% -32.90%<br />
Total $724,394 $831,843 $870,250 14.8% 4.60%<br />
DOF Population a 114,179 112,580 117,640<br />
Per Capita Taxable Transactions<br />
(constant 2005)<br />
PANEL B<br />
1994–2000<br />
% Change<br />
2000–2004<br />
% Change<br />
1994 2000 2004<br />
Apparel Stores $95 $95 $214 -0.50% 126.50%<br />
<strong>General</strong> Merchandise Stores 1,187 976 1,354 -17.8% 38.70%<br />
Food Stores 435 448 379 3.0% -15.50%<br />
Eating and Drinking Places 683 735 737 7.6% 0.30%<br />
Home Furnishings 74 84 75 12.8% -9.70%<br />
Buildings Materials 433 339 553 -21.7% 63.30%<br />
Auto Dealers and Parts 649 607 708 -6.5% 16.50%<br />
Service Stations 517 612 631 18.4% 3.10%<br />
Other Retail 505 1,314 1,346 160.2% 2.40%<br />
Total Retail $4,580 $5,210 $5,998 13.8% 15.10%<br />
Non-Retail $1,765 $2,179 $1,399 23.5% -35.80%<br />
Total $6,344 $7,389 $7,398 16.5% 0.10%<br />
SOURCE: Stanley R. H<strong>of</strong>fman Associates, Inc.<br />
California State Board <strong>of</strong> Equalization<br />
California Department <strong>of</strong> Finance, ES-5 Population Projections<br />
Population as reported by the California Department <strong>of</strong> Finance<br />
a Other Retail includes liquor stores and other ancillary stores.<br />
<strong>City</strong> <strong>of</strong> <strong>Inglewood</strong> <strong>General</strong> <strong>Plan</strong> <strong>Update</strong> Technical Background Report<br />
2.3-31
Chapter 2 Community Development<br />
Comparative Taxable Retail Sales<br />
• Figure 2.3-15 and Table 2.3-20 show per capita taxable retail sales in constant 2005<br />
dollars for <strong>Inglewood</strong>, nearby South Bay cities and Los Angeles County in year<br />
2004.<br />
• Per capita taxable retail sales in <strong>Inglewood</strong> were lowest at $5,998 amongst the<br />
largest six cites in the South Bay.<br />
• In comparison, the South Bay cities and Los Angeles County had average per capita<br />
taxable retail sales <strong>of</strong> $8,980 and $8,939, respectively, as shown in Figure 2.3-15.<br />
$25,000<br />
$20,000<br />
$20,916<br />
$15,000<br />
$12,725<br />
$10,000<br />
$11,027<br />
$9,599<br />
$9,256<br />
$8,980<br />
$8,939<br />
$5,998<br />
$5,000<br />
$0<br />
Torrance Carson Redondo<br />
Beach<br />
Hawthorne Gardena <strong>Inglewood</strong> South Bay<br />
Cities<br />
Los<br />
Ange le s<br />
County<br />
Figure 2.3-15<br />
SOURCE:<br />
<strong>City</strong> <strong>of</strong> <strong>Inglewood</strong> and South Bay Cities Per Capita Taxable<br />
Retail Sales: 2004 (in Constant 2005 Dollars)<br />
Stanley R. H<strong>of</strong>fman Associates, Inc. California State Board <strong>of</strong> Equalization.<br />
2.3-32<br />
<strong>City</strong> <strong>of</strong> <strong>Inglewood</strong> <strong>General</strong> <strong>Plan</strong> <strong>Update</strong> Technical Background Report
2.3 Economic Trends and Conditions<br />
Table 2.3-20 South Bay Cities Taxable Retail Sales Trends: 1994 to 2004<br />
(Constant 2005 Dollars)<br />
1994 2000 2004<br />
Annual Average<br />
Growth Rate<br />
1994–2000<br />
Annual Average<br />
Growth Rate<br />
2000–2004<br />
Panel A: Taxable Transactions ('000s)<br />
South Bay Cities<br />
<strong>Inglewood</strong> $522,918 $586,583 $705,620 1.9% 4.7%<br />
Carson 848,882 1,147,070 1,225,912 5.1% 1.7%<br />
El Segundo 211,125 426,402 413,342 12.4% -0.8%<br />
Gardena 470,047 535,719 561,617 2.2% 1.2%<br />
Hawthorne 586,809 595,158 846,813 0.2% 9.2%<br />
Hermosa Beach 147,429 233,235 232,282 7.9% -0.1%<br />
Lawndale 169,288 188,209 201,640 1.8% 1.7%<br />
Lomita 91,292 109,699 111,920 3.1% 0.5%<br />
Manhattan Beach 437,638 538,321 546,324 3.5% 0.4%<br />
Palos Verdes Estate 10,501 13,069 11,630 3.7% -2.9%<br />
Rancho Palos Verdes 60,818 69,599 69,826 2.3% 0.1%<br />
Redondo Beach 730,851 738,454 738,267 0.2% 0.0%<br />
Rolling Hills 974 91 933 -32.7% 79.2%<br />
Rolling Hills Estates 142,164 128,649 127,191 -1.7% -0.3%<br />
Torrance $2,624,838 $3,164,677 $3,059,289 3.2% -0.8%<br />
South Bay Cities Total $7,055,575 $6,741,282 $6,921,075 -0.8% 0.7%<br />
Share <strong>of</strong> <strong>Inglewood</strong> 7.41% 8.70% 10.20% 2.7% 4.0%<br />
Los Angeles County $65,967,009 $82,697,286 $90,346,952 3.8% 2.2%<br />
Panel B: Per Capita Retail Sales ('000s)<br />
<strong>Inglewood</strong> $4,580 $5,210 $5,998 2.2% 3.6%<br />
Carson 9,787 12,784 12,725 4.6% -0.1%<br />
El Segundo 13,408 26,595 24,505 12.1% -2.0%<br />
Gardena 8,676 9,277 9,256 1.1% -0.1%<br />
Hawthorne 7,845 7,076 9,599 -1.7% 7.9%<br />
Hermosa Beach 7,839 12,563 11,878 8.2% -1.4%<br />
Lawndale 5,862 5,935 6,069 0.2% 0.6%<br />
Lomita 4,628 5,472 5,331 2.8% -0.7%<br />
Manhattan Beach 13,166 15,902 14,930 3.2% -1.6%<br />
Palos Verdes Estate 765 980 825 4.2% -4.2%<br />
Rancho Palos Verdes 1,434 1,692 1,617 2.8% -1.1%<br />
Redondo Beach 11,594 11,673 11,027 0.1% -1.4%<br />
Rolling Hills 507 48 476 -32.4% 77.1%<br />
Rolling Hills Estates 17,651 16,760 15,652 -0.9% -1.7%<br />
Torrance 19,101 22,941 20,916 3.1% -2.3%<br />
South Bay Cities Total $9,897 $9,240 $8,980 -1.1% -0.7%<br />
Los Angeles County $7,108 $8,687 $8,939 3.4% 0.7%<br />
SOURCES: Stanley R. H<strong>of</strong>fman Associates, Inc.<br />
California State Board <strong>of</strong> Equalization<br />
California Department <strong>of</strong> Finance, ES-5 Population Projections<br />
<strong>City</strong> <strong>of</strong> <strong>Inglewood</strong> <strong>General</strong> <strong>Plan</strong> <strong>Update</strong> Technical Background Report<br />
2.3-33
Chapter 2 Community Development<br />
<strong>City</strong> <strong>of</strong> <strong>Inglewood</strong> Retail Leakage Analysis<br />
• Table 2.3-21 presents per capita sales in the <strong>City</strong> <strong>of</strong> <strong>Inglewood</strong> as a ratio <strong>of</strong> those in<br />
Los Angeles County in 2004. This is provided as a measure <strong>of</strong> retail leakage from<br />
the <strong>City</strong>’s market area.<br />
• As shown in Table 2.3-21, total per capita retail sales in the <strong>City</strong> <strong>of</strong> <strong>Inglewood</strong> were<br />
approximately 30 percent lower than those in the County <strong>of</strong> Los Angeles.<br />
• Retail categories that performed better than or near par with the County <strong>of</strong> Los<br />
Angeles included <strong>General</strong> Merchandise (1.04) and Other Retail (0.95).<br />
• Retail categories that indicated high levels <strong>of</strong> leakage included Home Furnishings<br />
(0.18), Auto Dealers and Parts (0.37), and Apparel Stores (0.43).<br />
Table 2.3-21<br />
<strong>City</strong> <strong>of</strong> <strong>Inglewood</strong> and County <strong>of</strong> Los Angeles<br />
Comparative Per Capita Taxable Sales: 2004<br />
(Constant 2005 Dollars)<br />
<strong>City</strong> <strong>of</strong> <strong>Inglewood</strong> County <strong>of</strong> Los Angeles Leakage Factor<br />
Apparel Stores $214 $497 0.43<br />
<strong>General</strong> Merchandise Stores 1,354 1,301 1.04<br />
Food Stores 379 436 0.87<br />
Eating and Drinking Places 737 1,244 0.59<br />
Home Furnishings 75 417 0.18<br />
Building Materials 553 817 0.68<br />
Auto Dealers and parts 708 1,899 0.37<br />
Service Stations 631 911 0.69<br />
Other Retail a 1,346 1,417 0.95<br />
Total Retail 5,998 $8,939 0.67<br />
SOURCES: Stanley R. H<strong>of</strong>fman Associates, Inc.<br />
California State Board <strong>of</strong> Equalization<br />
California Department <strong>of</strong> Finance, ES-5 Population Projections<br />
a Includes liquor stores and other ancillary stores.<br />
Retail Market Inventory in the <strong>City</strong> <strong>of</strong> <strong>Inglewood</strong><br />
• Table 2.3-22 presents the retail market inventory for the <strong>City</strong> <strong>of</strong> <strong>Inglewood</strong><br />
compiled from the 2003 Shopping Center Directory and field surveys conducted by<br />
Stanley R. H<strong>of</strong>fman Associates, Inc in April, 2006.<br />
• There are a total <strong>of</strong> 16 shopping centers identified in the <strong>City</strong> <strong>of</strong> <strong>Inglewood</strong>, not<br />
counting strip commercial and downtown commercial along major arterials.<br />
• Retail centers in <strong>Inglewood</strong> have an estimated 1,572,788 square feet <strong>of</strong> retail space.<br />
• The newest retail development within the city is located to the east and south <strong>of</strong><br />
Hollywood Park. The Hollywood Park Marketplace, The Village at Century and the<br />
Costco/Silvercreek Properties (Century Plaza) centers have a total <strong>of</strong> over 800,000<br />
square feet <strong>of</strong> retail space—50 percent <strong>of</strong> the estimated total square footage.<br />
2.3-34<br />
<strong>City</strong> <strong>of</strong> <strong>Inglewood</strong> <strong>General</strong> <strong>Plan</strong> <strong>Update</strong> Technical Background Report
2.3 Economic Trends and Conditions<br />
Shopping Center Name<br />
1. Airport Plaza<br />
2. Century Hawthorne<br />
3. Century Plaza<br />
4. Century Square<br />
5. Crenshaw Imperial<br />
Shopping Center<br />
6. Crenshaw Imperial<br />
Plaza<br />
7. Food 4 Less<br />
8. Hollywood Park<br />
Plaza<br />
9. Hollywood Park<br />
Marketplace<br />
10. <strong>Inglewood</strong> Center<br />
11. La Brea Plaza<br />
12. Manchester Business<br />
Park<br />
13. Manchester Plaza<br />
14. Unnamed Shopping<br />
Center<br />
15. The Village at<br />
Century<br />
Table 2.3-22 <strong>City</strong> <strong>of</strong> <strong>Inglewood</strong> Retail Market Inventory, 2006<br />
Intersection<br />
Northwest corner ISIS and<br />
Manchester—1117 Manchester<br />
Southeast corner <strong>of</strong> Century and<br />
Hawthorne Boulevards<br />
Southeast corner Yukon Ave and<br />
Century Blvd<br />
Southeast corner <strong>of</strong> Century and<br />
Hawthorne Boulevards<br />
Northeast corner Imperial Hwy and<br />
Crenshaw<br />
Southeast corner <strong>of</strong> Imperial Hwy<br />
and Crenshaw<br />
Southwest corner <strong>of</strong> Imperial Hwy<br />
and Crenshaw<br />
Southwest corner <strong>of</strong> Prairie Ave.<br />
and E. Hardy St.<br />
Northeast corner <strong>of</strong> Century and<br />
Yukon<br />
Southeast corner <strong>of</strong> S. Market and<br />
Florence and East Florence<br />
Southeast corner <strong>of</strong> La Brea and<br />
Centinela<br />
North side <strong>of</strong> W. Manchester<br />
between Isis and Hindry<br />
Southwest corner <strong>of</strong> Manchester<br />
and Eucalyptus<br />
North side <strong>of</strong> W. Manchester<br />
between Ash and Oak<br />
South side <strong>of</strong> Century Blvd. east <strong>of</strong><br />
Yukon<br />
Type a /<br />
Year Built Total Sq. Ft. Anchors<br />
N 23,523<br />
N<br />
1985<br />
C<br />
2005<br />
N<br />
1986<br />
C<br />
1958<br />
C<br />
1960<br />
12,407<br />
Anchor Square<br />
Feet<br />
210,000 Costco 150,000<br />
16,309<br />
152,360<br />
215,034<br />
Superior Market<br />
Rite Aid Pharmacy<br />
Sav-on Drugs<br />
RAC Rent-a-Center<br />
U.S. Post Office<br />
40,000<br />
17,000<br />
22,500<br />
5,110<br />
4,800<br />
C 109,014 Food 4 Less 79,101<br />
N 30,212<br />
R<br />
2005<br />
C<br />
1966<br />
435,000<br />
102,276<br />
N 45,100<br />
N 8,352<br />
N 4,516<br />
N 8,519<br />
C<br />
2006<br />
193,000<br />
16. Village Manchester<br />
Southwest corner Manchester and<br />
<strong>Inglewood</strong> Aves<br />
N 7,166<br />
Total 1,572,788<br />
SOURCE: Stanley R. H<strong>of</strong>fman Associates, Inc<br />
Shopping Center Directory-West 2003<br />
National Research Bureau<br />
a C = Community (100,000 to 300,000 sf) N = Neighborhood (30,000 to 100,000 sf)<br />
R = Regional (300,000 to > 1,000,000 sf) SR = Super Regional (> 1,000,000 sf)<br />
Target<br />
Home Depot<br />
Gigante<br />
Staples<br />
Sav-on Drugs<br />
Kragen Auto Parts<br />
Bed, Bath & Beyond<br />
Ross<br />
Marshalls<br />
111,000<br />
130,000<br />
90,000<br />
20,300<br />
25,000<br />
15,000<br />
38,000<br />
33,650<br />
33,600<br />
Retail Market Lease and Vacancy Rates: 2006<br />
• As shown in Table 2.3-23, retail lease rates in the <strong>City</strong> <strong>of</strong> <strong>Inglewood</strong> currently range<br />
from $0.92 - $3.00 per square foot (NNN) depending on location and size <strong>of</strong> retail<br />
space.<br />
<strong>City</strong> <strong>of</strong> <strong>Inglewood</strong> <strong>General</strong> <strong>Plan</strong> <strong>Update</strong> Technical Background Report<br />
2.3-35
Chapter 2 Community Development<br />
• In 2006, the <strong>City</strong> had an estimated total vacancy <strong>of</strong> about 67,363 sq.ft or 4.3<br />
percent <strong>of</strong> the total retail center inventory.<br />
• The largest vacant retail space <strong>of</strong> 40,608 sq.ft was found in the Crenshaw Imperial<br />
Shopping Center.<br />
Table 2.3-23 <strong>City</strong> <strong>of</strong> <strong>Inglewood</strong> Retail Market Lease and Vacancy Rates: 2006<br />
Shopping Center Name/Location Rates/SF/Month NNN a Vacant SF Total SF Vacancy Rate<br />
1 Airport Plaza Not Available 6,422 23,523 27.30%<br />
2 Century Hawthorne Not Available 0 12,407 0.00%<br />
3 Century Plaza Not Available 0 210,000 0.00%<br />
4 Century Square $2.05 0 16,309 0.00%<br />
5<br />
Crenshaw Imperial Shopping<br />
Center<br />
$1.50–$2.25 8,709 152,360 5.70%<br />
6 Crenshaw Imperial Plaza $1.25–$2.25 40,608 215,034 18.90%<br />
7 Food 4 Less Not Available 0 109,014 0.00%<br />
8 Hollywood Park Plaza Not Available 2,702 30,212 8.90%<br />
9 Hollywood Park Marketplace Not Available 0 435,000 0.00%<br />
10 <strong>Inglewood</strong> Center Not Available 6,083 102,276 5.90%<br />
11 La Brea Plaza $1.25–$2.37 2,839 45,100 6.30%<br />
12 Manchester Business Park Not Available 0 8,352 0.00%<br />
13 Manchester Plaza Not Available 0 4,516 0.00%<br />
14 Unnamed Shopping Center Not Available 0 8,519 0.00%<br />
15 The Village at Century b $0.92–$3.00 0 193,000 0.00%<br />
16 Village Manchester Not Available 0 7,166 0.00%<br />
Total 67,363 1,572,788 4.30%<br />
SOURCE: Stanley R. H<strong>of</strong>fman Associates<br />
a Triple net ("NNN") rental rate assumes that tenant pays their share <strong>of</strong> operating expenses, such as property<br />
taxes, utilities and maintenance and insurance<br />
b The Village at Century project has just been completed and businesses are starting to open. Businesses that have<br />
not opened are not included under vacancies<br />
Real Estate Trends<br />
Building Activity<br />
Nonresidential Building Activity<br />
• Table 2.3-24 and Figure 2.3-16 show non-residential building activity trends in the<br />
<strong>City</strong> <strong>of</strong> <strong>Inglewood</strong> from 1994 to 2004 based on the data provided by the<br />
Construction Industry Research Board.<br />
• As shown in constant 2006 dollars, nearly all <strong>of</strong> the building activity permitted in<br />
terms <strong>of</strong> valuation over this time period was commercial, which averaged 99.8<br />
percent <strong>of</strong> the total valuation annually compared to just 0.2 percent for industrial<br />
valuation.<br />
• As shown in Figure 2.3-16, industrial building activity only occurred in 1999 and<br />
the valuation for this industrial building was quite small, only $189,000.<br />
• The valuation for new commercial buildings displayed significant fluctuation over<br />
the 10 year time period. The valuation (in constant 2006 dollars) for new<br />
2.3-36<br />
<strong>City</strong> <strong>of</strong> <strong>Inglewood</strong> <strong>General</strong> <strong>Plan</strong> <strong>Update</strong> Technical Background Report
2.3 Economic Trends and Conditions<br />
commercial buildings ranged from just $612,000 in 1995 to about 28.3 million in<br />
2003.<br />
Table 2.3-24<br />
<strong>City</strong> <strong>of</strong> <strong>Inglewood</strong> Non-Residential Building Permit Valuations:<br />
1994–2004 (in thousands <strong>of</strong> constant 2006 dollars)<br />
Year Commercial % <strong>of</strong> Total Industrial % <strong>of</strong> Total Total Units<br />
1994 $1,963 100.00 $0 0.00 $1,963<br />
1995 612 100.00 0 0.00 612<br />
1996 1,674 100.00 0 0.00 1,674<br />
1997 704 100.00 0 0.00 704<br />
1998 1,994 100.00 0 0.00 1,994<br />
1999 11,572 98.40 189 1.60 11,761<br />
2000 17,855 100.00 0 0.00 17,855<br />
2001 1,370 100.00 0 0.00 1,370<br />
2002 3,659 100.00 0 0.00 3,659<br />
2003 28,331 100.00 0 0.00 28,331<br />
2004 $8,898 100.00 $0 0.00 $8,898<br />
Annual Average $7,148 99.80 $17 0.20 $7,166<br />
SOURCE: Stanley R. H<strong>of</strong>fman Associates, Inc.<br />
Construction Industry Research Board<br />
$30,000<br />
$25,000<br />
$20,000<br />
$15,000<br />
$10,000<br />
$5,000<br />
$0<br />
1994 1995 1996 1997 1998 1999 2000 2001 2002 2003 2004<br />
Commercial<br />
Industrial<br />
Figure 2.3-16 <strong>City</strong> <strong>of</strong> <strong>Inglewood</strong> Non-Residential Building Activity: 1994-2004<br />
(in thousands <strong>of</strong> constant 2006 dollars)<br />
SOURCE: Stanley R. H<strong>of</strong>fman Associates, Inc., Construction Industry Research Board, 2005.<br />
<strong>City</strong> <strong>of</strong> <strong>Inglewood</strong> <strong>General</strong> <strong>Plan</strong> <strong>Update</strong> Technical Background Report<br />
2.3-37
Chapter 2 Community Development<br />
Residential Building Activity<br />
• Table 2.3-25 and Figure 2.3-17 show residential building activity from 1994 to 2004<br />
in the <strong>City</strong> <strong>of</strong> <strong>Inglewood</strong> based on the data provided by the Construction Industry<br />
Research Board. Over this time period, a total <strong>of</strong> 346 housing units were permitted.<br />
Only 37.9 percent <strong>of</strong> total units permitted were single-family residences while 62.1<br />
percent were multi-family units.<br />
• The data indicates that on an average, 31 new residential units were permitted every<br />
year, <strong>of</strong> which 12 were single-family units and 20 were multi-family units. However,<br />
at least 200 more units have been added to the housing stock since 2004.<br />
• As shown in Table 2.3-25, on average from 1994 to 2004, there were more multifamily<br />
units than multi-family units permitted. As shown in Figure 2.3-17, the<br />
permitting <strong>of</strong> new units fluctuated over this period.<br />
Table 2.3-25 <strong>Inglewood</strong> New Residential<br />
Building Activity: 1994 to 2004<br />
(in thousands <strong>of</strong> constant 2006 dollars)<br />
Year Single- Family % <strong>of</strong> Total Multi- Family % <strong>of</strong> Total Total Units<br />
1994 6 100.0 0 0.0 6<br />
1995 9 36.0 16 64.0 25<br />
1996 9 60.0 6 40.0 15<br />
1997 2 5.6 34 94.4 36<br />
1998 6 16.2 31 83.8 37<br />
1999 23 92.0 2 8.0 25<br />
2000 13 59.1 9 40.9 22<br />
2001 3 3.0 97 97.0 100<br />
2002 22 84.6 4 15.4 26<br />
2003 9 42.9 12 57.1 21<br />
2004 29 87.9 4 12.1 33<br />
Total 131 215 346<br />
Annual Average 12 37.9 20 62.1 31<br />
SOURCE:<br />
Stanley R. H<strong>of</strong>fman Associates, Inc.<br />
Construction Industry Research Board<br />
2.3-38<br />
<strong>City</strong> <strong>of</strong> <strong>Inglewood</strong> <strong>General</strong> <strong>Plan</strong> <strong>Update</strong> Technical Background Report
2.3 Economic Trends and Conditions<br />
120<br />
100<br />
80<br />
60<br />
40<br />
20<br />
0<br />
1994 1995 1996 1997 1998 1999 2000 2001 2002 2003 2004<br />
Single- Family<br />
Multi- Family<br />
Figure 2.3-17 <strong>City</strong> <strong>of</strong> <strong>Inglewood</strong> Residential Building Activity: 1995 to 2005<br />
SOURCE: Stanley R. H<strong>of</strong>fman Associates, Inc., Construction Industry Research Board, 2005.<br />
Housing Value<br />
Single Family Residential<br />
• As shown in Table 2.3-26, according to DataQuick the median price <strong>of</strong> a singlefamily<br />
residence sold in the <strong>City</strong> <strong>of</strong> <strong>Inglewood</strong> in February, 2006 was $475,000.<br />
• In comparison, the median price <strong>of</strong> a single-family residence sold in the South Bay<br />
Cities was significantly higher at $795,000, and $525,000 in the County.<br />
• Within the South Bay, the <strong>City</strong> <strong>of</strong> Manhattan Beach had the highest single-family<br />
residence median sales price at $1.95 million.<br />
Condominiums<br />
• As shown in Table 2.3-27, the median price <strong>of</strong> a condominium sold in the <strong>City</strong> <strong>of</strong><br />
<strong>Inglewood</strong> in February, 2006 was around $330,000.<br />
• In comparison, the median condominium sales price in the South Bay Cities was<br />
estimated significantly higher at about $500,000, and in the County at $407,000.<br />
• Within the South Bay, the <strong>City</strong> <strong>of</strong> Hermosa Beach had the highest median sales<br />
price for condominiums at $1.12 million.<br />
<strong>City</strong> <strong>of</strong> <strong>Inglewood</strong> <strong>General</strong> <strong>Plan</strong> <strong>Update</strong> Technical Background Report<br />
2.3-39
Chapter 2 Community Development<br />
Table 2.3-26<br />
<strong>City</strong> <strong>of</strong> <strong>Inglewood</strong>, South Bay Cities, and Los Angeles County<br />
Single-Family Median Sales Price: February 2006<br />
Single-Family Residences<br />
ZIP Code No. Sold Price ('000s) % change a<br />
<strong>Inglewood</strong> 90301 3 $470 17.4<br />
<strong>Inglewood</strong> 90302 8 458 26.2<br />
<strong>Inglewood</strong> 90303 3 450 20.6<br />
<strong>Inglewood</strong> 90304 4 450 47.5<br />
<strong>Inglewood</strong> 90305 3 585 37.6<br />
<strong>Inglewood</strong> Subtotal 21 $475 n/a<br />
Carson 90745 21 $500 17.1<br />
Carson 90746 10 540 22.6<br />
El Segundo 90245 4 920 26.5<br />
Gardena 90247 10 449 16.8<br />
Gardena 90248 2 464 14.1<br />
Gardena 90249 12 510 18.3<br />
Hawthorne 90250 22 538 13.8<br />
Hermosa Beach 90254 4 970 -2.1<br />
Lawndale 90260 8 580 27.8<br />
Lomita 90717 6 549 -1.5<br />
Manhattan Beach 90266 22 1,950 23.8<br />
Palos Verdes Estates b 90274 15 1,375 11.7<br />
Rancho Palos Verdes 90275 11 1,100 14.3<br />
Redondo Beach 90277 10 1,000 23.5<br />
Redondo Beach 90278 17 731 2.0<br />
Torrance 90501 15 555 13.3<br />
Torrance 90502 7 540 25.0<br />
Torrance 90503 13 758 15.8<br />
Torrance 90504 9 615 8.1<br />
Torrance 90505 12 775 3.5<br />
South Bay Cities Total<br />
(including <strong>Inglewood</strong>)<br />
251 $795 n/a<br />
Los Angeles County 4,299 $525 19.3<br />
SOURCE: Stanley R. H<strong>of</strong>fman Associates, Inc.<br />
DataQuick Datanews, February 2006<br />
a Indicates percent change from February 2005.<br />
b Rolling Hills and Rolling Hills Estates fall within ZIP code 90274.<br />
2.3-40<br />
<strong>City</strong> <strong>of</strong> <strong>Inglewood</strong> <strong>General</strong> <strong>Plan</strong> <strong>Update</strong> Technical Background Report
2.3 Economic Trends and Conditions<br />
Table 2.3-27<br />
<strong>City</strong> <strong>of</strong> <strong>Inglewood</strong>, South Bay Cities, and Los Angeles County<br />
Median Value for Condominiums: February 2006<br />
Condominiums<br />
ZIP Code No. Sold Price ('000s) % change a<br />
<strong>Inglewood</strong> 90301 4 $308 21.2<br />
<strong>Inglewood</strong> 90302 10 312 14.5<br />
<strong>Inglewood</strong> 90303 n/a n/a n/a<br />
<strong>Inglewood</strong> 90304 n/a n/a n/a<br />
<strong>Inglewood</strong> 90305 5 385 24.7<br />
<strong>Inglewood</strong> Subtotal 19 $330 n/a<br />
Carson 90745 10 340 55.4<br />
Carson 90746 n/a n/a n/a<br />
El Segundo 90245 6 465 10.3<br />
Gardena 90247 6 390 42.3<br />
Gardena 90248 n/a n/a n/a<br />
Gardena 90249 1 365 52.4<br />
Hawthorne 90250 5 373 49.2<br />
Hermosa Beach 90254 4 1120 39.1<br />
Lawndale 90260 5 370 -17.5<br />
Lomita 90717 3 337 -34.8<br />
Manhattan Beach 90266 3 850 -35.7<br />
Palos Verdes Estates b 90274 n/a n/a n/a<br />
Rancho Palos Verdes 90275 3 583 33.1<br />
Redondo Beach 90277 9 600 -6.1<br />
Redondo Beach 90278 16 655 6.4<br />
Torrance 90501 6 538 26.5<br />
Torrance 90502 6 331 6.9<br />
Torrance 90503 6 675 32.6<br />
Torrance 90504 2 477 9.2<br />
Torrance 90505 6 534 22.1<br />
South Bay Cities Total<br />
(including <strong>Inglewood</strong>)<br />
116 $500 n/a<br />
Los Angeles County 1,107 407 15.6<br />
SOURCES: Stanley R. H<strong>of</strong>fman Associates, Inc.<br />
DataQuick Datanews, February 2006<br />
a Indicates percent change from February 2005.<br />
b Rolling Hills and Rolling Hills Estates fall within the zip code 90274.<br />
<strong>City</strong> <strong>of</strong> <strong>Inglewood</strong> <strong>General</strong> <strong>Plan</strong> <strong>Update</strong> Technical Background Report<br />
2.3-41
Chapter 2 Community Development<br />
Multi-Family Rental Market<br />
• As shown in Figure 2.3-18, according to the 2000 Census, the median monthly<br />
contract rent (in nominal dollars) for the <strong>City</strong> <strong>of</strong> <strong>Inglewood</strong> was $613. This was<br />
slightly lower than the median contract rent for Los Angeles County at $643.<br />
• The median contract rent in 2006 dollars is estimated to be $751 for <strong>Inglewood</strong>,<br />
and $788 for the County.<br />
$900<br />
$800<br />
$751<br />
$788<br />
$700<br />
$600<br />
$613<br />
$643<br />
$500<br />
$400<br />
$300<br />
<strong>Inglewood</strong><br />
Los Angeles<br />
2000 2006<br />
Figure 2.3-18 Comparative Median Contract Rent: 2000 and 2006 1<br />
SOURCE: Stanley R. H<strong>of</strong>fman Associates, Inc.; U.S. Bureau <strong>of</strong> the Census, 2000.<br />
1 The 2006 Median Contract Rent was estimated by inflating the Census 2000 median contract rent using the<br />
Consumer Price Index (CPI) from the Bureau <strong>of</strong> Labor Statistics, or a factor <strong>of</strong> 1.25<br />
• Locational and Economic Opportunities<br />
The following chapter presents the key locational and economic opportunities in the <strong>City</strong><br />
<strong>of</strong> <strong>Inglewood</strong> that could provide impetus to the economy <strong>of</strong> <strong>Inglewood</strong>. These include<br />
opportunities arising from proximity to LAX, tourism and lodging industry, and the<br />
redevelopment <strong>of</strong> the Hollywood Park, the Forum and the Downtown area.<br />
Los Angeles International Airport<br />
• The passenger volume at LAX is projected to increase from just over 60 million air<br />
passengers (MAPs) in 2004 to 78.0 MAP in 2030. Most <strong>of</strong> the additional passenger<br />
volume is projected to be handled by other airports in the region such as Ontario<br />
and Palmdale.<br />
• The air cargo volume at LAX is projected to increase from 2.0 million tons in 2003<br />
to 2.3 million tons in 2030. Most <strong>of</strong> the growth in air cargo is expected to be<br />
handled by other regional airports.<br />
2.3-42<br />
<strong>City</strong> <strong>of</strong> <strong>Inglewood</strong> <strong>General</strong> <strong>Plan</strong> <strong>Update</strong> Technical Background Report
2.3 Economic Trends and Conditions<br />
• The environmental analysis <strong>of</strong> the LAX Master <strong>Plan</strong> 2000 Draft EIS/EIR resulted<br />
in the formulation <strong>of</strong> Alternative D that was presented and evaluated in the 2003<br />
LAX Master <strong>Plan</strong> Addendum and 2003 Supplement to the Draft EIS/EIR.<br />
• Alternative D was a new alternative in response to public comment on Master <strong>Plan</strong><br />
Alternatives A,B,C and the No Action/No Project Alternative.<br />
• Alternative D was developed to <strong>of</strong>fer a regional airport development alternative for<br />
LAX. It would be designed to serve approximately 78 million annual passengers<br />
which is similar to the activity level identified in the scenario adopted by SCAG for<br />
LAX. It would encourage other airports in the region to develop facilities to<br />
accommodate regional demand beyond the level served at LAX.<br />
• Alternative D is intended to respond to increased security threats with the objective<br />
<strong>of</strong> providing a facility that can continue to operate under the highest security levels<br />
with minimal impacts to the passenger processing experience.<br />
• The ground access network would be redeveloped to limit vehicle access to the<br />
central terminal area (CTA) and to remove vehicle parking from the area. The CTA<br />
would be accessed via the Landside Automated People Mover (APM) system.<br />
• Some <strong>of</strong> the other components <strong>of</strong> Alternative D include: four new passenger<br />
terminals, new aircraft rescue and firefighting facilities, parallel taxiways between<br />
the runways on the north and south airfields to reduce the potential for runway<br />
incursions and airfield reconfigurations to provide unrestricted movement for New<br />
Large Aircraft (NLA). Alternative D also includes a new Ground Transportation<br />
Center (GTC) to improve the landside level <strong>of</strong> service at LAX, a Consolidated<br />
Rental Car Facility and an Intermodal Transportation Center.<br />
• The LAX Master <strong>Plan</strong> Stipulated Settlement was approved by Mayor Villaraigosa<br />
and the Los Angeles <strong>City</strong> Council in early 2006 resulting in an historic settlement <strong>of</strong><br />
lawsuits filed against the LAX Master <strong>Plan</strong>. It was also approved by other cities<br />
including the <strong>City</strong> <strong>of</strong> <strong>Inglewood</strong>.<br />
• The settlement allows LAWA to begin construction on the LAX South Airfield<br />
Improvement Project and to develop new plans for LAX consistent with the<br />
Mayor’s vision for the regional redistribution <strong>of</strong> aviation demand.<br />
• The settlement will create a community-based planning process to revisit and<br />
potentially replace controversial “yellow light” projects such as the Manchester<br />
Square Ground Transportation Center.<br />
Tourism and Lodging<br />
• The majority <strong>of</strong> the hotels and motels in <strong>Inglewood</strong> serve tourists and business<br />
travelers from Los Angeles International Airport.<br />
• The hotels and motels are primarily located along Century Boulevard, as well as<br />
Manchester Avenue and the Imperial Highway.<br />
• As shown in Table 2.3-28, the <strong>City</strong> <strong>of</strong> <strong>Inglewood</strong> generated about $1.84 million in<br />
transient occupancy tax revenue for 2002-2003. Of the South Bay Cities, Torrance<br />
generated the most amount <strong>of</strong> transient occupancy tax revenue with about $5.52<br />
million.<br />
<strong>City</strong> <strong>of</strong> <strong>Inglewood</strong> <strong>General</strong> <strong>Plan</strong> <strong>Update</strong> Technical Background Report<br />
2.3-43
Chapter 2 Community Development<br />
Table 2.3-28<br />
<strong>City</strong> <strong>of</strong> <strong>Inglewood</strong> and South Bay Cities<br />
Transient Occupancy Tax Revenues: 2002–2003<br />
Revenue<br />
% <strong>of</strong> South Bay Cities<br />
<strong>Inglewood</strong> $1,835,682 10.1<br />
Carson 804,397 4.4<br />
El Segundo 2,866,811 15.8<br />
Gardena 475,298 2.6<br />
Hawthorne 929,673 5.1<br />
Hermosa Beach 1,054,272 5.8<br />
Lawndale 297,339 1.6<br />
Lomita 100,792 0.6<br />
Manhattan Beach 2,040,428 11.2<br />
Palos Verdes Estates 0 0.0<br />
Rancho Palos Verdes 15,508 0.1<br />
Redondo Beach 2,257,526 12.4<br />
Rolling Hills 0 0.0<br />
Rolling Hills Estates 0 0.0<br />
Torrance $5,523,329 30.3<br />
Total South Bay Cities $18,201,055 100.0<br />
SOURCES: Stanley R. H<strong>of</strong>fman Associates, Inc.; California State Controller<br />
The transient occupancy tax for the <strong>City</strong> <strong>of</strong> Los Angeles is excluded because it is reported as an<br />
aggregate for the <strong>City</strong> and not by sub-area, such as along Century Blvd. leading into LAX.<br />
Hollywood Park<br />
• The Hollywood Park Race Track is situated on 240 acres <strong>of</strong> land just 3 miles east <strong>of</strong><br />
the Los Angeles International Airport.<br />
• In July 2005, Churchill Downs sold the Hollywood Park Race Track to the Bay<br />
Meadows Land Company for $260 million.<br />
• Under the terms <strong>of</strong> the deal, the Bay Meadows Land Company will continue<br />
thoroughbred racing at the track for at least three more years.<br />
• After this three year guarantee, the continuation <strong>of</strong> Hollywood Park as a racing<br />
venue depends on California allowing the addition <strong>of</strong> alternative forms <strong>of</strong><br />
gambling, such as slot machines, to the track.<br />
• In 2001, Hollywood Park Inc. sold 42 acres <strong>of</strong> underutilized land for the<br />
construction <strong>of</strong> a retail center that includes Target, Home Depot and Gigante<br />
Market.<br />
• The <strong>City</strong> <strong>of</strong> <strong>Inglewood</strong> is expected to work closely with the Bay Meadows Land<br />
Company to secure community and stakeholder input and ideas on various<br />
elements <strong>of</strong> the master planning process for the redevelopment <strong>of</strong> the Hollywood<br />
Park property.<br />
The Forum<br />
• The Forum is located at the southeast corner <strong>of</strong> Manchester Boulevard and Prairie<br />
Avenue. It can hold approximately 18,000 people for concerts and services.<br />
• Since pr<strong>of</strong>essional sports teams such as the Los Angeles Kings, the Los Angeles<br />
Lakers, and the Sparks have moved out <strong>of</strong> the Forum, the site has continued to be<br />
2.3-44<br />
<strong>City</strong> <strong>of</strong> <strong>Inglewood</strong> <strong>General</strong> <strong>Plan</strong> <strong>Update</strong> Technical Background Report
2.3 Economic Trends and Conditions<br />
used for large concerts and weekly church services, but has lost its position within<br />
Los Angeles as the premiere entertainment venue.<br />
• The Forum, which is currently under the ownership <strong>of</strong> the Faithful Central Bible<br />
Church, is exploring the idea <strong>of</strong> using its underutilized parking area for housing and<br />
retail development.<br />
Downtown<br />
• Within the downtown area, there is an increased focus on economic development<br />
and mixed use development. It is the <strong>City</strong>’s hope to have a vibrant downtown,<br />
centering on Market Street, that has commercial, residential, business,<br />
governmental and entertainment uses.<br />
• For the future, a Business Improvement District (BID) is being considered to<br />
revitalize the downtown business environment.<br />
The following presents the key demographic and economic findings and trends in the<br />
<strong>City</strong> <strong>of</strong> <strong>Inglewood</strong> and surrounding area, including: demographic trends; residential<br />
trends; employment trends; growth projections and market conditions and trends.<br />
• Issues<br />
• The <strong>City</strong>’s existing employment base, with one-third <strong>of</strong> all jobs in the services<br />
sector, has the effect <strong>of</strong> lowering the average wage <strong>of</strong> local employment<br />
opportunities.<br />
• The <strong>City</strong>’s population age, 25 years and older, has achieved markedly lower levels<br />
<strong>of</strong> higher education than the total for the South Bay Cities and Los Angeles<br />
County.<br />
• The <strong>City</strong> is currently witnessing leakage in most <strong>of</strong> its retail categories, with only<br />
<strong>General</strong> Merchandise performing above the Los Angeles County per capita average<br />
retail sales.<br />
• In 2004, the unemployment rate in <strong>Inglewood</strong> was the second highest among the<br />
South Bay Cities at 8.3 percent, compared to 6.6 percent for Los Angeles County.<br />
• Manufacturing declined by 31.9 percent from an estimated 2,685 jobs in 2001 to<br />
1829 jobs in 2004.<br />
• The annual average salary in the <strong>City</strong> <strong>of</strong> <strong>Inglewood</strong> declined by 4.5 percent in<br />
constant 2005 dollars from $42,683 to $40,773 from 2001 to 2004.<br />
• Per capita taxable retail sales in <strong>Inglewood</strong> were relatively low at $5,998 amongst<br />
the cities in the South Bay; about 67 percent <strong>of</strong> the $8,980 area average.<br />
• The <strong>City</strong> is generally lacking in strong regional retail centers.<br />
• The <strong>City</strong> is currently lacking in job training and workforce development programs.<br />
• References<br />
California State Board <strong>of</strong> Equalization. Taxable sales data for the <strong>City</strong> <strong>of</strong> <strong>Inglewood</strong>,<br />
annual data for 1994 and 2004.<br />
California Department <strong>of</strong> Finance, 2005. Economic and demographic data.<br />
<strong>City</strong> <strong>of</strong> <strong>Inglewood</strong> <strong>General</strong> <strong>Plan</strong> <strong>Update</strong> Technical Background Report<br />
2.3-45
Chapter 2 Community Development<br />
Construction Industry Research Board, 1995- 2005. Building activity data for the <strong>City</strong> <strong>of</strong><br />
<strong>Inglewood</strong>.<br />
Kosmont Partners, 2003. <strong>Inglewood</strong> Economic Development Opportunities Assessment Report,<br />
Volume I. February.<br />
National Research Bureau, 2003. Shopping Center Directory Published literature<br />
regarding retail activity.<br />
Southern California Association <strong>of</strong> Governments, 2004. Regioanl Transportation <strong>Plan</strong>.<br />
Population, Household and Employment projections for 2000–2030.<br />
United States Bureau <strong>of</strong> the Census, 1990 and 2000. Economic and demographic data<br />
Urban Land Institute, 2004. Dollars and Cents <strong>of</strong> Shopping Centers.<br />
Wilbur Smith Associates, in Association with USC Center for Economic Development<br />
2005. <strong>City</strong> <strong>of</strong> <strong>Inglewood</strong> <strong>City</strong>wide Economic Development Strategic <strong>Plan</strong>, January.<br />
2.3-46<br />
<strong>City</strong> <strong>of</strong> <strong>Inglewood</strong> <strong>General</strong> <strong>Plan</strong> <strong>Update</strong> Technical Background Report
CHAPTER 3<br />
Infrastructure<br />
This chapter provides information on existing infrastructure within the <strong>City</strong>. This Chapter<br />
includes the following sections:<br />
• Water System<br />
• Sewer-Wastewater<br />
• Storm Drainage<br />
• Solid Waste<br />
• Electricity<br />
• Natural Gas<br />
• Telecommunications<br />
• Circulation<br />
3.1 WATER SYSTEM<br />
This section discusses the existing potable water system in the <strong>City</strong> <strong>of</strong> <strong>Inglewood</strong> and<br />
provides information on recycled water. Information for this section is based on the <strong>City</strong><br />
<strong>of</strong> <strong>Inglewood</strong>, 2003 Water Master <strong>Plan</strong>, 2005 Urban Water Management <strong>Plan</strong>, and<br />
conversations with the service providers—Cal-America Water Company, Golden State<br />
Water Company and <strong>City</strong> <strong>of</strong> <strong>Inglewood</strong>.<br />
• Existing Conditions<br />
The <strong>City</strong> <strong>of</strong> <strong>Inglewood</strong> provides water to 86 percent <strong>of</strong> the residences and businesses<br />
within the <strong>City</strong>. Water is provided in the remaining areas by Golden State Water<br />
Company and Cal America Water. The Cal-America Water Company serves a small area<br />
in the northwest area portion <strong>of</strong> the <strong>City</strong>. The Golden State Water Company, formerly<br />
Southern California Water Co., provides water to a significant area located south <strong>of</strong><br />
Century Boulevard to the <strong>City</strong>’s boundary. 18 The <strong>City</strong> purchases approximately 55 percent<br />
<strong>of</strong> its water from West Basin Municipal Water District (WBMWD) and pumps<br />
approximately 45 percent from the <strong>City</strong>’s local groundwater basin. The water provided by<br />
the <strong>City</strong> is pumped from <strong>City</strong>-owned wells, treated, and blended with water purchased<br />
from the West Basin Municipal Water District (WBMWD). Figure 3.1-1 illustrates the<br />
service boundaries <strong>of</strong> each provider in the <strong>City</strong> <strong>of</strong> <strong>Inglewood</strong>.<br />
Water Service Providers<br />
<strong>City</strong> <strong>of</strong> <strong>Inglewood</strong><br />
The <strong>City</strong> <strong>of</strong> <strong>Inglewood</strong> purchases approximately 55 percent <strong>of</strong> its water supplies from the<br />
WBMWD. As a member <strong>of</strong> the Metropolitan Water District (MWD) <strong>of</strong> Southern<br />
California, WBMWD purchases potable water imported from the Colorado River from<br />
MWD on a wholesale basis, and the State Water Project for sale to local retail water<br />
18 Final Report, 2005 Urban Water Management <strong>Plan</strong>, <strong>City</strong> <strong>of</strong> <strong>Inglewood</strong>, December 2005<br />
<strong>City</strong> <strong>of</strong> <strong>Inglewood</strong> <strong>General</strong> <strong>Plan</strong> <strong>Update</strong> Technical Background Report<br />
3.1-1
Chapter 3 Infrastructure<br />
agencies. The imported water is provided, in part to supplement the existing groundwater<br />
supplies in all areas <strong>of</strong> the WBMWD, and to provide a barrier through injection wells, to<br />
seawater intrusion into the West Coast Basin.<br />
West Basin Municipal Water District<br />
The West Basin Municipal Water District (WBMWD) was formed in 1947 to distribute<br />
imported water from the Colorado River. The WBMWD was annexed to the<br />
Metropolitan Water District <strong>of</strong> Southern California in 1948. It has been distributing water<br />
from the Colorado River since 1948 and from the State Water Project since 1974.<br />
Cal-America Water Company<br />
Cal-America Company provides service to roughly five percent <strong>of</strong> the <strong>City</strong> in an area that<br />
is located in the northwest corner <strong>of</strong> <strong>Inglewood</strong>.<br />
Golden State Water Company<br />
The <strong>City</strong> has six emergency connections to the Golden Water State Co. and two<br />
connections to <strong>City</strong> <strong>of</strong> Los Angeles Department <strong>of</strong> Water and Power. These<br />
interconnections are not primary sources <strong>of</strong> the city’s water supply.<br />
Water Infrastructure<br />
<strong>Inglewood</strong> is predominantly a residential community, bordered by the <strong>City</strong> <strong>of</strong> Hawthorne<br />
to the south, and to the east, north and west by portions <strong>of</strong> unincorporated Los Angeles<br />
County and the <strong>City</strong> <strong>of</strong> Los Angeles.<br />
The <strong>City</strong>’s water service area covers approximately 4,600 acres within the <strong>City</strong>’s<br />
boundaries. Water is provided by the <strong>City</strong>’s system to roughly 86 percent <strong>of</strong> the<br />
residences and businesses in the <strong>City</strong>. 19 In 2005, the <strong>City</strong>’s water service area included a<br />
population <strong>of</strong> approximately 98,714 residents through 14,818 connections However,<br />
based on zoning designations, approximately 18,265 residents 20 in the <strong>City</strong> receive water<br />
service from other agencies. The <strong>City</strong>’s water distribution system consists <strong>of</strong> 808,000 feet<br />
(152 miles) <strong>of</strong> pipe, ranging in size from 3 inches to 30 inches in diameter. The service<br />
area is divided into three distinct pressure zones because <strong>of</strong> the elevation differences that<br />
vary from 60 to 247 feet above mean sea level.<br />
In general, the <strong>City</strong>’s domestic water system consists <strong>of</strong> the following. 21<br />
• 152 miles <strong>of</strong> pipe, three active wells, water treatment plant<br />
• Two forebay reservoirs— North <strong>Inglewood</strong> and Morningside<br />
• Two booster pump stations—North <strong>Inglewood</strong> facility; and at Morningside facility<br />
two imported water supply connections<br />
19 <strong>City</strong> <strong>of</strong> <strong>Inglewood</strong>, Water Master <strong>Plan</strong>, 2003, Executive Summary, AKM Consulting Engineers<br />
20 <strong>City</strong> <strong>of</strong> <strong>Inglewood</strong>, Water Master <strong>Plan</strong>, 2003, Executive Summary, AKM Consulting Engineers, pp 3-10.<br />
21 <strong>City</strong> <strong>of</strong> <strong>Inglewood</strong>, Water Master <strong>Plan</strong>, 2003.<br />
3.1-2<br />
<strong>City</strong> <strong>of</strong> <strong>Inglewood</strong> <strong>General</strong> <strong>Plan</strong> <strong>Update</strong> Technical Background Report
CITY <strong>of</strong> INGLEWOOD<br />
<strong>General</strong> <strong>Plan</strong><br />
WATER SERVICE AREAS<br />
Source: <strong>City</strong> <strong>of</strong> <strong>Inglewood</strong>, February 2006.<br />
Date: April 26, 2006<br />
A Division <strong>of</strong><br />
Not to Scale<br />
Figure 3.1-1
3.1 Water System<br />
• Eight emergency connections (two with <strong>City</strong> <strong>of</strong> Los Angeles Department <strong>of</strong> Public<br />
Works, six with Southern California Water Company)<br />
• 14,818 domestic water services, 16 recycled water service connections,<br />
• 198 backflow prevention devices<br />
• 1,540 hydrants, 2,600 gate valves, and 1,250 backflow prevention devices for<br />
internal protection<br />
The <strong>City</strong>’s service area is divided into three distinct pressure zones because <strong>of</strong> the<br />
elevation differences. Zone 1 is located at the southernmost part <strong>of</strong> the city. Zone is<br />
bounded by Imperial Highway to the north, Crenshaw Boulevard to the west, Century<br />
Freeway to the south and Yukon Avenue to the east. Zone 2 is located generally between<br />
Centinela Avenue and Century Boulevard west <strong>of</strong> Prairie Avenue and includes<br />
Hollywood Park. Zone 3 covers the remaining northern and eastern parts <strong>of</strong> the <strong>City</strong>.<br />
According to the <strong>City</strong> <strong>of</strong> <strong>Inglewood</strong>’s database <strong>of</strong> July 6, 2004, there are 14,505 active<br />
water meters in its water distribution system. The metered accounts are divided into five<br />
water code classifications, as follows: residential (A), commercial (B), Industrial (C),<br />
Municipal (D), and Fire Service (E). Small meters (those sized at two inches or smaller)<br />
account for roughly 96.7 percent <strong>of</strong> the total, and generate 82.2 percent <strong>of</strong> the total<br />
revenue, while large meters account only 3.3 percent but generate 17.8 percent <strong>of</strong> the<br />
revenue. Based on <strong>Inglewood</strong>’s database for active meters, small meters total 14,032 and<br />
large meters total 226.<br />
The <strong>City</strong> maintains three pumping stations with a total <strong>of</strong> 24 separate pumps and three<br />
reservoirs ranging in capacity from 1 million gallons to 16 million gallons <strong>of</strong> water with an<br />
overall storage capacity <strong>of</strong> 21.6 million gallons <strong>of</strong> water.<br />
The <strong>City</strong> <strong>of</strong> <strong>Inglewood</strong> system consists <strong>of</strong> three closed pressure zones. Normally, the<br />
pressure is maintained by the available pressure at the two imported water connections,<br />
and pumping at the Effluent Pump Station. These pump stations take suction from the<br />
<strong>City</strong>’s reservoirs, and pump into two closed zones. The two storage reservoirs act as<br />
forebay for the booster pump stations.<br />
Reservoirs<br />
The <strong>City</strong> has two reservoirs that act as forebay storage for the booster pump stations.<br />
Each reservoir is about 18 feet to 20 feet deep, but the reservoir levels are maintained<br />
below 3.5 feet to ensure circulation and maintain adequate disinfectant residuals in the<br />
system. The North <strong>Inglewood</strong> Reservoir was constructed in 1974. It is a covered<br />
underground reservoir 144 feet wide and 221 feet long. Its total capacity is 4.6 million<br />
gallons. The reservoir level is currently operated between 1.0 and 3.5 feet. The<br />
Morningside Reservoir was constructed in 1954, and has a total capacity <strong>of</strong> 16 million<br />
gallons. The reservoir level is currently operated between 0.5 and 2.5 feet.<br />
<strong>City</strong> <strong>of</strong> <strong>Inglewood</strong> <strong>General</strong> <strong>Plan</strong> <strong>Update</strong> Technical Background Report<br />
3.1-5
Chapter 3 Infrastructure<br />
Groundwater<br />
The <strong>City</strong> has access to groundwater in the West Coast Groundwater Basin and imported<br />
Metropolitan Water District <strong>of</strong> Southern California (MWD) supplies through the West<br />
Basin Municipal Water District (WBMWD). 22<br />
The <strong>City</strong>’s water system has two MWD connections: WB-17 and WB-38. Since 1995, an<br />
average <strong>of</strong> 6,400 acres feet per year (AF/year) has been purchased from MWD. The <strong>City</strong><br />
has not been restricted in the amount <strong>of</strong> water it takes from MWD. The minimum<br />
required at each connection is 1 cubic foot per second (cfs). The imported water use is<br />
adjusted based on demand and is typically mixed with treated well water before entering<br />
the system.<br />
West Coast Groundwater Basin<br />
The <strong>City</strong> <strong>of</strong> <strong>Inglewood</strong> has three active wells (Wells 1, 2, and 4) that extract water from<br />
the West Coast Groundwater Basin. The West Coast Groundwater Basin underlies the<br />
southwestern portion <strong>of</strong> the Los Angeles Coastal Plain. The city has adjudicated rights to<br />
4, 49.89 acre-feet <strong>of</strong> groundwater per year. This total does not include leased water or<br />
carryover water from previous years. On average, the <strong>City</strong> pumps 5,600 acre-feet per year<br />
from the West Coast Groundwater Basin. The capacity <strong>of</strong> wells has declined significantly<br />
over the years.<br />
• The capacity at Well 1 has decreased from 3,000 gallons per minute (gpm) to about<br />
900 gpm.<br />
• The capacity at Well 2 has decreased from 3,000 gpm to about 1,000 gpm<br />
• The capacity at Well 3 has decreased from 2,500 gpm to about 1,550 gpm.<br />
In addition, the <strong>City</strong> plans to increase the groundwater supply with two additional wells.<br />
Well 5 is constructed but currently not on-line. The expected capacity is 1,750 gpm.<br />
Well 6 is currently under construction. Its anticipated capacity is 2,000 gpm<br />
The raw well water is conveyed directly to the <strong>City</strong>’s treatment plant (Sanford M<br />
Anderson Treatment <strong>Plan</strong>t) via a 12 inch to 27-inch diameter raw well water transmission<br />
main.<br />
Water Treatment<br />
Groundwater Treatment<br />
The <strong>City</strong> <strong>of</strong> <strong>Inglewood</strong>’s treatment plant has a capacity to treat 8.5 million gallons per day<br />
(gpd) <strong>of</strong> groundwater. In order to provide an adequate amount <strong>of</strong> water, the city operates<br />
four wells that extract local groundwater from the West Coast Basin and treat it at the<br />
treatment plant.<br />
22 <strong>City</strong> <strong>of</strong> <strong>Inglewood</strong>, Water Master <strong>Plan</strong>, 2003, Executive Summary, AKM Consulting Engineers<br />
3.1-6<br />
<strong>City</strong> <strong>of</strong> <strong>Inglewood</strong> <strong>General</strong> <strong>Plan</strong> <strong>Update</strong> Technical Background Report
3.1 Water System<br />
The Sanford M. Anderson Treatment <strong>Plan</strong>t (Anderson Treatment <strong>Plan</strong>t), a three acre site,<br />
is located on the southwest corner <strong>of</strong> Eucalyptus Avenue and Beach Avenue, within the<br />
<strong>City</strong>, and was constructed to treat the <strong>City</strong>’s groundwater for iron and manganese.<br />
Currently, the Anderson Treatment <strong>Plan</strong>t has a capacity <strong>of</strong> 8.64 million gpd and a<br />
clearwell capacity <strong>of</strong> 834,000 gallons. The treated water is then pumped from the<br />
treatment plant to the North <strong>Inglewood</strong> and Morningside facilities. The raw well water is<br />
conveyed directly to the <strong>City</strong>’s treatment plant (Sanford M Anderson Treatment <strong>Plan</strong>t) via<br />
a 12-inch to 27-inch diameter raw well water transmission main.<br />
Water Demand and Supply<br />
The <strong>City</strong> <strong>of</strong> <strong>Inglewood</strong>’s historic water production was established from records <strong>of</strong> well<br />
production and purchased imported water from two Metropolitan Water District<br />
connections.<br />
The annual water purchase and well production over the last seven years has averaged a<br />
total <strong>of</strong> 12096.44 AF/year. The <strong>City</strong> pumped an annual average <strong>of</strong> 5,601 AF <strong>of</strong> local<br />
groundwater and imported 6,394 AF <strong>of</strong> MWD water over the last seven fiscal years. 23 The<br />
percentage <strong>of</strong> the total water supply that was provided by groundwater averages<br />
approximately 43 percent per year. About 57 percent <strong>of</strong> the total water supply was<br />
provided by imported water from MWD.<br />
Demand variations through a year are influenced by seasonal effects. Peak and low<br />
monthly consumption occur during the dry summer months and wet winter months.<br />
Peak demands occur in June and August, and the 2001-2002 monthly water demands<br />
were 1046.10 AF in June, and 1118.43 in August 01-02. Low demands occur in February,<br />
with a monthly water demand <strong>of</strong> 757.67. 24 The highest and lowest demand factors are<br />
1.31 and 0.57 respectively.<br />
In FY 2004–2005 the <strong>City</strong> had an available supply <strong>of</strong> 11,751.45 AF from groundwater<br />
and purchased water. Projected water supplies to 2030 are derived from the adjudicated<br />
water rights, the 18 year averages for carryovers, net leases/exchanges and purchased<br />
water. Table 3.1-1 refers to the current and projected supply though 2030. The one factor<br />
that is constant throughout the period is the adjudicated water rights – the city produced<br />
groundwater, <strong>of</strong> 4449.89 AF/year.<br />
23 <strong>City</strong> <strong>of</strong> <strong>Inglewood</strong>, Water Master <strong>Plan</strong>, 2003, Executive Summary, AKM Consulting Engineers, pp5-1<br />
24 Ibid., pp5-2.<br />
<strong>City</strong> <strong>of</strong> <strong>Inglewood</strong> <strong>General</strong> <strong>Plan</strong> <strong>Update</strong> Technical Background Report<br />
3.1-7
Chapter 3 Infrastructure<br />
Table 3.1-1<br />
Current and projected Water Supplies (AF/YR)<br />
Water supply sources 2005 2010 2015 2020 2025 2030<br />
<strong>City</strong> produced groundwater 4,450 4,450 4,450 4,450 4,450 4,450<br />
Purchased from wholesaler<br />
WBMWD<br />
6290 8500 8500 8500 8500 8500<br />
Recycled water 654 670 670 670 670 670<br />
Carryovers/net leases &<br />
Exchanges<br />
946 933 933 933 933 933<br />
Total 12340 14553 14553 14553 14553 14553<br />
Water Consumption and Water Production<br />
The <strong>City</strong> produces and purchases more water per year than is measured by the meters. An<br />
average <strong>of</strong> 92 percent <strong>of</strong> water produced and purchased each year was used by the<br />
consumers. Approximately eight percent <strong>of</strong> the water supply is unaccounted for each<br />
year.<br />
Water Conservation<br />
In 1990, the <strong>City</strong> had adopted a voluntary program that encouraged a 10 percent<br />
reduction in water usage. Similarly, a few years later, in 1991, the <strong>City</strong> <strong>of</strong> <strong>Inglewood</strong><br />
adopted two water conservation Ordinances: 1) Ordinance No. 91-6 (Water Conservation<br />
Practices) and 2) Ordinance No. [X] (Water Efficiency in the Landscape).<br />
Recycled Water Use<br />
The <strong>City</strong> <strong>of</strong> <strong>Inglewood</strong> has 16 connections to the West Basin Municipal Water District’s<br />
recycled water system, which utilizes approximately 700 acre feet per year 25 . The <strong>City</strong> has<br />
a recycled water use program and as been purchasing recycled water from WBMWD<br />
Water Recycling <strong>Plan</strong>t, located in El Segundo, since 1995.<br />
Current demand for recycled water is low, and is primarily only used for irrigation<br />
purposes. Presently, approximately 655 AF/year are delivered to industrial, municipal and<br />
school district facilities for the irrigation <strong>of</strong> landscape and other non-potable uses. The<br />
<strong>City</strong> has 14 connections to the West Basin’s recycled water system and serves the<br />
Cemetery, Hollywood Park Race Track, <strong>City</strong> Parks, School District, and Caltrans Right <strong>of</strong><br />
way. Table 3.1-2 provides recycled water use for the ten years.<br />
25 <strong>City</strong> <strong>of</strong> <strong>Inglewood</strong>, Water Master <strong>Plan</strong>, 2003, Executive Summary, AKM Consulting Engineers<br />
3.1-8<br />
<strong>City</strong> <strong>of</strong> <strong>Inglewood</strong> <strong>General</strong> <strong>Plan</strong> <strong>Update</strong> Technical Background Report
3.1 Water System<br />
Table 3.1-2<br />
AF/year<br />
FY 94/95 2.62<br />
FY 95/96 243.2<br />
FY 96/97 707.91<br />
FY 97/98 516.2<br />
FY 98/99 545.2<br />
FY 99/00 727.90<br />
FY 00/01 645.89<br />
FY 01/02 737.3<br />
FY 02/03 607.1<br />
FY 03/04 705.34<br />
FY 04/05 654.16<br />
Total 6092.90<br />
Recycled Water Use<br />
• Regulatory Setting<br />
Federal<br />
Clean Water Act<br />
The federal Clean Water Act (CWA) establishes regulatory requirements for potable water<br />
supplies including raw and treated water quality criteria. The <strong>City</strong> <strong>of</strong> <strong>Inglewood</strong> would be<br />
required to monitor water quality and conform to the regulatory requirements <strong>of</strong> the<br />
CWA.<br />
Safe Drinking Water Act<br />
The federal Safe Drinking Water Act (SDWA) established standards for contaminants in<br />
drinking water supplies. Maximum levels and/or treatment techniques were established<br />
for each <strong>of</strong> the contaminants, including: metals, nitrates, asbestos, total dissolved solids,<br />
and microbes.<br />
State<br />
Safe Drinking Water Act (1976)<br />
California enacted its own Safe Drinking Water Act. The California Department <strong>of</strong> Health<br />
Services (DHS) has been granted primary enforcement responsibility for the SDWA.<br />
Title 22 <strong>of</strong> the California Administrative Code establishes DHS authority and stipulates<br />
drinking water quality and monitoring standards. These standards are equal to or more<br />
stringent than federal standards.<br />
The Urban Water Management <strong>Plan</strong>ning Act (UWMPA) was also developed due to concerns<br />
for potential water supply shortages throughout the state <strong>of</strong> California. It requires<br />
information on water supply reliability and water use efficiency measures. Urban water<br />
<strong>City</strong> <strong>of</strong> <strong>Inglewood</strong> <strong>General</strong> <strong>Plan</strong> <strong>Update</strong> Technical Background Report<br />
3.1-9
Chapter 3 Infrastructure<br />
suppliers are required, as part <strong>of</strong> the Act, to develop and implement plans to describe<br />
their efforts to promote efficient use and management <strong>of</strong> water resources. 26<br />
Recycled Water Regulations<br />
Within the State <strong>of</strong> California, recycled water is regulated by the U.S. Environmental<br />
Protection Agency (EPA), the State Water Resources Control Board, Regional Water<br />
Quality Control Boards, and CDHS. The State Water Resources Control Board has<br />
adopted Resolution No. 77-1, Policy with Respect to Water Reclamation in California.<br />
This policy states that the State Board and Regional Boards will encourage and consider<br />
or recommend for funding water reclamation projects that do not impair water rights or<br />
beneficial instream uses. The CDHS establishes the recycled water uses allowed in the<br />
State, and designates the level <strong>of</strong> treatment (i.e., undisinfected secondary, disinfected<br />
secondary, or disinfected tertiary) required for each <strong>of</strong> these designated uses (Title 22,<br />
California Code <strong>of</strong> Regulations).<br />
The Regional Water Quality Control Boards implement the State Board’s Guidelines for<br />
Regulation <strong>of</strong> Water Reclamation and issue waste discharge permits that serve to regulate<br />
the quality <strong>of</strong> recycled water based on stringent water quality requirements. The CDHS<br />
develops policies protecting human health and comments and advises on Regional Water<br />
Quality Control Board permits.<br />
Title 22<br />
The California Water Code requires the CDHS to establish water reclamation criteria. In<br />
1975, the CDHS prepared Title 22 to fulfill this requirement. Title 22 regulates<br />
production and use <strong>of</strong> reclaimed water in California by establishing three categories <strong>of</strong><br />
reclaimed water: primary effluent, which typically includes grit removal and initial<br />
sedimentation or settling tanks; adequately disinfected, oxidized effluent (secondary<br />
effluent) which typically involves aeration and additional settling basins; and adequately<br />
disinfected, oxidized, coagulated, clarified, filtered effluent (tertiary effluent) which<br />
typically involves filtration and chlorination. In addition to defining reclaimed water uses,<br />
Title 22 also defines requirements for sampling and analysis <strong>of</strong> effluent and requires<br />
specific design requirements for facilities.<br />
Local<br />
<strong>City</strong> <strong>of</strong> <strong>Inglewood</strong> Municipal Code<br />
Section 5-112 (Water Efficiency in the Landscape) <strong>of</strong> the <strong>City</strong>’s Municipal Code<br />
establishes procedures and standards for the design, installation, and maintenance <strong>of</strong><br />
water-efficient landscapes in conjunction with new construction projects within the <strong>City</strong>.<br />
26 Urban Water Management <strong>Plan</strong>ning Act (California Water Code, Division 6, Part 2.6, Section 10610 et<br />
seq.)<br />
3.1-10<br />
<strong>City</strong> <strong>of</strong> <strong>Inglewood</strong> <strong>General</strong> <strong>Plan</strong> <strong>Update</strong> Technical Background Report
3.1 Water System<br />
This section promotes the conservation and efficient use <strong>of</strong> water within the <strong>City</strong> in order<br />
to prevent the waste <strong>of</strong> water resources.<br />
• Issues<br />
• Retr<strong>of</strong>itting <strong>of</strong> Water Meters: <strong>City</strong> <strong>of</strong> <strong>Inglewood</strong> requires the replacing its water<br />
meters on all active accounts, including those for Municipal accounts (but exclude<br />
Fire Service meters). 27 The effect <strong>of</strong> this project will be an increase in billable water<br />
consumption, thereby allowing the <strong>City</strong> <strong>of</strong> <strong>Inglewood</strong> to charge for water which is<br />
although being consumed, but has not been paid for.<br />
• References<br />
<strong>City</strong> <strong>of</strong> <strong>Inglewood</strong>, 2005. Urban Water Management <strong>Plan</strong>. December.<br />
<strong>City</strong> <strong>of</strong> <strong>Inglewood</strong>, 2003. Water Master <strong>Plan</strong>.<br />
Johnsons Control, 2004. Detailed Facility Improvement Measure Description, FIM 1 Water Meter<br />
Retr<strong>of</strong>it. 24 September.<br />
27 Johnson Controls, Draft publication, (9/24/2004) Detailed Facility Improvement Measure Description,<br />
FIM 1 Water Meter Retr<strong>of</strong>it. 24 September. This draft provides a detailed facility improvement measure<br />
description.<br />
<strong>City</strong> <strong>of</strong> <strong>Inglewood</strong> <strong>General</strong> <strong>Plan</strong> <strong>Update</strong> Technical Background Report<br />
3.1-11
3.2 Sewer and Wastewater<br />
3.2 SEWER AND WASTEWATER<br />
This section describes the existing sewer and wastewater system in the <strong>City</strong> <strong>of</strong> <strong>Inglewood</strong>.<br />
Information for this section was obtained from the <strong>City</strong>’s 2003 Water Master <strong>Plan</strong>, the<br />
<strong>City</strong>’s 2005 Urban Water Management <strong>Plan</strong> and discussions with service providers—<br />
<strong>Inglewood</strong>, and Los Angeles County Sanitation District.<br />
• Existing Conditions<br />
Service Providers<br />
Most cities have complex systems <strong>of</strong> sewer lines feeding into larger lines to move raw<br />
sewage to a regional treatment facility. Some cities also have agreements for treatment<br />
with other local providers. Sewer and wastewater service within the <strong>City</strong> <strong>of</strong> <strong>Inglewood</strong> is<br />
provided by the <strong>City</strong> and the Los Angeles County Sanitation District (LACSD). Similar to<br />
the boundaries <strong>of</strong> the <strong>City</strong>’s potable water system, LACSD provides sewer service for the<br />
entire <strong>City</strong>, a service area <strong>of</strong> approximately 8.9 gross square miles, as illustrated in<br />
Figure 3.2-1.<br />
LACSD boundaries encompass nearly 85,019 acres, and contains 155 miles <strong>of</strong> sewer<br />
mains in the <strong>City</strong> <strong>of</strong> <strong>Inglewood</strong>, including 3,240 sewer manholes and 16,393 sewer lateral<br />
connections. LACSD has a total <strong>of</strong> 16,177 active refuse accounts in the <strong>City</strong>.<br />
Wastewater Collection and Treatment<br />
The Los Angeles County Sanitation District (LACSD) manages wastewater collection and<br />
treatment for the <strong>City</strong> <strong>of</strong> <strong>Inglewood</strong>. The wastewater from the <strong>City</strong> primarily flows to the<br />
Joint Water Pollution Control <strong>Plan</strong>t (advanced primary with partial secondary treatment)<br />
located in the <strong>City</strong> <strong>of</strong> Carson. The wastewater flow from the <strong>City</strong> to the LACSD<br />
treatment facility estimated at 10.6 million gallons per day (mgd), <strong>of</strong> which approximately<br />
8.9 mgd is from the portion <strong>of</strong> the <strong>City</strong> served by the <strong>City</strong>’s water system. 28 LACSD is<br />
also responsible for monitoring industrial waste discharges into the wastewater system.<br />
Joint Water Pollution Control <strong>Plan</strong>t<br />
The Joint Water Pollution Control <strong>Plan</strong>t (JWPCP) is located at 24501 S. Figueroa Street<br />
in Carson, California. The plant occupies approximately 350 acres to the east <strong>of</strong> the<br />
Harbor (110) Freeway. One hundred thirty five <strong>of</strong> the 350 acres are used as buffer areas<br />
between the operational areas and surrounding residential neighbors. These buffer areas<br />
include nursery operations, the Wilmington Boys and Girls Club, a fresh water marsh area<br />
and Kellogg’s Supply Inc.<br />
28 2005 Urban Water Management <strong>Plan</strong>, December 2005<br />
<strong>City</strong> <strong>of</strong> <strong>Inglewood</strong> <strong>General</strong> <strong>Plan</strong> <strong>Update</strong> Technical Background Report<br />
3.2-1
Chapter 3 Infrastructure<br />
Operation<br />
The JWPCP is one <strong>of</strong> the largest wastewater treatment plants in the world and is the<br />
largest <strong>of</strong> LACSD’s wastewater treatment plants. The facility provides both primary and<br />
secondary treatment for approximately 320 million gallons <strong>of</strong> wastewater per day. Solids<br />
collected in primary and secondary treatment are processed in anaerobic digestion tanks<br />
where bacteria break down organic material and produce methane gas. After digestion,<br />
the solids are dewatered and hauled <strong>of</strong>f site for use in composting, land application, or<br />
combined with municipal solid waste for co-disposal. Methane gas generated in the<br />
anaerobic digestion process is used to produce power and digester heating steam in a<br />
combined cycle power plant that utilizes gas turbines and waste-heat recovery steam<br />
generators. The on-site generation <strong>of</strong> power permits the JWPCP to be self-sufficient with<br />
respect to its energy requirements. The plant serves a population <strong>of</strong> approximately<br />
3.5 million people throughout Los Angeles County. Prior to discharge, the treated<br />
wastewater is disinfected with hypochlorite and sent to the Pacific Ocean through a<br />
network <strong>of</strong> outfalls. These outfalls extend two miles <strong>of</strong>f the coast <strong>of</strong> Southern California<br />
into the Palos Verdes Peninsula to a depth <strong>of</strong> 200 feet. 29<br />
Water Treatment<br />
Wastewater treatment involves processes that, at minimum, remove solids to a level that<br />
meets regulatory water quality standards. The treatment processes include preliminary,<br />
primary, secondary, and tertiary phases, each <strong>of</strong> which removes progressively finer grains<br />
<strong>of</strong> solids. At the end <strong>of</strong> secondary treatment, most solids have been removed from the<br />
water. Tertiary treatment eliminates remaining impurities through filtration and<br />
disinfection. There are three wastewater treatment plants that serve the jurisdictions<br />
within the watershed. As mentioned above, JWPCP is operated by LACSD and occupies<br />
approximately 142 hectares (350 acres) to the east <strong>of</strong> the Harbor (110) Freeway. The<br />
JWPCP is the largest <strong>of</strong> the Districts' wastewater treatment plants, providing full<br />
secondary treatment for up to 400 million gallons <strong>of</strong> wastewater per day (mgd).<br />
The JWPCP serves communities throughout the entire South Bay, as well as communities<br />
as far east as Downey and as far north as <strong>Inglewood</strong>. The treated wastewater is<br />
disinfected with chlorine and sent to the Pacific Ocean through a network <strong>of</strong> outfalls that<br />
extends approximately three kilometers (two miles) <strong>of</strong>f the Palos Verdes Peninsula to a<br />
depth <strong>of</strong> 200 feet.<br />
Recycled Water Use<br />
The <strong>City</strong> has a recycled water use program and has been purchasing recycled water from<br />
West Basin Municipal Water District [WBMWD] Water Recycling <strong>Plan</strong>t, located in El<br />
Segundo, California since 1995. Approximately 655 af/year (acre-feet) are delivered to<br />
industrial, municipal, and school district facilities for the irrigation <strong>of</strong> landscape and other<br />
non-potable uses.<br />
29 http://www.lacsd.org/jwpcp/jwpcp.htm<br />
3.2-2<br />
<strong>City</strong> <strong>of</strong> <strong>Inglewood</strong> <strong>General</strong> <strong>Plan</strong> <strong>Update</strong> Technical Background Report
CITY <strong>of</strong> INGLEWOOD<br />
<strong>General</strong> <strong>Plan</strong><br />
SEWER INDEX<br />
Source: <strong>City</strong> <strong>of</strong> <strong>Inglewood</strong>, March 2006.<br />
Date: April 6, 2006<br />
A Division <strong>of</strong><br />
Figure 3.2-1
3.2 Sewer and Wastewater<br />
The <strong>City</strong> <strong>of</strong> Los Angeles operates the Hyperion Wastewater Treatment <strong>Plan</strong>t located near<br />
the West Basin’s service area. West Basin purchases effluent from the Hyperion<br />
Treatment <strong>Plan</strong>t that has received secondary treatment. West Basin treats the effluent to a<br />
minimum <strong>of</strong> tertiary treatment and disinfection to meet State requirements. Rates for<br />
reclaimed water are low and are used primarily for irrigation purposes. The <strong>City</strong> has 14<br />
connections to the West Basin’s recycled water system and serves <strong>Inglewood</strong> Park<br />
Cemetery, Hollywood Park Race Track, <strong>City</strong> Parks, School District facilities, and Caltrans<br />
right <strong>of</strong> way.<br />
• Regulatory Setting<br />
Federal Regulations<br />
National Pollution Discharge Elimination System (NPDES) Permits<br />
The NPDES permit system was established by the Clean Water Act (CWA) to regulate<br />
both point source discharges (a municipal or industrial discharge at a specific location or<br />
pipe) and nonpoint source discharges (diffuse run<strong>of</strong>f <strong>of</strong> water from adjacent land uses) to<br />
surface waters <strong>of</strong> the United States. For point source discharges, such as sewer outfalls,<br />
each NPDES permit contains limits on allowable concentrations and mass emissions <strong>of</strong><br />
pollutants contained in the discharge.<br />
Disposal <strong>of</strong> Biosolids<br />
Title 40 <strong>of</strong> the Code <strong>of</strong> Federal Regulations (CFR) Part 503, Title 23 California Code <strong>of</strong><br />
Regulations, and standards established by the CVRWQCB regulate the disposal <strong>of</strong><br />
biosolids.<br />
• Issues<br />
• A Sewer Master <strong>Plan</strong> is currently being prepared by the <strong>City</strong> and will be available by<br />
the end <strong>of</strong> 2006. While no issues have been identified by this report, the Sewer<br />
Master <strong>Plan</strong> may identify specific issues related to the <strong>City</strong>’s sewer and wastewater<br />
systems.<br />
• References<br />
Sanitation Districts <strong>of</strong> Los Angeles County. 2006. Website: www.lacsd.org, accessed<br />
March 31.<br />
Joint Water Pollution Control <strong>Plan</strong>t. 2006. Website:<br />
http://www.lacsd.org/jwpcp/jwpcp.htm, accessed March 31.<br />
United States Environmental Protection Agency. 2006. “Clean Water Act, Section 402:<br />
National Pollutant Discharge Elimination System. Website:<br />
http://www.epa.gov/owow/wetlands/laws/section402.html, accessed March 31.<br />
<strong>City</strong> <strong>of</strong> <strong>Inglewood</strong>, Ordinance No. 93-20, Water Efficiency in the landscape.<br />
<strong>City</strong> <strong>of</strong> <strong>Inglewood</strong> <strong>General</strong> <strong>Plan</strong> <strong>Update</strong> Technical Background Report<br />
3.2-5
Chapter 3 Infrastructure<br />
<strong>City</strong> <strong>of</strong> <strong>Inglewood</strong>, Urban Water Management <strong>Plan</strong>, December 2005<br />
<strong>City</strong> <strong>of</strong> <strong>Inglewood</strong>, Water Master <strong>Plan</strong>, September 2003.<br />
West Basin Municipal District, http://www.westbasin.org/<br />
Urban Water Management <strong>Plan</strong>, http://www.westbasin.org/pdf/UWMP_2005.pdf<br />
3.2-6<br />
<strong>City</strong> <strong>of</strong> <strong>Inglewood</strong> <strong>General</strong> <strong>Plan</strong> <strong>Update</strong> Technical Background Report
3.3 Storm Drains<br />
3.3 STORM DRAINS<br />
This section discusses the storm drain systems within the <strong>City</strong> <strong>of</strong> <strong>Inglewood</strong>. Information<br />
in this section is based on the <strong>City</strong> <strong>of</strong> <strong>Inglewood</strong> public works staff, <strong>Inglewood</strong> Municipal<br />
Code and 2005 Urban Water Management <strong>Plan</strong>.<br />
• Existing Conditions<br />
The <strong>City</strong> <strong>of</strong> <strong>Inglewood</strong> is situated on the upper portion <strong>of</strong> the local Dominguez<br />
watershed, and the lower portion <strong>of</strong> the Ballona Watershed, as shown in Figure 5.2-1<br />
(Watersheds) in Section 5.2 (Hydrology and Water Quality). As a result, the <strong>City</strong> is not in<br />
the path <strong>of</strong> any upstream run<strong>of</strong>f. Of the two types <strong>of</strong> flooding (riverine flooding and<br />
urban flooding), the <strong>City</strong> is affected by urban flooding. In addition, any low-lying area has<br />
the potential to flood. The flooding <strong>of</strong> developed areas may occur when the amount <strong>of</strong><br />
water generated from rainfall and run<strong>of</strong>f exceeds a stormwater system’s capability to<br />
remove it.<br />
Winter Rainfall<br />
Over the last 125 years, the average annual rainfall in Los Angeles was 14.9 inches. The<br />
<strong>City</strong> <strong>of</strong> <strong>Inglewood</strong> is in the southwestern section <strong>of</strong> Los Angeles. It is up against the<br />
Rosecrans and Baldwin Hills, which increases the collection <strong>of</strong> rainwater.<br />
Storm Drain Facilities<br />
The <strong>City</strong> owns and maintains approximately 12 miles <strong>of</strong> reinforced concrete pipes and<br />
464 catch basins. The Los Angeles County Flood Control District operates roughly<br />
42 miles <strong>of</strong> storm drain pipes along with 889 catch basins within <strong>City</strong> limits, as shown in<br />
Figure 3.3-1.<br />
The <strong>City</strong> <strong>of</strong> <strong>Inglewood</strong> has a high concentration <strong>of</strong> impermeable surfaces that either<br />
collect water, or concentrate the flow <strong>of</strong> water in unnatural channels. During periods <strong>of</strong><br />
urban flooding, streets can become swift moving rivers, and basements can fill with<br />
water. Storm drains can back up with vegetative debris causing additional, localized<br />
ponding or flooding.<br />
There are a variety <strong>of</strong> surface water management providers in the County that manage<br />
water quality and storm water run<strong>of</strong>f from new development. The <strong>City</strong> has an active<br />
program to implement the requirements <strong>of</strong> the National Pollutant Discharge Elimination<br />
System (NPDES).<br />
Flooding<br />
The <strong>City</strong> <strong>of</strong> <strong>Inglewood</strong> is susceptible to flooding from the confluence <strong>of</strong> storm run-<strong>of</strong>f<br />
due to heavy rain. Flooding has occurred from the overflow <strong>of</strong> rain within the storm<br />
water system. Flooding has occurred along commercial streets that have disrupted traffic.<br />
<strong>City</strong> <strong>of</strong> <strong>Inglewood</strong> <strong>General</strong> <strong>Plan</strong> <strong>Update</strong> Technical Background Report<br />
3.3-1
Chapter 3 Infrastructure<br />
There are a number <strong>of</strong> rivers in the Southern California region, but the river with the best<br />
recorded history is the Los Angeles River. The flood history <strong>of</strong> the Los Angeles River is<br />
generally indicative <strong>of</strong> the flood history <strong>of</strong> much <strong>of</strong> Southern California. While the <strong>City</strong> <strong>of</strong><br />
<strong>Inglewood</strong> is ten miles to the southwest <strong>of</strong> downtown Los Angeles, it is not so far away<br />
as to not be affected by the heavy rains that bring flooding to Los Angeles.<br />
The Santa Monica, Santa Susana, and Vertigo mountains, which surround three sides <strong>of</strong><br />
the valley, seldom reach heights above three thousand feet. The western San Gabriel<br />
Mountains, in contrast, have elevations <strong>of</strong> more than seven thousand feet. These higher<br />
ridges <strong>of</strong>ten trap eastern-moving winter storms. Although downtown Los Angeles<br />
averages just fifteen inches <strong>of</strong> rain a year, some mountain peaks in the San Gabriel’s<br />
receive more than forty inches <strong>of</strong> precipitation annually.<br />
The amount <strong>of</strong> paved roads and the geographic location <strong>of</strong> the city, adjacent to the<br />
Baldwin and Rosecrans Hills to the north and east, and the principal location <strong>of</strong><br />
<strong>Inglewood</strong> within the coastal plain which slopes gently from the east to the southwest,<br />
prevent the <strong>City</strong> from flooding. However, it is important that the <strong>City</strong>’s storm water<br />
infrastructure is maintained in prime condition.<br />
• Regulatory Setting<br />
Federal Regulations<br />
National Pollutant Discharge Elimination System<br />
Established under the Clean Water Act, National Pollutant Discharge Elimination System<br />
(NPDES) regulation protects receiving water quality through two primary objectives: (1)<br />
effectively prohibit non-storm water discharges to the storm drain system, and (2)<br />
reduces the discharge <strong>of</strong> pollutants to the storm drain system to the maximum extent<br />
practicable through the implementation <strong>of</strong> control measures called "best management<br />
practices" (BMPs). In California, federal and state NPDES regulations are enforced by<br />
the State Water Resources Control Board (SWRCB), and nine regional water quality<br />
control boards requiring certain facilities to file a Notice <strong>of</strong> Intent (NOI), and implement<br />
a Storm Water Pollution Prevention <strong>Plan</strong> (SWPPP) to control storm water pollutants<br />
(e.g., manufacture <strong>of</strong> asphalt, concrete, vitreous and steel products). The RWQCB has<br />
also issued a Los Angeles Countywide Municipal NPDES Permit which requires all cities<br />
in the County to implement a wide variety <strong>of</strong> activities under extensive programs to<br />
remove pollutants from storm water/urban run<strong>of</strong>f. As a Permittee under the Countywide<br />
NPDES Permit, the <strong>City</strong> <strong>of</strong> <strong>Inglewood</strong> adopted an ordinance to allow implementation <strong>of</strong><br />
the programs required by the Permit codified in the <strong>Inglewood</strong> Municipal Code as Article<br />
15 <strong>of</strong> Chapter 9.<br />
3.3-2<br />
<strong>City</strong> <strong>of</strong> <strong>Inglewood</strong> <strong>General</strong> <strong>Plan</strong> <strong>Update</strong> Technical Background Report
CITY <strong>of</strong> INGLEWOOD<br />
<strong>General</strong> <strong>Plan</strong><br />
STORM DRAIN INDEX<br />
Source: <strong>City</strong> <strong>of</strong> <strong>Inglewood</strong>, March 2006.<br />
Date: April 6, 2006<br />
A Division <strong>of</strong><br />
Figure 3.3-1
3.3 Storm Drains<br />
NPDES Permit Program—Phase II<br />
On August 7, 1995, EPA amended the NPDES permit application requirements in order<br />
to focus on Phase II storm water discharges, such as discharges caused by the following:<br />
• Commercial, light industrial and institutional activities<br />
• Construction activities under 5 acres<br />
• Municipal storm drain systems serving populations under 100,000<br />
Similar to Phase I requirements, the NPDES Phase II permit program also requires the<br />
development and implementation <strong>of</strong> storm water management plans to reduce such<br />
discharges. Affected agencies must apply for a NPDES Phase II permit by March 2003.<br />
<strong>General</strong> Construction Storm Water Permit<br />
Construction site storm water management is governed by the State Board under Water<br />
Quality Order 99-08-DWQ/NPDES <strong>General</strong> Permit No. CAS000002. These regulations<br />
prohibit discharges <strong>of</strong> storm water to waters <strong>of</strong> the United States from construction<br />
projects that encompass one or more acres <strong>of</strong> soil disturbance unless the discharge is in<br />
compliance with an NPDES permit. The California <strong>General</strong> Permit (enforced by the nine<br />
Regional Boards) requires all dischargers where construction activity disturbs one acre or<br />
more to do the following:<br />
• Develop and implement a SWPPP that specifies BMPs that will prevent all<br />
construction pollutants from contacting storm water and with the intent <strong>of</strong> keeping<br />
all products <strong>of</strong> erosion from moving <strong>of</strong>f site into receiving waters<br />
• Eliminate or reduce non-storm water discharges to storm sewer systems and other<br />
waters <strong>of</strong> the nation<br />
• Perform inspections <strong>of</strong> all BMPs<br />
Los Angeles County requires an Erosion Control <strong>Plan</strong> (ECP) for all developments as part<br />
<strong>of</strong> the SWPP; if development is less than one acre, only an ECP is prepared.<br />
Construction activity subject to this <strong>General</strong> Permit includes clearing, grading,<br />
disturbances to the ground such as stockpiling, or excavation that results in soil<br />
disturbances <strong>of</strong> at least one acre <strong>of</strong> total land area. Construction activity that disturbs less<br />
than one acre <strong>of</strong> soil is subject to this <strong>General</strong> Permit if the construction activity is part <strong>of</strong><br />
a larger common development plan (encompassing one or more acres <strong>of</strong> disturbed soil)<br />
or if the construction causes significant impairment to local water quality. Construction<br />
activity does not include routine maintenance to maintain original line and grade,<br />
hydraulic capacity, or original purpose <strong>of</strong> the facility, nor does it include emergency<br />
construction activities required to protect public health and safety. A construction project<br />
that involves a dredge and/or fill discharge to any jurisdictional surface water (e.g.,<br />
wetland, channel, pond, or marine water) also needs a CWA Section 404 permit from the<br />
U.S. Army Corps <strong>of</strong> Engineers and a CWA Section 401 Water Quality Certification from<br />
the Regional Board and State Board. Storm water discharges from dredge spoil<br />
placement, which occur outside <strong>of</strong> Corps jurisdiction (upland sites), and are part <strong>of</strong><br />
<strong>City</strong> <strong>of</strong> <strong>Inglewood</strong> <strong>General</strong> <strong>Plan</strong> <strong>Update</strong> Technical Background Report<br />
3.3-5
Chapter 3 Infrastructure<br />
construction activity that disturbs one or more acres <strong>of</strong> land are covered by this <strong>General</strong><br />
Permit.<br />
It is the responsibility <strong>of</strong> the landowner to obtain coverage under this <strong>General</strong> Permit<br />
prior to commencement <strong>of</strong> construction activities. To obtain coverage, the landowner<br />
must file a NOI with a vicinity map and the appropriate fee with the State Board.<br />
Coverage under this permit does not occur until the applicant develops an adequate<br />
SWPPP for the project. Section A <strong>of</strong> the <strong>General</strong> Permit outlines the required contents <strong>of</strong><br />
a SWPPP. For proposed construction activity on easements or on nearby property by<br />
agreement or permission, the entity responsible for the construction activity is required to<br />
file an NOI and filing fee and is responsible for development <strong>of</strong> the SWPPP, all <strong>of</strong> which<br />
must occur prior to commencement <strong>of</strong> construction activities. This <strong>General</strong> Permit does<br />
not apply to storm water discharges from the following:<br />
• Tribal Lands<br />
• The Lake Tahoe Hydrologic Unit<br />
• Construction by municipal entities with a population under 100,000<br />
• Construction under one acre, unless part <strong>of</strong> a larger common plan <strong>of</strong> development<br />
or sale<br />
• Projects covered by an individual NPDES Permit for storm water discharges<br />
associated with construction activity, and<br />
• Landfill construction that is subject to the general industrial permit.<br />
Local Regulations<br />
<strong>Inglewood</strong> Municipal Code<br />
The <strong>City</strong>’s Storm Water and Urban Run<strong>of</strong>f Controls ordinance includes the following<br />
requirements for owners/operators <strong>of</strong> industrial/commercial facilities: obtain permits for<br />
all connections to the storm drain; discharges to the storm drain must be composed<br />
entirely <strong>of</strong> storm water except as permitted; implement appropriate BMPs; regularly<br />
sweep and clean all parking lots with 25 or more spaces; and comply with all applicable<br />
NPDES requirements.<br />
• Issues<br />
• Local drainage problems may occur throughout the <strong>City</strong>. Staff is aware <strong>of</strong> local<br />
drainage threats such as storm water run<strong>of</strong>f entering culverts or underground into<br />
storm sewers.<br />
• Lack <strong>of</strong> maintenance can contribute to the flood hazard in urban areas.<br />
• References<br />
Sanitation Districts <strong>of</strong> Los Angeles County. 2006. Website: www.lacsd.org, accessed<br />
March 31.<br />
United States Environmental Protection Agency. 2006. “Clean Water Act, Section 402:<br />
3.3-6<br />
<strong>City</strong> <strong>of</strong> <strong>Inglewood</strong> <strong>General</strong> <strong>Plan</strong> <strong>Update</strong> Technical Background Report
3.3 Storm Drains<br />
National Pollutant Discharge Elimination System. Website:<br />
http://www.epa.gov/owow/wetlands/laws/section402.html, accessed March 31.<br />
Ballona Creek Watershed Management <strong>Plan</strong><br />
<strong>City</strong> <strong>of</strong> <strong>Inglewood</strong>, Storm Water and Urban Run<strong>of</strong>f Controls Ordinance.<br />
<strong>City</strong> <strong>of</strong> <strong>Inglewood</strong>, Urban Water Management <strong>Plan</strong>, December 2005<br />
<strong>City</strong> <strong>of</strong> <strong>Inglewood</strong>, Water Master <strong>Plan</strong>, September 2003.<br />
Urban Water Management <strong>Plan</strong>, http://www.westbasin.org/pdf/UWMP_2005.pdf<br />
<strong>City</strong> <strong>of</strong> <strong>Inglewood</strong> <strong>General</strong> <strong>Plan</strong> <strong>Update</strong> Technical Background Report<br />
3.3-7
3.4 Solid Waste<br />
3.4 SOLID WASTE<br />
This section describes existing solid waste management and resource recovery systems for<br />
the <strong>City</strong> <strong>of</strong> <strong>Inglewood</strong>. In addition, a discussion <strong>of</strong> current local and regional regulations<br />
regarding the collection and disposal <strong>of</strong> solid waste is provided. Information for this<br />
section is based on the <strong>City</strong>’s Resource Allocation <strong>Plan</strong>, Source Reduction and Recycling<br />
Element, data from the Integrated Waste Management Board, and conversations with<br />
Department <strong>of</strong> Public Works staff.<br />
• Existing Conditions<br />
The residential solid waste generated in the <strong>City</strong> <strong>of</strong> <strong>Inglewood</strong> makes up 48 percent <strong>of</strong> the<br />
waste disposed to the landfills, and the commercial sector makes up the remaining<br />
52 percent <strong>of</strong> the waste disposed to the landfills. The primary facilities that are currently<br />
serving the <strong>City</strong> are the Puente Hills Landfill and the Carson Transfer Station which<br />
transfers solid waste to the El Sobrante Landfill located in Riverside County, California.<br />
The majority <strong>of</strong> residential solid waste generated in the <strong>City</strong> <strong>of</strong> <strong>Inglewood</strong> is collected and<br />
transported to a <strong>City</strong>-owned transfer station. Refuse is then consolidated and transported<br />
to a materials recovery facility where recycling materials are then sorted from refuse by<br />
machines and other methods. The remaining solid waste is then taken to one <strong>of</strong> three<br />
County landfills. Details regarding waste haulers, transfer stations, recycling facilities, and<br />
landfills are provided below.<br />
Solid Waste Haulers<br />
The <strong>City</strong> <strong>of</strong> <strong>Inglewood</strong> Municipal Code states that no person shall provide commercial<br />
solid waste handling services or conduct a solid waste enterprise in the <strong>City</strong> without<br />
having been awarded a non-exclusive solid waste franchise and entered into an agreement<br />
with the <strong>City</strong>. As part <strong>of</strong> its franchise agreement, all solid waste haulers that serve the <strong>City</strong><br />
are prohibited from transporting any waste, residential, commercial, or industrial, outside<br />
<strong>of</strong> County limits. In the <strong>City</strong> <strong>of</strong> <strong>Inglewood</strong>, Waste Management is the only authorized<br />
solid waste hauler. The Refuse Division <strong>of</strong> the <strong>City</strong> <strong>General</strong> Services Department collects<br />
refuse from the majority <strong>of</strong> single-family homes and some multi-family complexes,<br />
commercial and industrial sectors within the <strong>City</strong>.<br />
Transfer Stations<br />
Transfer stations are facilities where refuse is sorted from recyclable material, and the<br />
residue is then transported to landfills that serve the residents <strong>of</strong> the County <strong>of</strong> Los<br />
Angeles. The Carson Transfer Station has 5,300 tons <strong>of</strong> capacity available under its daily<br />
capacity limit. The Carson transfer station transfers the solid waste to the El Sobrante<br />
Landfill located in Riverside County. Additional incidental volume is also delivered to a<br />
variety <strong>of</strong> other facilities from self haul generators.<br />
<strong>City</strong> <strong>of</strong> <strong>Inglewood</strong> <strong>General</strong> <strong>Plan</strong> <strong>Update</strong> Technical Background Report<br />
3.4-1
Chapter 3 Infrastructure<br />
Waste Management has 346 strategically located transfer stations to consolidate, compact,<br />
and load waste from collection vehicles into long-haul trailers or rail cars for transport to<br />
landfills. This operation improves the utilization <strong>of</strong> collection equipment by minimizing<br />
transportation time and efficiently moving large volumes <strong>of</strong> waste to disposal sites. 30<br />
Table 3.4-1<br />
Transfer Station<br />
Transfer Stations<br />
Carson Transfer Station & Materials Recovery Facility/Waste<br />
Management, Inc.<br />
<strong>City</strong> <strong>of</strong> <strong>Inglewood</strong> Transfer Station/<strong>City</strong> <strong>of</strong> <strong>Inglewood</strong><br />
SOURCE:<br />
Los Angeles Department <strong>of</strong> Public Works,<br />
http://ladpw.org/swims/general/facilities/nearestfacilitylist.asp<br />
Address<br />
321 W. Francisco St.<br />
Carson, CA 90745<br />
(310) 217-6300<br />
222 W. Beach Ave.<br />
<strong>Inglewood</strong>, CA 90302<br />
(310) 412-5278<br />
Landfills<br />
There are two landfills in Los Angeles County that currently serve the <strong>City</strong> <strong>of</strong> <strong>Inglewood</strong>:<br />
the Puente Hills Landfill and the El Sobrante Landfill. In 2004, the <strong>City</strong> <strong>of</strong> <strong>Inglewood</strong><br />
disposed <strong>of</strong> approximately 99,757, 34 tons <strong>of</strong> solid waste, and in 2005, approximately<br />
82,180.79 tons 31 . The disposal volumes are trending down 17 percent due to the new<br />
recycling programs <strong>of</strong>fered by the <strong>City</strong>. 32<br />
Waste Management also has the largest number <strong>of</strong> landfills in the industry. The<br />
Company's 293 active landfill sites have an average remaining permitted life <strong>of</strong> 22 years.<br />
Driven by federal, state and local regulatory requirements, the company utilizes advanced<br />
engineering, construction and monitoring methods to manage these landfills to the strict<br />
standards <strong>of</strong> safety and environmental responsibility required <strong>of</strong> the company.<br />
Puente Hills Landfill<br />
The Puente Hills Landfill is a critical component <strong>of</strong> the integrated waste management<br />
system serving Los Angeles County. The landfill is located in unincorporated Los Angeles<br />
County, south <strong>of</strong> the intersection <strong>of</strong> the Pomona (60) and San Gabriel (605) Freeways,<br />
adjacent to the <strong>City</strong> <strong>of</strong> Whittier. It has been owned and operated by the Sanitation<br />
Districts <strong>of</strong> Los Angeles County (LACSD) since 1970. The landfill operation includes<br />
environmentally sound disposal, recycling, and materials and energy recovery. A major<br />
part <strong>of</strong> LACSD's strategy for tackling waste management challenges into the future<br />
30 http://www.city<strong>of</strong>inglewood.org/civica/inc/displayblobpdf2.asp?BlobID=2007<br />
31 Angela Williams, Solid Waste Division, <strong>City</strong> <strong>of</strong> <strong>Inglewood</strong>, personal communication, March 13, 2006.<br />
32 Ibid.<br />
3.4-2<br />
<strong>City</strong> <strong>of</strong> <strong>Inglewood</strong> <strong>General</strong> <strong>Plan</strong> <strong>Update</strong> Technical Background Report
3.4 Solid Waste<br />
includes the transition to waste-by-rail. 33 The Puente Hills Landfill has a remaining<br />
capacity <strong>of</strong> 38 million tons at an average rate <strong>of</strong> 12,000 tons per day.<br />
El Sobrante Landfill<br />
The El Sobrante Landfill opened in 1986 as a partnership between Riverside County and<br />
Waste Management. The landfill area constitutes approximately 645 acres <strong>of</strong> the total<br />
property, while undisturbed open spaces account for approximately 688 acres, and is<br />
located south <strong>of</strong> Lake Matthews in western Riverside County, California. In August 2001,<br />
the facility received a major expansion and currently has 495 acres permitted for disposal<br />
activities with more than 165 million cubic yards <strong>of</strong> remaining capacity. The El Sobrante<br />
Landfill can accept up to 10,000 tons per day <strong>of</strong> waste from the counties <strong>of</strong> Riverside,<br />
Los Angeles, Orange, San Diego, and San Bernardino, and currently has 25,000 tons <strong>of</strong><br />
weekly capacity available 34 . Waste that is generated outside <strong>of</strong> Riverside County and<br />
disposed <strong>of</strong> at the El Sobrante Landfill provides a significant source <strong>of</strong> funding to the<br />
citizens <strong>of</strong> Riverside County for use in many local projects.<br />
Generation <strong>of</strong> Waste by Types<br />
Residential Waste<br />
A total <strong>of</strong> 39,000 housing units in just under nine square miles that make up the <strong>City</strong> <strong>of</strong><br />
<strong>Inglewood</strong> dispose <strong>of</strong> 48 percent, or 57,000 tons, <strong>of</strong> the overall waste deposited at<br />
landfills. The average resident, the source <strong>of</strong> this tonnage, disposes three pounds <strong>of</strong> waste<br />
per day. Other organic materials, which include items such as food, leaves, and grass,<br />
typically make up 45 percent <strong>of</strong> all waste disposed <strong>of</strong> by single- or multi-family residents.<br />
This means that the grassy areas and tree-lined streets contribute to the largest and most<br />
commonly found component <strong>of</strong> the disposal stream.<br />
Of the 45 percent in organic waste, food waste makes up 17 percent <strong>of</strong> that figure. With<br />
residential waste, as can be expected in most active metropolitan regions, paper<br />
periodicals, being dispensed <strong>of</strong> once circulated and read, are <strong>of</strong>ten readily found<br />
representing 27 percent <strong>of</strong> <strong>Inglewood</strong>’s waste by-product. High-density polyethylene, and<br />
polyethylene terephthalate plastics (HDPE and PETE plastic containers), respectively<br />
represent <strong>Inglewood</strong>’s third largest material type disposed <strong>of</strong> by residences, with a<br />
nine percent constant in the overall contribution to the disposal stream. Ten percent <strong>of</strong><br />
<strong>Inglewood</strong>’s residential waste is derived from construction and demolition waste and<br />
metals such as tin and steel cans.<br />
33 Puente Hills Landfill websitehttp://www.lacsd.org/swaste/Facilities/Open/puntehls.htm;<br />
http://www.lacsd.org/swaste/Publications/NewPHLFbrochure.htm#Introduction<br />
34 Angela Williams, personal communication, March 13, 2006.<br />
<strong>City</strong> <strong>of</strong> <strong>Inglewood</strong> <strong>General</strong> <strong>Plan</strong> <strong>Update</strong> Technical Background Report<br />
3.4-3
Chapter 3 Infrastructure<br />
Table 3.4-2<br />
Overall Residential Waste Stream by Material Type<br />
Material Type Overall Residential Percentage Solid waste tonnage<br />
Paper 27.4% 13,618<br />
Glass 4.0% 2,002<br />
Metal 4.6% 2,295<br />
Plastic 8.8% 4,389<br />
Other organic 45.0% 22,323<br />
Construction and Demolition 4.5 2,222<br />
Household Hazardous Waste 0.3 160<br />
Special Waste 1.2 615<br />
Mixed Residue 4.0 1,985<br />
SOURCE: California Integrated Waste Management Board<br />
Last updated: August 14, 2003<br />
Commercial Waste<br />
In the <strong>City</strong> <strong>of</strong> <strong>Inglewood</strong>, local businesses disposed <strong>of</strong> 62,000 tons <strong>of</strong> waste in landfills.<br />
Employees <strong>of</strong> those same organizations produced eight pounds <strong>of</strong> waste per day,<br />
compared to the three pounds produced per day by each residence. The commercial<br />
sector makes up 52 percent <strong>of</strong> the waste disposed to the landfills. Waste composition<br />
studies conducted by the State Department <strong>of</strong> Integrated Waste Management Board show<br />
that paper, food waste, food contaminated paper, and waxy corrugated cardboard made<br />
up the largest segment <strong>of</strong> commercial waste that has no recycling system [Draft Solid<br />
Waste Management Report, and <strong>Plan</strong> <strong>of</strong> Action Fiscal Year 2003-2004]. The <strong>City</strong> has<br />
identified 40,000 tons <strong>of</strong> paper, food waste, and food-contaminated paper in the <strong>City</strong>’s<br />
commercial waste stream. 35<br />
Waste Diversion Rate<br />
The diversion rate is defined as the percentage <strong>of</strong> total waste that a city diverts from<br />
being disposed at permitted landfills and transformation facilities through reduction,<br />
reuse, recycling and composting programs. Cities were required by law to achieve<br />
25 percent diversion by 1995 and 50 percent diversion by the year 2000. 36<br />
35 <strong>City</strong> <strong>of</strong> <strong>Inglewood</strong>, Draft Solid Waste Management Report, and <strong>Plan</strong> <strong>of</strong> Action Fiscal Year 2003-2004, p<br />
1-34, http://www.city<strong>of</strong>inglewood.org/civica/inc/displayblobpdf2.asp?BlobID=2007<br />
36 [Diversion: For waste measurement purposes, diversion is any combination <strong>of</strong> waste prevention (source<br />
reduction), recycling, reuse and composting activities that reduces waste disposed at permitted landfills and<br />
transformation facilities. Diversion is achieved through the implementation <strong>of</strong> diversion programs.]<br />
3.4-4<br />
<strong>City</strong> <strong>of</strong> <strong>Inglewood</strong> <strong>General</strong> <strong>Plan</strong> <strong>Update</strong> Technical Background Report
3.4 Solid Waste<br />
Table 3.4-3<br />
Overall Commercial Waste Stream By Material Type<br />
Material Type<br />
Annual Disposal Tonnage<br />
Percent <strong>of</strong> Commercial<br />
Stream<br />
Food 9,891 18.2%<br />
Remainder/Composite Paper 6,770 12.5%<br />
Uncoated Corrugated Cardboard 3,572 6.6%<br />
Film plastic 2,529 4.7%<br />
Leaves and grass 2,501 4.6%<br />
Remainder/composite organic 2,414 4.4%<br />
Other miscellaneous paper 2,312 4.3%<br />
Lumber 2,094 3.9%<br />
Newspaper 2,025 3.7%<br />
Remainder/composite metal 1,513 2.8%<br />
White ledger 1,429 2.6%<br />
Textiles 1,321 2.4%<br />
Other ferrous 1,266 2.3%<br />
Bulky items 1,175 2.2%<br />
Other <strong>of</strong>fice paper 1,126 2.1%<br />
Magazines and Catalogs 1,020 1.9%<br />
Durable plastic 832 1.5%<br />
Remainder/composite plastic 813 1.5%<br />
Gypsum 784 1.4%<br />
Clear glass bottles and containers 663 1.2%<br />
Remainder/composite construction and demolition 591 1.1%<br />
Tin/steel cans 495 0.9%<br />
Rock, soil, and Fines 474 0.9%<br />
HDPE containers 418 0.8%<br />
Computer paper 286 0.5%<br />
Tires 252 0.5%<br />
Concrete 246 0.5%<br />
SOURCE: California Integrated Waste Management Board<br />
Last updated: May 12, 2003<br />
Table 3.4-4 below indicates the California Integrated Waste Management Board’s<br />
evaluation <strong>of</strong> <strong>Inglewood</strong>’s progress in implementing waste diversion and reduction<br />
programs from goal year 1995 to goal year 2000. As a result, the <strong>City</strong> has initiated several<br />
programs, including three cart separation system, e-waste recycling, household hazardous<br />
waste disposal program, and white goods recycling program. More recent information<br />
from the <strong>City</strong> reports a diversion rate <strong>of</strong> 46 percent in 2004.<br />
<strong>City</strong> <strong>of</strong> <strong>Inglewood</strong> <strong>General</strong> <strong>Plan</strong> <strong>Update</strong> Technical Background Report<br />
3.4-5
Chapter 3 Infrastructure<br />
Table 3.4-4<br />
Diversion Rate, <strong>City</strong> <strong>of</strong> <strong>Inglewood</strong><br />
Reporting Year<br />
Diversion rate<br />
1995 28<br />
1996 36<br />
1997 29<br />
1998 34<br />
1999 45<br />
2000 42<br />
2001 44<br />
Source: California Integrated Waste Management Board<br />
• Regulatory Setting<br />
State Regulations<br />
Assembly Bill 939<br />
The State Legislature, through Assembly Bill 939, The California Integrated Waste<br />
Management Act <strong>of</strong> 1989, mandated that all cities and counties prepare, adopt, and<br />
submit a comprehensive solid waste management plan to the County. The plan must<br />
address and detail each individual community’s efforts and intended policies in the areas<br />
<strong>of</strong> waste characterization, source reduction, recycling, composting, solid waste facilities,<br />
education/public information, funding, special wastes, and hazardous wastes. The law<br />
also mandates that communities meet certain specific identified targets for percentages <strong>of</strong><br />
waste reduction and recycling over specific identified targets for percentages <strong>of</strong> waste<br />
reduction and recycling over specified time periods (25 percent by 1995 and 50 percent<br />
by the year 2000.)<br />
AB 939 further requires each city to conduct a Solid Waste Generation Study and to<br />
prepare annually a Source Reduction and Recycling Element (SRRE) to describe how it<br />
will reach its goals. The <strong>City</strong> <strong>of</strong> Los Angeles has also prepared a Solid Waste Management<br />
Policy <strong>Plan</strong> (CiSWMPP), which was adopted by the <strong>City</strong> Council in November 1994. The<br />
CiSWMPP is a long-term planning document containing goals, objectives, and policies<br />
for solid waste management for the <strong>City</strong>. It specifies citywide diversion goals and disposal<br />
capacity needs.<br />
Local Regulations<br />
<strong>City</strong> <strong>of</strong> <strong>Inglewood</strong> Municipal Code<br />
In order to fulfill the requirements <strong>of</strong> the State mandate, the <strong>City</strong> <strong>of</strong> <strong>Inglewood</strong> has<br />
adopted <strong>City</strong> ordinances related to solid waste management. Section 7-5 <strong>of</strong> the <strong>City</strong><br />
Municipal Code (Solid Waste Ordinance 2370 6-3-79) 37 requires businesses that provide<br />
37 <strong>City</strong> <strong>of</strong> <strong>Inglewood</strong> Municipal Code, Ordinance 2370 6-3-79.<br />
3.4-6<br />
<strong>City</strong> <strong>of</strong> <strong>Inglewood</strong> <strong>General</strong> <strong>Plan</strong> <strong>Update</strong> Technical Background Report
3.4 Solid Waste<br />
commercial solid waste handling services in <strong>City</strong> limits to obtain a franchise in order to<br />
operate. The ordinance states that because State law requires the <strong>City</strong> to substantially<br />
reduce the amount <strong>of</strong> solid waste it sends to landfills, and the <strong>City</strong> is required to report to<br />
the State the amount <strong>of</strong> materials diverted from landfills in compliance with State law, the<br />
<strong>City</strong> must be able to regulate the collection <strong>of</strong> solid waste from residential and<br />
commercial premises through the requirements <strong>of</strong> a franchise.<br />
• Issues<br />
• The <strong>City</strong> failed to meet new waste diversion and recycling services needed to meet<br />
the State’s 50 percent waste diversion goal and faces possible punitive State fines<br />
and other penalties.<br />
• References<br />
<strong>Inglewood</strong>, <strong>City</strong> <strong>of</strong>. <strong>Inglewood</strong>, CA Municipal Code. Website:<br />
http://www.qcode.us/codes/inglewood/view.php?topic=7-5&showAll=1, March<br />
19.<br />
<strong>Inglewood</strong>, <strong>City</strong> <strong>of</strong>. 2003. Personal communication with Angela Willams, Solid Waste<br />
Division, <strong>City</strong> <strong>of</strong> <strong>Inglewood</strong>, 13 March.<br />
Waste Management website, Lists <strong>of</strong> landfills,<br />
http://www.wm.com/WM/community/WHC/WHC_Sites.asp; and<br />
http://www.wm.com/Templates/FAC2969/index.asp<br />
Sanitation Districts <strong>of</strong> Los Angeles County,<br />
http://www.lacsd.org/swaste/Facilities/Open/puntehls.htm<br />
Puente Hills Brochure,<br />
http://www.lacsd.org/swaste/Publications/NewPHLFbrochure.htm#Description<strong>of</strong><br />
Operations<br />
California Integrated Waste Management Board, Board Meeting, November 9-10, 2004,<br />
Agenda Item 24, pgs. 24-1 to 24-5.<br />
<strong>City</strong> <strong>of</strong> <strong>Inglewood</strong>, Draft Solid Waste Management Report, and <strong>Plan</strong> <strong>of</strong> Action Fiscal<br />
Year 2003–2004, p 1-34.<br />
<strong>City</strong> <strong>of</strong> <strong>Inglewood</strong> <strong>General</strong> <strong>Plan</strong> <strong>Update</strong> Technical Background Report<br />
3.4-7
3.5 Electricity<br />
3.5 ELECTRICITY<br />
This section defines the existing energy service providers <strong>of</strong> the <strong>City</strong> <strong>of</strong> <strong>Inglewood</strong>,<br />
specifically electricity services. Information was obtained from discussions with the<br />
service providers and <strong>City</strong> staff.<br />
• Existing Conditions<br />
Electrical Energy<br />
Electrical energy is supplied to the <strong>City</strong> <strong>of</strong> <strong>Inglewood</strong> by Southern California Edison<br />
(SCE). SCE currently operates one substation within the <strong>City</strong>, the <strong>Inglewood</strong> Substation<br />
that provides power to the <strong>City</strong> <strong>of</strong> <strong>Inglewood</strong> via SCE conduits and overhead lines.<br />
Electricity is a “reactive” utility, meaning it is provided on an as-needed basis to<br />
customers within existing structures in the <strong>City</strong>. For new construction, the provision <strong>of</strong><br />
service may require a permit. 38<br />
• Regulatory Setting<br />
Federal Regulations<br />
Federal Energy Regulatory Commission<br />
The Federal Energy Regulatory Commission duties include the regulation <strong>of</strong> the<br />
transmission and sale <strong>of</strong> electricity in interstate commerce, licensing <strong>of</strong> hydroelectric<br />
projects, and oversight <strong>of</strong> related environmental matters.<br />
State Regulations<br />
California Public Utilities Commission (CPUC)<br />
CPUC Decision 95-08-038 contains the rules for the planning and construction <strong>of</strong> new<br />
transmission facilities, distribution facilities, and substations. The Decision requires<br />
permits for the construction <strong>of</strong> certain power line facilities or substations if the voltages<br />
would exceed 50 kV or the substation would require the acquisition <strong>of</strong> land or an increase<br />
in voltage rating above 50 kV. Distribution lines and substations with voltages less than<br />
50 kV need not comply with this Decision; however, the utility must obtain any<br />
nondiscretionary local permits required for the construction and operation <strong>of</strong> these<br />
projects. CEQA compliance is required for construction <strong>of</strong> facilities constructed in<br />
accordance with the Decision.<br />
38 Vivian Parker, personal communication, 2006, March 13.<br />
<strong>City</strong> <strong>of</strong> <strong>Inglewood</strong> <strong>General</strong> <strong>Plan</strong> <strong>Update</strong> Technical Background Report<br />
3.5-1
Chapter 3 Infrastructure<br />
Title 20 and Title 24, California Code <strong>of</strong> Regulations (CCR)<br />
Title 20, Public Utilities and Energy, contains the regulations related to power plant siting<br />
certification. Title 24, California Building Standards, contains the energy efficiency<br />
standards related to residential and nonresidential buildings. Title 24 standards are based,<br />
in part, on a State mandate to reduce California’s energy demand.<br />
In accordance with Figure 66473.1 <strong>of</strong> the Subdivision Map Act, Figure 19.24.110, Energy<br />
Conservation, requires subdivisions <strong>of</strong> five or more lots, other than condominium<br />
conversions, to provide for, to the extent feasible, future passive or natural heating or<br />
cooling opportunities in the subdivision. The <strong>City</strong>, by State law is responsible for<br />
implementing a Subdivision Map Act.<br />
Local Regulations<br />
<strong>City</strong> <strong>of</strong> <strong>Inglewood</strong> Municipal Code<br />
Chapter 15.32, Underground Utilities, requires the removal <strong>of</strong> poles, overhead wires and<br />
associated overhead structures within designated areas <strong>of</strong> the <strong>City</strong> and the underground<br />
installation <strong>of</strong> wires and facilities for supplying electric, communication or similar or<br />
associated service.<br />
• Issues<br />
• There is an issue <strong>of</strong> aesthetic in retaining electrical services in above-ground<br />
transmission lines.<br />
• References<br />
Parker, Vivian. 2006. Personal communication, March 13.<br />
<strong>Inglewood</strong>, <strong>City</strong> <strong>of</strong>. 2006. Municipal Code. Website:<br />
http://qcode.us/codes/inglewood/main.php, accessed March 15.<br />
California Public Utilities Commission. 2006. Website:<br />
http://www.cpuc.ca.gov/static/documents/index.htm, accessed March 15.<br />
California Code <strong>of</strong> Regulations. “Title 20,” 2006. Website:<br />
http://www.energy.ca.gov/siting/title20/index.html, accessed March 15.<br />
California Code <strong>of</strong> Regulations. “Title 20,” 2006. Website:<br />
http://www.bsc.ca.gov/title_24.html, accessed March 15.<br />
3.5-2<br />
<strong>City</strong> <strong>of</strong> <strong>Inglewood</strong> <strong>General</strong> <strong>Plan</strong> <strong>Update</strong> Technical Background Report
3.6 Natural Gas<br />
3.6 NATURAL GAS<br />
This section defines the existing energy service providers <strong>of</strong> the <strong>City</strong> <strong>of</strong> <strong>Inglewood</strong>,<br />
specifically natural gas services. Information was obtained from discussions with the<br />
Southern California Gas Company, and websites.<br />
• Existing Conditions<br />
Natural Gas<br />
Natural Gas is supplied to the <strong>City</strong> <strong>of</strong> <strong>Inglewood</strong> by the Southern California Gas<br />
Company (So Cal Gas). So Cal Gas is the nation's largest natural gas distribution utility.<br />
Natural gas is a “fossil fuel,” indicating that it comes from the ground, similar to other<br />
hydrocarbons such as coal or oil. Currently, SCG maintains transmission and distribution<br />
lines throughout the <strong>City</strong>. Most lines operate at a medium pressure <strong>of</strong> approximately 30<br />
to 60 pounds per square inch (psi). Virtually all streets within the <strong>City</strong> have a buried<br />
pipeline that is part <strong>of</strong> the So Cal Gas network.<br />
The Public Utilities Commission (PUC) regulates So Cal Gas and is the default provider,<br />
required by State law, for natural gas delivery to the <strong>City</strong>. So Cal Gas has the capacity and<br />
resources to deliver gas except in certain situations that are noted in state law. As<br />
development occurs, SCG will continue to extend its service to accommodate<br />
development and supply the necessary gas lines.<br />
So Cal Gas does not base its service levels on the demands <strong>of</strong> the planning area; rather it<br />
makes periodic upgrades to provide service for particular projects and new development.<br />
Approximately two months before construction commences on a project, So Cal Gas<br />
requests that the developer contact them with detailed information about the project’s<br />
natural gas requirements. If necessary, So Cal Gas customizes pipelines and mains to<br />
better serve newly constructed facilities. The cost for such service differs from project to<br />
project. So Cal Gas is continuously expanding its network <strong>of</strong> gas pipelines to meet the<br />
needs <strong>of</strong> new commercial and residential developments in Southern California.<br />
Natural Gas Units<br />
Natural gas is usually sold by heat content, as opposed to volume. The standard units for<br />
buying and selling gas are based on the maximum heat produced by burning the fuel,<br />
known as the higher heating value. So Cal Gas bills retail fuel customers based on their<br />
fuel consumption measured in therms. By contrast, gas is traded in wholesale energy<br />
markets in quantities <strong>of</strong> millions <strong>of</strong> British Thermal Units (btu), also known as decatherms<br />
(by definition, a therm equals 1/10th <strong>of</strong> one mmbtu).<br />
<strong>City</strong> <strong>of</strong> <strong>Inglewood</strong> <strong>General</strong> <strong>Plan</strong> <strong>Update</strong> Technical Background Report<br />
3.6-1
Chapter 3 Infrastructure<br />
• Regulatory Setting<br />
California Public Utilities Commission (CPUC)<br />
CPUC Decision 95-08-038 contains the rules for the planning and construction <strong>of</strong> new<br />
transmission facilities, distribution facilities, and substations. The Decision requires<br />
permits for the construction <strong>of</strong> certain power line facilities or substations if the voltages<br />
would exceed 50 kV or the substation would require the acquisition <strong>of</strong> land or an increase<br />
in voltage rating above 50 kV. Distribution lines and substations with voltages less than<br />
50 kV need not comply with this Decision; however, the utility must obtain any<br />
nondiscretionary local permits required for the construction and operation <strong>of</strong> these<br />
projects. CEQA compliance is required for construction <strong>of</strong> facilities constructed in<br />
accordance with the Decision.<br />
Title 20 and Title 24, California Code <strong>of</strong> Regulations (CCR)<br />
Title 20, Public Utilities and Energy, contains the regulations related to power plant siting<br />
certification. Title 24, California Building Standards, contains the energy efficiency<br />
standards related to residential and nonresidential buildings. Title 24 standards are based,<br />
in part, on a State mandate to reduce California’s energy demand.<br />
In accordance with Section 66473.1 <strong>of</strong> the Subdivision Map Act, Section 19.24.110,<br />
Energy Conservation, requires subdivisions <strong>of</strong> five or more lots, other than condominium<br />
conversions, to provide for, to the extent feasible, future passive or natural heating or<br />
cooling opportunities in the subdivision. The <strong>City</strong>, by State law is responsible for<br />
implementing a Subdivision Map Act.<br />
Local Regulations<br />
<strong>Inglewood</strong> Municipal Code<br />
Chapter 15.32, Underground Utilities, requires the removal <strong>of</strong> poles, overhead wires and<br />
associated overhead structures within designated areas <strong>of</strong> the <strong>City</strong> and the underground<br />
installation <strong>of</strong> wires and facilities for supplying electric, communication or similar or<br />
associated service.<br />
• Issues<br />
No issues have been identified pertaining to natural gas services in the <strong>City</strong>.<br />
• References<br />
Southern California Gas Company webpage, http://www.socalgas.com/, Accessed<br />
March 15, 2006.<br />
<strong>City</strong> <strong>of</strong> <strong>Inglewood</strong>, Strategic Opportunities Report, Calisonnet Corporation <strong>Update</strong>d,<br />
9/9/2004<br />
http://www.city<strong>of</strong>inglewood.org/civica/inc/displayblobpdf2.asp?blobID=2568<br />
3.6-2<br />
<strong>City</strong> <strong>of</strong> <strong>Inglewood</strong> <strong>General</strong> <strong>Plan</strong> <strong>Update</strong> Technical Background Report
3.7 Telecommunications<br />
3.7 TELECOMMUNICATIONS<br />
This section describes the existing telecommunications services including telephone,<br />
television, internet, and cellular phone services that are available to the <strong>City</strong> <strong>of</strong> <strong>Inglewood</strong>.<br />
Information for this section is based upon discussions with the service providers.<br />
• Existing Conditions<br />
Telephone Service<br />
Local telephone service is provided by Southwestern Bell Communications (SBC—<br />
formerly Pacific Bell). Several providers, including SBC, provide long distance phone<br />
service to <strong>Inglewood</strong> and also provide internet access via DSL, cable modem, and dial-up<br />
features.<br />
Cable Television Service<br />
The <strong>City</strong> does not have the legal authority to regulate cable television rates. Adelphia,<br />
Comcast or other local service providers charge rates based upon their cost <strong>of</strong> providing<br />
service. The company may increase their rates upon providing a 30-day notice.<br />
Internet Service<br />
Like cellular phone service, the popularity <strong>of</strong> internet service has resulted in<br />
diversification <strong>of</strong> internet service providers (ISP). Depending on the speed <strong>of</strong> connection<br />
desired, <strong>City</strong> residents have a number <strong>of</strong> options for internet service, including service by<br />
Comcast, SBC and local ISPs.<br />
Cellular Phone Service<br />
The popularity <strong>of</strong> cellular phones has resulted in a number <strong>of</strong> companies providing<br />
service to the community. Cellular phone service companies are licensed and monitored<br />
by the California Public Utilities Commission (CPUC).<br />
Cellular phone service providers in the <strong>City</strong> are as follows:<br />
• Cingular Wireless<br />
• Sprint<br />
• Nextel<br />
• T Mobile<br />
• Verizon Wireless<br />
Municipal Area Network<br />
The Municipal Area Network (MAN) is a system <strong>of</strong> fiber-optic cables and electronic<br />
devices in host buildings that provide a gigabit high-speed protocol network serving few<br />
portions <strong>of</strong> the city.<br />
<strong>City</strong> <strong>of</strong> <strong>Inglewood</strong> <strong>General</strong> <strong>Plan</strong> <strong>Update</strong> Technical Background Report<br />
3.7-1
Chapter 3 Infrastructure<br />
• Regulatory Context<br />
Federal Regulations<br />
Telecommunications Act <strong>of</strong> 1996<br />
This law was enacted to promote competition and reduce regulation in order to secure<br />
lower prices and higher quality services for telecommunication consumers and encourage<br />
the rapid deployment <strong>of</strong> new telecommunication technologies.<br />
Local Regulations<br />
<strong>Inglewood</strong> Municipal Code<br />
The <strong>City</strong> <strong>of</strong> <strong>Inglewood</strong> Municipal Code, Section 8-1.17 (Community Antenna Television<br />
System), adopts rules and regulations to govern the operations <strong>of</strong> community antenna<br />
television systems in the <strong>City</strong>. Section 12-1.6.5 (Antennas and Telecommunication<br />
Facilities), provides definitions <strong>of</strong> the telecommunication facilities.<br />
Section 5-34 <strong>of</strong> the <strong>City</strong>’s Municipal Code (Radios, Television and Stereos, Noise<br />
Regulated) ensures consistency with noise regulations while promoting public health,<br />
safety, comfort, convenience, and general welfare <strong>of</strong> the <strong>City</strong>'s residents.<br />
Section 9-70 (Telephone Users Tax) imposes a tax upon every person in the <strong>City</strong>, other<br />
than a telephone corporation, using intrastate, interstate, or international telephone<br />
communication services. The tax imposed by this section is at the rate <strong>of</strong> ten percent <strong>of</strong><br />
the charges made for such services.<br />
These regulations enhance the aesthetic quality and appearance <strong>of</strong> the <strong>City</strong> by maintaining<br />
architectural and structural integrity; and by protecting views and vistas from obtrusive<br />
and unsightly accessory uses and facilities.<br />
• Issues<br />
No issues have been identified related to telecommunications.<br />
• References<br />
<strong>City</strong> <strong>of</strong> <strong>Inglewood</strong> Municipal Code, Ordinance<br />
Phil Morrisio, personal communication, April 19, 2006.<br />
3.7-2<br />
<strong>City</strong> <strong>of</strong> <strong>Inglewood</strong> <strong>General</strong> <strong>Plan</strong> <strong>Update</strong> Technical Background Report
3.8 Circulation<br />
3.8 CIRCULATION<br />
The Circulation section provides the transportation context for the <strong>General</strong> <strong>Plan</strong> by<br />
describing existing circulation and traffic conditions, plans, and policies that have a<br />
bearing on overall mobility in the <strong>City</strong> <strong>of</strong> <strong>Inglewood</strong>. This report serves as reference<br />
material and technical appendix for the Circulation Element.<br />
• Purpose <strong>of</strong> the Element<br />
The fundamental goal <strong>of</strong> the Circulation Element is to lay the groundwork for and<br />
promote the development <strong>of</strong> a coordinated, multi-modal citywide transportation system<br />
to meet the needs <strong>of</strong> all people living, working or visiting the <strong>City</strong> and all economic<br />
segments <strong>of</strong> the community. The <strong>City</strong> must achieve transportation goals while integrating<br />
and maintaining internal consistency with parts <strong>of</strong> the transportation systems that are<br />
under the control <strong>of</strong> other local, regional, and state agencies. The Circulation Element<br />
correlates all transportation issues into a set <strong>of</strong> coherent policies: the goals, objectives,<br />
policies, and programs <strong>of</strong> the element relate directly to other elements and issues<br />
addressed in the <strong>General</strong> <strong>Plan</strong>.<br />
The purpose <strong>of</strong> the Circulation Element is to set forth strategies to support the<br />
production <strong>of</strong> a circulation system consistent with the overall vision specified for the <strong>City</strong>.<br />
A well functioning transportation system in the <strong>City</strong> is <strong>of</strong> vital importance and a high<br />
priority. The State Legislature requires local governments to address this priority while<br />
considering economic, environmental, and fiscal factors and community goals set forth in<br />
the <strong>General</strong> <strong>Plan</strong>. This background report will be used in formulating the circulation<br />
policies and programs and will be reformatted herein to be consistent with the overall<br />
<strong>General</strong> <strong>Plan</strong> program.<br />
• Roadway System<br />
The classification <strong>of</strong> streets establishes a hierarchy <strong>of</strong> function for the circulation system<br />
<strong>of</strong> <strong>Inglewood</strong>. Traffic volume and street widths are not the only factors used for such<br />
classification, particularly in this city where existing narrow streets must <strong>of</strong>ten serve<br />
functions greater than their roadway widths should warrant. The actual use and location<br />
<strong>of</strong> streets are therefore also significant factors in the classification <strong>of</strong> <strong>Inglewood</strong> streets.<br />
Freeways<br />
Freeways are generally considered the most efficient type <strong>of</strong> highway for the movement<br />
<strong>of</strong> vehicles. These facilities were originally intended to serve longer trips <strong>of</strong> regional and<br />
interurban length. Caltrans, the State <strong>of</strong> California’s Department <strong>of</strong> Transportation, is<br />
responsible for the planning, design, construction, and maintenance or improvement <strong>of</strong><br />
freeways.<br />
<strong>City</strong> <strong>of</strong> <strong>Inglewood</strong> <strong>General</strong> <strong>Plan</strong> <strong>Update</strong> Technical Background Report<br />
3.8-1
Chapter 3 Infrastructure<br />
Two freeways either travel through or are immediately adjacent to the <strong>City</strong> <strong>of</strong> <strong>Inglewood</strong>:<br />
• The San Diego Freeway (Interstate 405) serves as a north/south route in the<br />
<strong>Inglewood</strong> area. It consists <strong>of</strong> four general traffic lanes, one auxiliary lane and one<br />
collector/distributor lane in each direction. Caltrans is currently constructing one<br />
high-occupancy vehicle (HOV) lane in each direction in the median <strong>of</strong> this facility.<br />
This facility carries approximately 311,000 vehicles per day.<br />
• The Glenn Anderson Freeway & Transitway (Interstate 105) is an east/west route<br />
along the south edge <strong>of</strong> <strong>Inglewood</strong>. It consists <strong>of</strong> three general traffic lanes and one<br />
HOV lane in each direction. This facility accommodates approximately 250,000<br />
vehicles per day. The Metro Green Line transit route is located in the median <strong>of</strong><br />
this facility.<br />
Major Arterials<br />
Major arterials are the most important surface streets. They function as primary intercity<br />
routes (i.e. continuous routes into, through and out <strong>of</strong> the city) in addition to collecting<br />
and distributing a large portion <strong>of</strong> local traffic. Major arterials are typically designed to<br />
carry over 30,000 vehicles per day which means they should have a minimum <strong>of</strong> two<br />
travel lanes in each direction in addition to a separate median lane to accommodate left<br />
turn movement. However, depending upon traffic volume, particularly during peak traffic<br />
periods, additional travel lanes and/or the prohibition <strong>of</strong> curb parking may be necessary.<br />
The following streets in <strong>Inglewood</strong> are classified as Major Arterials:<br />
• Arbor Vitae Street (west <strong>of</strong> Prairie Avenue)<br />
• Centinela Avenue<br />
• Century Boulevard<br />
• Crenshaw Boulevard<br />
• Florence Avenue<br />
• Hawthorne Boulevard<br />
• Imperial Highway<br />
• La Brea Avenue<br />
• La Cienega Boulevard<br />
• Manchester Boulevard<br />
• Prairie Avenue<br />
• Aviation Boulevard (Manchester Boulevard to Arbor Vitae Street)<br />
• La Tijera Boulevard (La Cienega Boulevard to Knowlton Street)<br />
Minor Arterials<br />
Minor arterials, also referred to as secondary arterials, are similar to major arterials except<br />
that they may be discontinuous within the city, they may carry less traffic volume, and/or<br />
they may serve as extensions <strong>of</strong> other major arterials (e.g. Crenshaw Drive from<br />
Crenshaw Boulevard; or Kareem Court from Manchester Boulevard). Minor arterials are<br />
typically designed to carry 15,000 to 30,000 vehicles per day, which means they should<br />
have a minimum <strong>of</strong> two travel lanes in each direction. A separate median lane to<br />
accommodate left turn movement is desirable if there is sufficient roadway width.<br />
3.8-2<br />
<strong>City</strong> <strong>of</strong> <strong>Inglewood</strong> <strong>General</strong> <strong>Plan</strong> <strong>Update</strong> Technical Background Report
3.8 Circulation<br />
The following streets in <strong>Inglewood</strong> are classified as Minor Arterials:<br />
• Crenshaw Drive<br />
• Eucalyptus Avenue (Beach Avenue to Arbor Vitae Street)<br />
• Fairview Boulevard (La Brea Avenue to Overhill Drive)<br />
• Kareem Court (Forum Road)<br />
• <strong>Inglewood</strong> Avenue (south <strong>of</strong> Manchester Boulevard)<br />
• Lennox Boulevard<br />
• Market Street (Florence Avenue to La Brea Avenue)<br />
• Overhill Drive<br />
• Van Ness Avenue<br />
• West Boulevard (north <strong>of</strong> Florence Avenue)<br />
• 108th Street (east <strong>of</strong> Crenshaw Boulevard)<br />
• 120th Street<br />
• 64 th Place (La Brea Avenue to north <strong>of</strong> 63 rd Street)<br />
Figure 3.8-1 shows the general lane configuration and median treatments for major and<br />
minor arterial facilities located in the <strong>City</strong>.<br />
Collectors<br />
Collectors are transitional streets between arterials and local streets. The function <strong>of</strong> a<br />
collector is to “collect” vehicles from the local street system and transport them to the<br />
arterial system. Collectors, however, also provide some cross-city access (e.g. Hyde Park<br />
Boulevard). Collectors may be designed to carry up to 15,000 vehicles per day, although<br />
3,000 to 10,000 vehicles is more typical. A collector will have at least one travel lane in<br />
each direction, but depending upon specific traffic volume or access function, two travel<br />
lanes in each direction might be utilized.<br />
The following streets in <strong>Inglewood</strong> are classified as Collectors:<br />
• Arbor Vitae Street (east <strong>of</strong> Crenshaw Boulevard)<br />
• Beach Avenue<br />
• Doty Avenue<br />
• Eucalyptus Avenue (north <strong>of</strong> Beach Avenue)<br />
• Eucalyptus Avenue (Arbor Vitae Street to Century Boulevard)<br />
• Fairfax Avenue<br />
• Fairview Boulevard (except La Brea Avenue to Overhill Drive)<br />
• Fir Avenue (Florence Avenue to Manchester Boulevard)<br />
• Freeman Avenue<br />
• Grevillea Avenue<br />
• Hardy Street<br />
• Hillcrest Boulevard<br />
• Hindry Avenue<br />
• Hyde Park Boulevard<br />
• Hyde Park Place<br />
• <strong>Inglewood</strong> Avenue (Florence Avenue to Manchester Boulevard)<br />
• Ivy Avenue<br />
• Juniper Street<br />
• Kelso Street - 90th Street (<strong>Inglewood</strong> Avenue to Crenshaw Boulevard)<br />
<strong>City</strong> <strong>of</strong> <strong>Inglewood</strong> <strong>General</strong> <strong>Plan</strong> <strong>Update</strong> Technical Background Report<br />
3.8-3
Chapter 3 Infrastructure<br />
• La Tijera Boulevard<br />
• Locust Street (Regent Street to Hillcrest Boulevard)<br />
• Myrtle Avenue (Arbor Vitae Street to Century Boulevard)<br />
• Oak Street (Eucalyptus Avenue to Arbor Vitae Street)<br />
• Park Avenue (Warren Lane to Hyde Park Boulevard)<br />
• Regent Street<br />
• Springpark Avenue<br />
• Spruce Avenue (La Brea Avenue to Manchester Boulevard)<br />
• Warren Lane (Centinela Avenue to Park Avenue)<br />
• West Boulevard (north <strong>of</strong> Manchester Boulevard)<br />
• Yukon Avenue<br />
• 5 th Avenue (north <strong>of</strong> Manchester Boulevard)<br />
• 8 th Avenue<br />
• 64 th Street (Springpark Avenue to Garth Avenue)<br />
• 90 th Street (east <strong>of</strong> Crenshaw Boulevard)<br />
• 102 nd Street (east <strong>of</strong> Prairie Avenue)<br />
• 104 th Street<br />
• 108 th Street (Prairie Avenue to Crenshaw Boulevard)<br />
• 79 th Street (From Crenshaw Boulevard to Van Ness Avenue)<br />
• Lemoli Avenue<br />
• Pincay Drive<br />
• Plymouth Street (Beach Street to La Brea Avenue)<br />
• Felton Avenue (95 th Street to 98 th Street)<br />
• Field Avenue (Centinela Avenue to Hargrave Street)<br />
• Hill Street (La Cienega Boulevard to Beach Street)<br />
Operational Characteristics<br />
Level <strong>of</strong> service (LOS) is defined as a quality measure describing operational conditions<br />
within a traffic stream, generally in terms <strong>of</strong> such service measures as speed and travel<br />
time, freedom to maneuver, traffic interruptions, and comfort and convenience. Level <strong>of</strong><br />
service indicators for the highway and roadway system are based on specific<br />
characteristics <strong>of</strong> traffic flow on designated sections <strong>of</strong> roadway during a typical day. For<br />
mainline freeway and roadway segments, these include overall traffic volume, speed and<br />
density. Several physical and operational characteristics <strong>of</strong> the roadway, such as lane<br />
configuration, free-flow speed (typical speed between intersections) and number <strong>of</strong><br />
intersections per mile, are used to determine the vehicular capacity <strong>of</strong> the roadway<br />
segment. When these two sets <strong>of</strong> data are compared, a volume to capacity (V/C) ratio is<br />
calculated. These factors are then converted to an alpha descriptor identifying operating<br />
conditions and expressed as a level <strong>of</strong> service, or LOS, A through F. LOS A identifies the<br />
best operating conditions along a section <strong>of</strong> roadway and is characterized by free-flow<br />
traffic, low volumes and little or no restrictions on maneuverability. LOS F characterizes<br />
forced traffic flow with high traffic densities, slow travel speeds and <strong>of</strong>ten stop-and-go<br />
conditions.<br />
3.8-4<br />
<strong>City</strong> <strong>of</strong> <strong>Inglewood</strong> <strong>General</strong> <strong>Plan</strong> <strong>Update</strong> Technical Background Report
K AREEM CT<br />
CITY <strong>of</strong> INGLEWOOD<br />
<strong>General</strong> <strong>Plan</strong><br />
ARTERIAL STREETS LANES<br />
S L A B R<br />
0.4.1.3.0<br />
1.2.1.2.1<br />
1.2.0.2.1<br />
1.2.1.2.1<br />
1.2.1.3.0<br />
W F L ORE NCE AV<br />
0.2.0.2.0<br />
1.2.1.2.1<br />
0.2.0.2.1<br />
0.2.1.2.0<br />
1.1.0.1.1<br />
S L A CIE NE GA B LVD<br />
1.2.1.2.1<br />
1.1.0.1.1<br />
0.3.1.3.0<br />
0.1.0.1.0 0.2.1.3.0 0.2.1.2.0<br />
0.2.1.2.0<br />
1.1.0.1.1<br />
1.1.1.1.1<br />
S INGL E WOOD AV<br />
1.1.0.1.1<br />
CENT INE L A AV<br />
1.2.1.2.1 0.3.1.3.0<br />
1.2.1.2.1<br />
1.3.1.3.1<br />
1.1.0.1.1<br />
1.3.1.3.1<br />
0.2.1.2.0<br />
1.3.1.3.1<br />
N E UCALYPT US AV<br />
1.2.1.2.1<br />
1.2.1.2.1<br />
0.3.1.3.0<br />
N L A B RE A AV<br />
1.1.1.1.1<br />
S L A B R E A AV<br />
S MAR K E T S T<br />
E MANCHE S T E R B LVD<br />
E F L ORE NCE AV<br />
1.2.1.2.1<br />
S PRAIRIE AV<br />
0.3.1.3.0<br />
0.3.1.3.0<br />
0.2.1.2.0<br />
WE S T B LVD<br />
0.3.1.3.0<br />
CRE NS HAW DR CRE NS HAW B LVD<br />
1.2.1.2.1<br />
0.1.0.1.0<br />
1.1.1.1.1<br />
1.2.1.2.1<br />
1.2.1.2.1<br />
1.1.1.1.1<br />
0.3.1.2.1<br />
1.1.1.1.1<br />
W CE NT URY B LVD<br />
0.3.1.3.0<br />
S VAN NE S S AV<br />
CRE NS HAW B LVD<br />
S VAN NE S S AV<br />
Legend<br />
Street Classification<br />
Metro Rail<br />
Railroad<br />
Minor Streets<br />
Major<br />
Freeway On/Off Ramp<br />
Freeway<br />
<strong>City</strong> Boundary<br />
¬(Ä<br />
1.2.1.2.1<br />
S PRAIRIE AV<br />
0.3.1.2.1<br />
¬(Ä ¬(Ä ¬(Ä<br />
1.2.1.2.1<br />
¬(Ä<br />
¬(Ä ¬(Ä<br />
¬(Ä ¬(Ä<br />
1.2.1.2.1<br />
¬(Ä<br />
CRE NS HAW B LVD<br />
1.2.1.3.0<br />
CR E NS HAW B LVD<br />
1.2.1.3.0<br />
W 108T H S T<br />
0.3.1.3.0<br />
¬(Ĭ(Ĭ(Ä ¬(Ä<br />
1.1.0.1.1<br />
1.2.0.2.1<br />
S VAN NE S S AV<br />
W IMPE RIAL HWY<br />
Source: <strong>City</strong> <strong>of</strong> <strong>Inglewood</strong>, Public Works Department.<br />
Date: May 3, 2006<br />
A Division <strong>of</strong><br />
Not to Scale<br />
Figure 3.8-1
3.8 Circulation<br />
Information detailing the lane configurations, ADT volumes and LOS values for major<br />
roadway facilities located in the <strong>City</strong> <strong>of</strong> <strong>Inglewood</strong> are shown in the Table 3.8-1 below.<br />
This data is based on information obtained from 24-Hour counts conducted by the <strong>City</strong><br />
<strong>of</strong> <strong>Inglewood</strong> in May and June <strong>of</strong> 2005.<br />
Table 3.8-1<br />
Roadway<br />
Average Daily Traffic Volume, Lane Configuration and<br />
Daily Level <strong>of</strong> Service for Major Roadways<br />
Located in the <strong>City</strong> <strong>of</strong> <strong>Inglewood</strong><br />
Segment<br />
ADT Volume<br />
(000’s)<br />
Total No.<br />
<strong>of</strong> Lanes<br />
East/West Facilities<br />
Arbor Vitae St<br />
Aviation Blvd to <strong>Inglewood</strong> Ave 17–18 4 B–C<br />
Eucalyptus Ave to Prairie Ave 13–15 4 C–D<br />
Century Blvd<br />
La Cienega Blvd—Rte 405 Fwy 59 6 E<br />
Rte 405 Fwy—Van Ness Ave 33–43 6 C–D<br />
Florence Ave<br />
Aviation Blvd—Centinela Ave 17–28 4 C–D<br />
Centinela Ave—West Blvd 35–43 4 C–D<br />
Imperial Hwy Prairie Ave—Van Ness Ave 25–35 6 C–D<br />
Lennox Blvd West <strong>of</strong> Prairie Ave 8 4 B–C<br />
Manchester Blvd Aviation Blvd—Van Ness Ave 25–37 6 C–D<br />
North/South Facilities<br />
Aviation Blvd Manchester Blvd—Arbor Vitae St 18 4 C–D<br />
Centinela Ave<br />
La Cienega Blvd—La Brea Ave 32 4 D–E<br />
La Brea Ave—Florence Ave 24–27 4 C–D<br />
Crenshaw Blvd 79th St—Rte 105 Fwy 34–39 6 C–D<br />
Crenshaw Dr Crenshaw Blvd—Manchester Blvd 3 2 A<br />
Eucalyptus Ave<br />
Beach Ave—Florence Ave 15 2 D–E<br />
Florence Ave—Arbor Vitae St 6–7 2 C–D<br />
Hawthorne Blvd Century Blvd—104th St 35 6 B–C<br />
<strong>Inglewood</strong> Ave Manchester Blvd—south <strong>of</strong> Century Blvd 7–15 4 B–C<br />
La Brea Ave 64th St—Century Blvd 22–39 6 C–D<br />
North <strong>of</strong> Fairview Blvd—Industrial Ave 64 6 E<br />
La Cienega Blvd North <strong>of</strong> Florence Ave—Century Blvd 17–27 4 C–D<br />
Century Blvd—Rte 405 S Fwy Ramps 31 4 D–E<br />
Market St Manchester Blvd—Hillcrest Blvd 4 2 A–B<br />
Florence Ave—Regent St 29 4 D–E<br />
Prairie Ave Regent St—Manchester Blvd 33 4 E<br />
Manchester Blvd—Imperial Hwy 28–40 6 C–D<br />
Van Ness Ave<br />
79th St—Century Blvd 16 4 C–D<br />
Century Blvd—Imperial Hwy 16–17 4 B–C<br />
West Blvd Hyde Park Blvd—Redondo Blvd 17 4 C–D<br />
Daily<br />
LOS<br />
<strong>City</strong> <strong>of</strong> <strong>Inglewood</strong> <strong>General</strong> <strong>Plan</strong> <strong>Update</strong> Technical Background Report<br />
3.8-7
Chapter 3 Infrastructure<br />
<strong>City</strong>-Owned Parking Lots<br />
The <strong>City</strong> <strong>of</strong> <strong>Inglewood</strong> currently owns and operates nineteen surface parking lots and two<br />
parking structures located throughout the central business district and along Arbor Vitae<br />
Street. The surface parking lots provide a total <strong>of</strong> 746 parking spaces. This total includes<br />
twelve existing handicap spaces and one van-accessible space. A new surface parking lot<br />
is to be constructed at 670 W. Arbor Vitae Street and will contain 23 parking spaces.<br />
The two parking structures contain a total <strong>of</strong> 786 parking spaces. Also included in this<br />
total are thirteen existing handicap spaces and four van-accessible spaces.<br />
Los Angeles County Metropolitan Transportation Authority<br />
The need for the County to maintain a comprehensive and functional circulation system<br />
over such an enormous geographical area requires a coordinated effort from all <strong>of</strong> the<br />
local municipalities located within Los Angeles County. This is the main objective <strong>of</strong> the<br />
Los Angeles County Metropolitan Transportation Authority (Metro). Metro serves as the<br />
County Transportation Commission and is responsible for allocating and programming<br />
State and Federal funds for regional transportation projects throughout the County.<br />
Metro is governed by a thirteen-member Board <strong>of</strong> Directors comprising the following:<br />
• The five Los Angeles County Supervisors<br />
• The Mayor <strong>of</strong> Los Angeles<br />
• Three Los Angeles mayor-appointed members<br />
• Four city council members representing the other 87 cities in Los Angeles County<br />
• The Governor <strong>of</strong> California appoints one non-voting member<br />
Currently, Metro operates over 2,000 peak-hour buses on an average weekday and has<br />
designed, built and operates over 70 miles <strong>of</strong> Metro Rail service. The Metro Rail system<br />
consists <strong>of</strong> the Metro Red Line subway system, the Metro Blue Line, the Metro Green<br />
Line, and the Metro Gold Line. In total, the Metro Rail system serves 62 rail stations<br />
stretching from Long Beach to downtown Los Angeles to Hollywood, Universal <strong>City</strong> and<br />
North Hollywood in the San Fernando Valley, from downtown Los Angeles to Pasadena,<br />
and from Norwalk to El Segundo and all points in between.<br />
Additionally, Metro funds 16 municipal bus operators and a wide array <strong>of</strong> transportation<br />
projects including bikeways and pedestrian facilities, local roads and highway<br />
improvements, goods movement, Metrolink, and the popular Freeway Service Patrol and<br />
Call Boxes. Recognizing that no one form <strong>of</strong> transit can solve urban congestion<br />
problems, Metro's multimodal approach uses a variety <strong>of</strong> transportation alternatives to<br />
meet the needs <strong>of</strong> the highly diverse populations in the region.<br />
Congestion Management Program<br />
The Congestion Management Program (CMP) was enacted as a part <strong>of</strong> Proposition 111<br />
by voters in 1990. The intent <strong>of</strong> this program was to link land use, transportation and air<br />
quality decisions; develop a partnership among transportation decision makers in<br />
3.8-8<br />
<strong>City</strong> <strong>of</strong> <strong>Inglewood</strong> <strong>General</strong> <strong>Plan</strong> <strong>Update</strong> Technical Background Report
3.8 Circulation<br />
developing multi-modal transportation solutions; and that the CMP be the first step in<br />
identifying congestion relief projects for state gas tax funding. The CMP is managed by<br />
Metro, the designated Congestion Management Agency, with required participation by all<br />
local municipalities.<br />
State legislation requires that the CMP identify a primary system <strong>of</strong> existing and proposed<br />
highways and arterial streets and establish a set <strong>of</strong> minimum level <strong>of</strong> service performance<br />
criteria for these routes. The CMP was also required to set standards for transit service<br />
(bus and rail) and trip reduction programs. Thirdly, the CMP was required to develop a<br />
system to analyze impacts on the regional transportation system as a result <strong>of</strong> land use<br />
decisions made by local jurisdictions. Whenever it is determined that a land use decision<br />
(typically resulting in new or intensified development) will have an impact, measures are<br />
to be imposed upon the development(s) to mitigate any congestion impact. This may<br />
include exacting mitigation fees, that Metro will apply to a capital improvement program,<br />
by which improvements may be made to the CMP-identified highways and streets, transit<br />
systems and other related projects to reduce congestion.<br />
Two routes through the <strong>City</strong> <strong>of</strong> <strong>Inglewood</strong> have been identified as part <strong>of</strong> the CMP<br />
network and are subject to impact analysis and congestion mitigation if necessary:<br />
• Manchester Boulevard and<br />
• San Diego Freeway (Interstate Route 405)<br />
Nearby routes that could be impacted by <strong>Inglewood</strong> developments include Sepulveda<br />
Boulevard (State Route 1) and the Harbor Freeway (Interstate Route 110).<br />
The CMP network also includes arterial monitoring stations that are located at<br />
intersections between CMP arterial routes and other regional significant roadway<br />
facilities. Currently, there are two monitoring stations located within the <strong>City</strong> <strong>of</strong><br />
<strong>Inglewood</strong>. These stations are located at the following intersections:<br />
• Manchester Boulevard at Crenshaw Boulevard<br />
• Manchester Boulevard at La Brea Avenue.<br />
These facilities are currently not included as part <strong>of</strong> the CMP network, but have been<br />
identified for possible inclusion should traffic operations deteriorate in the future.<br />
The CMP also requires each city to annually prepare a Deficiency <strong>Plan</strong> for any portion <strong>of</strong><br />
a CMP system route in its jurisdiction that deteriorates below minimum service standards.<br />
The <strong>Plan</strong> must identify the cause <strong>of</strong> the deficiency and a list <strong>of</strong> measures and/or<br />
improvements needed to re-attain the service standard. Metro will review and accept or<br />
reject each city’s Deficiency <strong>Plan</strong>. If rejected, the <strong>Plan</strong> must be revised by the city to the<br />
satisfaction <strong>of</strong> the Metro.<br />
• Public Transportation<br />
Metro, the Los Angeles County Metropolitan Transportation Authority, is responsible for<br />
public transit service in the <strong>City</strong> <strong>of</strong> <strong>Inglewood</strong>. Currently, Metro has 2,250 buses<br />
<strong>City</strong> <strong>of</strong> <strong>Inglewood</strong> <strong>General</strong> <strong>Plan</strong> <strong>Update</strong> Technical Background Report<br />
3.8-9
Chapter 3 Infrastructure<br />
operating on 191 transit routes, providing service to approximately 1.25 million riders<br />
across Los Angeles County on an average weekday.<br />
Bus Transit<br />
As a part <strong>of</strong> its overall service, Metro operates twenty-one transit routes that travel within<br />
or through the <strong>City</strong> <strong>of</strong> <strong>Inglewood</strong>. These routes include the following:<br />
• Two local routes to Downtown Los Angeles<br />
• Twelve local routes to other areas within the Los Angeles metropolitan area<br />
• Two limited-stop routes<br />
• One express route to Downtown Los Angeles<br />
• One special service route<br />
• Three Metro Rapid routes<br />
These routes are shown in Figure 3.8-2. The following is a list <strong>of</strong> the roadways upon<br />
which bus transit routes are currently operating and the number <strong>of</strong> routes on each<br />
roadway:<br />
Roadway<br />
No. <strong>of</strong> Transit Routes<br />
108 th Street 2<br />
Arbor Vitae Street 1<br />
Centinela Avenue 1<br />
Century Boulevard 3<br />
Crenshaw Boulevard 4<br />
Florence Boulevard 3<br />
Hawthorne Boulevard 1<br />
Hyde Park Boulevard 2<br />
Imperial Highway 1<br />
<strong>Inglewood</strong> Avenue 1<br />
La Brea Avenue 5<br />
La Tijera Boulevard 1<br />
Manchester Boulevard 4<br />
Prairie Avenue 3<br />
Van Ness Avenue 1<br />
I-Line Shuttle Trolley<br />
The “I-Line Shuttle Trolley” is a free transit service <strong>of</strong>fered to any individual residing or<br />
visiting <strong>Inglewood</strong> through the <strong>City</strong>’s Senior Center Transportation programs. The<br />
service operates on weekdays and Saturdays from 10:00 A.M. to 4:30 P.M. and travels<br />
exclusively within the <strong>City</strong> <strong>of</strong> <strong>Inglewood</strong> along the route provided in Figure 3.8-3 below.<br />
3.8-10<br />
<strong>City</strong> <strong>of</strong> <strong>Inglewood</strong> <strong>General</strong> <strong>Plan</strong> <strong>Update</strong> Technical Background Report
CITY <strong>of</strong> INGLEWOOD<br />
<strong>General</strong> <strong>Plan</strong><br />
METRO BUS ROUTES WITHIN THE<br />
CITY OF INGLEWOOD<br />
Source: <strong>City</strong> <strong>of</strong> <strong>Inglewood</strong>, Public Works Department, February 2006.<br />
Date: May 3, 2006<br />
A Division <strong>of</strong><br />
Not to Scale<br />
Figure 3.8-2
S R E DF E R N AV<br />
AL L E Y<br />
N OAK S T<br />
S OAK S T<br />
N CE DAR S T<br />
S CE DAR AV<br />
S INGL E WOOD AV<br />
S F IR AV<br />
S F IR AV<br />
AL L E Y<br />
AL L E Y<br />
S WAL NU T S T<br />
AL L E Y<br />
AL L E Y<br />
AL L E Y<br />
AL L E Y<br />
AL L E Y<br />
AL L E Y<br />
AL L E Y<br />
AL L E Y<br />
S MY R T L E AV<br />
AL L E Y<br />
AL L E Y<br />
AL L E Y<br />
CU L L E N WY<br />
NOB E L W Y<br />
CITY <strong>of</strong> INGLEWOOD<br />
<strong>General</strong> <strong>Plan</strong><br />
I-LINE SHUTTLE TROLLEY<br />
W H IL L S DAL E S T<br />
AL L E Y<br />
N B E ACH S T<br />
W VE NICE WY<br />
CE NT INE L A AV<br />
W B E ACH AV<br />
W R AIL R OAD P L<br />
W R E GE NT S T<br />
W QU E E N S T<br />
W OL IVE S T<br />
W K E L S O S T<br />
W ELM AV<br />
W BUCKTHORN ST<br />
S F E LT ON AV<br />
W 95TH ST<br />
W P LY MOU T H S T<br />
W 98T H S T<br />
W 99TH ST<br />
P INE CT<br />
AL L E Y<br />
ALLEY<br />
W MANCH E S T E R B LVD<br />
ALLEY<br />
AL L E Y<br />
AL L E Y<br />
Legend<br />
#<br />
Stops<br />
N OAK S T<br />
W AR B OR VIT AE S T<br />
W 93R D S T<br />
W 96TH ST<br />
W 97T H S T<br />
<strong>City</strong> Boundary<br />
I-Line<br />
W OL IVE S T<br />
22 !<br />
21 !<br />
20 !<br />
S E U CALY P T U S AV<br />
N E U CALY P T U S AV<br />
N L A B R E A AV<br />
16 !<br />
S F IR AV<br />
23 !<br />
N MAR K E T S T<br />
19 !<br />
W F L OR E NCE AV<br />
W L IME S T<br />
W S P R U CE AV<br />
W MAGNOLIA AV<br />
W 94T H S T<br />
S R OSE WOO D AV<br />
W H IL L S DAL E S T<br />
W H AR DY S T<br />
S T R U R O AV<br />
E P LY MOU T H S T<br />
S WALNUT ST<br />
S WAL NU T S T<br />
W IVY AV<br />
S GR E VIL L E A AV<br />
AL L E Y<br />
24 !<br />
18 !<br />
17 !<br />
DAVIS DR<br />
AL L E Y<br />
AL L E Y<br />
14 !<br />
13 !<br />
12 !<br />
11 !<br />
10 !<br />
! 9<br />
! 5<br />
S L A B R E A AV<br />
E B RE T T S T<br />
E H IL L S DAL E S T<br />
25 !<br />
E S T E P NE Y S T<br />
15 !<br />
! 30<br />
! 2<br />
! 3<br />
! 4<br />
26 !<br />
28 !<br />
29 !<br />
! 1<br />
! 8<br />
6!<br />
E H Y DE PAR K B LVD<br />
E WAR R E N L N<br />
E B E ACH AV<br />
E T AMAR ACK AV<br />
E B U CK T H OR N S T<br />
S MAPLE A V<br />
E H AZ E L S T<br />
E IVY AV<br />
AL L E Y<br />
S LAR CH S T<br />
AL L E Y<br />
E 97T H S T<br />
E 98T H S T<br />
N H IL L CR E S T B LVD<br />
E ARBOR VITAE ST<br />
E HARDY ST<br />
E 99TH ST<br />
ALLEY<br />
E 67T H S T<br />
E F L OR E NCE AV<br />
E R E GE NT S T<br />
E K E L S O S T<br />
E L A B R E A DR<br />
! 7<br />
AL L E Y<br />
E 97T H S T<br />
N PARK AV<br />
N P R AIR IE AV<br />
E NU T WOOD S T<br />
S P R AIR IE AV<br />
27 !<br />
P VT<br />
E AE R ICK S T<br />
E QU E E N S T<br />
MANCH E S T E R T E R<br />
MANCH E S T E R DR<br />
S FL OWE R S T<br />
AL L E Y<br />
E 66T H S T<br />
B NS F R R<br />
P VT<br />
N E AS T P K WY<br />
N GAY S T<br />
E 68T H S T<br />
Carlton<br />
Square<br />
VICT OR IA AV<br />
W 85T H S T<br />
W MANCH E S T E R B LVD<br />
KAREEM CT<br />
AL L E Y<br />
R E DONDO B LVD<br />
AR MIT AGE AV<br />
W 74T H P L<br />
W 75T H P L<br />
W 78TH ST<br />
WE S T B LVD<br />
K E NS L E Y DR<br />
B R Y NH U R S T AV<br />
AL L E Y<br />
Briarw<br />
P INCAY DR<br />
P VT<br />
Source: <strong>City</strong> <strong>of</strong> <strong>Inglewood</strong>, Public Works Department, February 2006.<br />
Date: May 3, 2006<br />
A Division <strong>of</strong><br />
Not to Scale<br />
Figure 3.8-3
3.8 Circulation<br />
Para Transit<br />
The <strong>Inglewood</strong> Senior Center also provides a van service that is available to residents <strong>of</strong><br />
the areas <strong>of</strong> <strong>Inglewood</strong>, Hawthorne and Lennox. This service is a demand-based service<br />
with a one-way fare cost <strong>of</strong> $0.50 or a monthly pass <strong>of</strong> $5.00.<br />
The <strong>City</strong> <strong>of</strong> <strong>Inglewood</strong> also maintains a service directory for organizations and agencies<br />
that provide specialized transportation for seniors and persons with disabilities. This<br />
directory currently lists approximately 20 public transit operators and social service<br />
transportation providers that have been registered by the <strong>City</strong> to provide access to<br />
seniors, disabled persons and persons <strong>of</strong> limited means.<br />
Light Rail Transit<br />
Located in the median <strong>of</strong> the Glenn Anderson (I-105) Freeway, the Metro Green Line is<br />
the closest rail transit facility to the <strong>City</strong> <strong>of</strong> <strong>Inglewood</strong>. This system carries approximately<br />
36,000 riders on an average weekday and had approximately 9.65 million boardings in<br />
2005. The Crenshaw Boulevard/I-105 Station is the nearest station, located immediately<br />
south <strong>of</strong> the I-105 Freeway, just east <strong>of</strong> Crenshaw Boulevard. This station provides free<br />
daily parking for up to 500 vehicles and is the connecting point for several Metro bus<br />
routes throughout the <strong>City</strong>.<br />
• Transportation Demand Measures<br />
Park & Ride Facilities<br />
A Park & Ride lot is a group <strong>of</strong> parking spaces designated specifically for the purpose <strong>of</strong><br />
giving people a place to park so they can meet up with their carpool, vanpool or buspool<br />
partners. Some Park & Ride lots are also served by transit. Amenities range from parking<br />
spaces only to security service, bicycle lockers, telephones, restrooms and even child care<br />
centers. A Park & Ride lot can be as big as hundreds <strong>of</strong> parking spaces with all the perks<br />
or as small as a designated area at a church or shopping center parking lot.<br />
Currently, there are no Park & Ride facilities located within the <strong>City</strong> <strong>of</strong> <strong>Inglewood</strong>. The<br />
closest facilities are located at the Crenshaw/I-105 Metro Green Line Station and the<br />
Hawthorne/I-105 Metro Green Line Station, which contain 500 and 600 parking spaces,<br />
respectively. Both facilities are free <strong>of</strong> charge and open for public use 24 hours a day,<br />
seven days a week. The following information contains descriptions <strong>of</strong> each facility,<br />
operating agency and transit connections.<br />
Crenshaw/I-105 Metro Green Line Station<br />
Location and Size: 11901 S. Crenshaw Blvd., 500 spaces<br />
Operator: Metro<br />
Amenities: 10 bike rake spaces and 2 bike lockers<br />
Connecting Transit: Metro Local—210; Metro Rapid—710, 757<br />
<strong>City</strong> <strong>of</strong> <strong>Inglewood</strong> <strong>General</strong> <strong>Plan</strong> <strong>Update</strong> Technical Background Report<br />
3.8-15
Chapter 3 Infrastructure<br />
Hawthorne/I-105 Metro Green Line Station<br />
Location and Size: 11230 S. Acacia St, 600 spaces<br />
Operator: Metro<br />
Amenities: 8 bike rake spaces<br />
Connecting Transit:<br />
Metro Local—40, 119, 126, 212; Metro Limited Stop—312;<br />
Metro Express—442; Metro Rapid—740<br />
Bicycle Routes<br />
Two major issues involving bicycle usage are present in the <strong>City</strong> <strong>of</strong> <strong>Inglewood</strong>: safety and<br />
access. The increasing volume <strong>of</strong> motorized traffic on major arterials and at intersections<br />
throughout the <strong>City</strong> is becoming a safety hazard for bicyclists. These thoroughfares are<br />
becoming barriers to bicycle and pedestrian traffic attempting to cross these corridors.<br />
The lack <strong>of</strong> a comprehensive bicycle network requires cyclists to travel along high-volume<br />
arterial roadways, many <strong>of</strong> which lack appropriate bicycle facilities, without an acceptable<br />
alternative. Many roadways within the <strong>City</strong> do not contain adequate bicycle facilities to<br />
protect cyclists from potential dangerous conditions as reduced visibility and<br />
maneuverability or proximity to high-speed traffic.<br />
Bicycle routes are classified into three separate classes or types. Class I bicycle routes are<br />
generally a paved path that is physically separated from roadway facilities. Many times,<br />
these facilities are located along rail, water or utility corridors. Class II bicycle routes<br />
consist <strong>of</strong> striped one-way lanes along streets, generally located immediately adjacent to<br />
the curb, designated for bicycle use only. Class III bicycle routes are most common and<br />
consist <strong>of</strong> a designated travelway for bicycles that is delineated through the use <strong>of</strong> “bike<br />
route” signs only with no other physical modifications to the roadway.<br />
There currently are no existing bicycle routes located within the <strong>City</strong>. A preliminary<br />
network <strong>of</strong> bicycle routes have been developed by the <strong>City</strong>’s Public Works Department<br />
and is shown in Figure 3.8-4. The location and designation <strong>of</strong> several proposed bicycle<br />
facilities are discussed below:<br />
• Fairview Boulevard, from Springpark Avenue to West Boulevard. A future<br />
connection could be made to the existing bicycle route located along Green Valley<br />
Circle, near the Fox Hills Mall, in the <strong>City</strong> <strong>of</strong> Los Angeles.<br />
• Marlborough Avenue/Vincent Park/Hillcrest Boulevard/La Brea Avenue. This<br />
alignment would act as a north/south spine from which future facilities could<br />
branch and would provide a direct connection between North Park, Vincent Park<br />
and the <strong>Inglewood</strong> Transit Center. A future connection could be made to the<br />
Hawthorne/I-105 Metro Green Line Station.<br />
• Florence Avenue, from Centinela Avenue to West Boulevard. A future connection<br />
could be made to the existing bicycle route located along 74 th Street, in the Hyde<br />
Park neighborhood in the <strong>City</strong> <strong>of</strong> Los Angeles.<br />
3.8-16<br />
<strong>City</strong> <strong>of</strong> <strong>Inglewood</strong> <strong>General</strong> <strong>Plan</strong> <strong>Update</strong> Technical Background Report
CITY <strong>of</strong> INGLEWOOD<br />
<strong>General</strong> <strong>Plan</strong><br />
CITY OF INGLEWOOD PROPOSED BICYCLE ROUTES<br />
Source: <strong>City</strong> <strong>of</strong> <strong>Inglewood</strong>, February 2006.<br />
Date: May 3, 2006<br />
A Division <strong>of</strong><br />
Scale in Miles<br />
Figure 3.8-4
3.8 Circulation<br />
• Arbor Vitae Street, from the Burlington Northern & Santa Fe Railroad tracks, just<br />
west <strong>of</strong> Aviation Boulevard, to Van Ness Avenue. This alignment could function as<br />
an east/west “trunk” route from which future branch routes could originate. A<br />
future connection could be made to the existing bicycle route located along 96 th<br />
Street, near Jesse Owens Park, in the <strong>City</strong> <strong>of</strong> Los Angeles.<br />
The class or type <strong>of</strong> bicycle facility has not been determined for any <strong>of</strong> these proposed<br />
alignments since this decision is based upon the availability <strong>of</strong> adequate right-<strong>of</strong>-way<br />
either within or adjacent to the existing roadways.<br />
• Railroads<br />
The former Burlington Northern & Santa Fe Railroad (BNSF) rail corridor, paralleling<br />
Florence Avenue, is the only existing railroad facility still in operation in the <strong>City</strong> <strong>of</strong><br />
<strong>Inglewood</strong>. This right-<strong>of</strong>-way was purchased by Metro for possible future use as a light<br />
rail or busway facility. It is currently utilized by oil refineries and other industrial uses<br />
located in the South Bay region. At this time, there are twelve at-grade rail crossings along<br />
this corridor regulated by gate arms, lights and warning bells.<br />
Traffic operations at many <strong>of</strong> the rail crossings require queued vehicles to extend across<br />
the rail tracks while waiting for traffic signals to change. Due to physical limitations<br />
associated with moving either the rail line or Florence Avenue, this issue will continue<br />
until this rail corridor is no longer utilized. The only viable solution would be to construct<br />
grade-separate rail crossings which would be extremely costly.<br />
• Truck Routes<br />
As stated in Chapter 3, Article 3 <strong>of</strong> the <strong>Inglewood</strong> Municipal Code, certain streets in the<br />
city are designated as truck routes, as shown in Figure 3.8-5. These designated routes are<br />
determined by the <strong>City</strong> Council and identified with street signs to guide truck traffic<br />
through the city. Vehicles exceeding three tons may only travel on these facilities and are<br />
restricted from using all other streets in the city unless they are picking up or delivering<br />
merchandise at businesses or sites located on these restricted streets.<br />
The <strong>City</strong> has generally utilized arterial streets as designated truck routes in an attempt to<br />
restrict heavy- weight vehicles to streets constructed to carry such weight. These routes<br />
were also selected to keep large vehicles away from residential neighborhoods to decrease<br />
the amount <strong>of</strong> air and noise pollution to which city residents may be exposed. Two<br />
exceptions currently exist: (1) East Hyde Park Boulevard and Hyde Park Place, which<br />
have street widths too narrow to be classified an arterial route but which serve various<br />
small light manufacturing and heavy commercial businesses located in northeast<br />
<strong>Inglewood</strong>, and (2) 102nd Street (between Prairie Avenue and Yukon Avenue) which<br />
serves the new manufacturing and air freight businesses being developed in the Century<br />
Redevelopment Project area.<br />
<strong>City</strong> <strong>of</strong> <strong>Inglewood</strong> <strong>General</strong> <strong>Plan</strong> <strong>Update</strong> Technical Background Report<br />
3.8-19
Chapter 3 Infrastructure<br />
• Intelligent Transportation Systems Applications<br />
Intelligent Transportation Systems (ITS) constitute a wide spectrum <strong>of</strong> techniques and<br />
applications that are currently being applied to existing roadways, highways and transit<br />
systems to increase their efficiency, safely and ability to relieve congestion. The <strong>City</strong> <strong>of</strong><br />
<strong>Inglewood</strong> is currently employing the following types <strong>of</strong> Intelligent Transportation<br />
Systems (ITS) applications:<br />
• Fiber optic communication system used to transmit real-time traffic signal<br />
controller and video data for the <strong>City</strong>’s Advanced Traffic Management System<br />
(ATMS)<br />
Communication hubs are installed at various locations in the <strong>City</strong> to provide connection<br />
points for future fibers:<br />
• Traffic signals at 138 intersections with the <strong>City</strong>, <strong>of</strong> which two are owned by the<br />
California Department <strong>of</strong> Transportation (Caltrans) and two by the Los Angeles<br />
Department <strong>of</strong> Transportation (LADOT)<br />
• Traffic Signal Control System with 116 local controllers centrally interconnected to<br />
the <strong>City</strong>’s Traffic Management Center (TMC) providing central signal monitoring<br />
and the ability to upload and download timing plans from <strong>City</strong> Hall<br />
• CCTV surveillance system including several cameras installed at critical locations<br />
for traffic surveillance and incident management purposes<br />
• Traffic Management Center (TMC) maintained by the Department <strong>of</strong> Public<br />
Works, that provides traffic control capabilities to the <strong>City</strong> Staff<br />
• Issues<br />
• While some progress has been made towards aligning intersections since the<br />
development <strong>of</strong> the previous Element, several locations still require detailed<br />
analysis and the implementation <strong>of</strong> mitigation measures or improvements if<br />
deemed necessary.<br />
• As a result <strong>of</strong> traffic growth in the area and the physical limitations found along<br />
several major roadway facilities, some neighborhoods are experiencing problems<br />
with “cut-thru” traffic, or vehicles utilizing less congested neighborhood streets to<br />
bypass areas <strong>of</strong> congestion on more heavily traveled facilities. This situation<br />
degrades the surrounding neighborhoods in terms <strong>of</strong> quality <strong>of</strong> life and creates<br />
possible dangerous conditions.<br />
• Contrary to the <strong>City</strong>’s Downtown Street Design Study which recommended the<br />
conversion <strong>of</strong> both La Brea Avenue and Market Street into directional one-way<br />
thoroughfares, currently, both streets still operate as two-directional facilities with<br />
La Brea Avenue bearing the brunt <strong>of</strong> overall growth in traffic volumes.<br />
• Crenshaw Boulevard has seen a substantial increase in traffic volumes due to the<br />
completion <strong>of</strong> a freeway interchange with the Glenn Anderson Freeway (I-105),<br />
located immediately south <strong>of</strong> the <strong>City</strong> <strong>of</strong> <strong>Inglewood</strong>. This situation is magnified by<br />
the absence <strong>of</strong> a direct freeway interchange along either Western Avenue or Prairie<br />
Avenue, the two major north/south roadway facilities located on either side <strong>of</strong><br />
Crenshaw Boulevard.<br />
3.8-20<br />
<strong>City</strong> <strong>of</strong> <strong>Inglewood</strong> <strong>General</strong> <strong>Plan</strong> <strong>Update</strong> Technical Background Report
CITY <strong>of</strong> INGLEWOOD<br />
<strong>General</strong> <strong>Plan</strong><br />
CITY OF INGLEWOOD<br />
DESIGNATED TRUCK ROUTES<br />
LA BREA<br />
CENTINELA<br />
HYDE PARK<br />
LA CIENEGA<br />
CRENSHAW<br />
WEST<br />
EUCALYPTUS<br />
FLORENCE<br />
MANCHESTER<br />
AVIATION<br />
ARBOR VITAE<br />
PRAIRIE<br />
CENTURY<br />
HAWTHORNE<br />
102ND<br />
IMPERIAL<br />
Source: <strong>City</strong> <strong>of</strong> <strong>Inglewood</strong>, Public Works Department, February 2006.<br />
Date: May 3, 2006<br />
A Division <strong>of</strong><br />
Not to Scale<br />
Figure 3.8-5
Chapter 3 Infrastructure<br />
• The current revision <strong>of</strong> the LAX Master <strong>Plan</strong> is expected to include several<br />
significant improvements to roadway facilities such as Arbor Vitae Avenue,<br />
Century Boulevard, La Cienega Boulevard, Aviation Boulevard and Lennox<br />
Boulevard. These improvements will greatly affect the current traffic distribution<br />
across the <strong>City</strong>.<br />
• Currently, the <strong>City</strong> does not have either a bicycle plan or any existing dedicated<br />
bicycle routes.<br />
• Several areas <strong>of</strong> the <strong>City</strong> are currently experiencing issues regarding the lack <strong>of</strong> onstreet<br />
parking. This may be the result <strong>of</strong> insufficient roadway right-<strong>of</strong>-way to<br />
accommodate growth in traffic volumes without sacrificing parking.<br />
• References<br />
<strong>City</strong> <strong>of</strong> Arcadia ITS Development <strong>Plan</strong>. (2003).<br />
Foothill Transit, Foothill Transit System Maps Website:<br />
http://www.foothilltransit.org/Schedules_Routes/service_area_map.htm<br />
http://www.foothilltransit.org/Schedules_Routes/schedules.htm, Accessed April<br />
27, 2005.<br />
Gonzales, R.S. 2001. <strong>City</strong> <strong>of</strong> Arcadia Circulation Map. Development Services<br />
Department, Engineering Division.<br />
———. 2004. <strong>City</strong> <strong>of</strong> Arcadia Traffic Volume Map. Development Services Department,<br />
Engineering Division.<br />
Institute <strong>of</strong> Transportation Engineers (ITE). (2003). Trip Generation, 7 th Edition,<br />
Washington, D.C. (Publication No. IR-016E).<br />
———. (2004). Trip Generation Handbook, Second Edition, Washington, D.C. (Publication<br />
No. RP-028B).<br />
International Council <strong>of</strong> Shopping Centers, Research and Statistics Website:<br />
http://www.icsc.org/srch/sct/sct0602/page35.php?region=, Accessed August 18,<br />
2005.<br />
Kaku Associates. 2006. The Methodist Hospital <strong>of</strong> Southern California Master <strong>Plan</strong> Data.<br />
Kimley-Horn and Associates, Inc. 2004. Rusnak/Arcadia Expansion, Morlan Place Project<br />
Traffic Impact Analysis.<br />
Los Angeles County Metropolitan Transportation Authority. 2004. Congestion<br />
Management Program for Los Angeles County, Los Angeles.<br />
———. 2005. Website: http://www.mta.net/riding_metro/riders_guide/planning_trip-<br />
01.htm#TopOfPage, Accessed April 27, 2005.<br />
Santa Anita Racetrack Attendance Data, provided by Santa Anita Racetrack Staff in<br />
February, 2005.<br />
3.8-22<br />
<strong>City</strong> <strong>of</strong> <strong>Inglewood</strong> <strong>General</strong> <strong>Plan</strong> <strong>Update</strong> Technical Background Report
CHAPTER 4<br />
Community Services<br />
This chapter provides information on the <strong>City</strong>’s existing community services. This<br />
Chapter includes the following sections:<br />
• Schools<br />
• Recreation and Parks<br />
• Library Services<br />
4.1 SCHOOLS<br />
This section describes existing school facilities, education programs, and planned<br />
improvements within the <strong>City</strong> <strong>of</strong> <strong>Inglewood</strong>. Information from this section is based upon<br />
the Education Data Partnership website, the State Allocation Board website, the<br />
California Department <strong>of</strong> Education and Office <strong>of</strong> Public School Construction websites,<br />
and the <strong>Inglewood</strong> Unified School District Departments <strong>of</strong> Educational Services, Special<br />
Education, and Business Services.<br />
• Existing Conditions<br />
Schools<br />
Within <strong>Inglewood</strong>, there are 13 public elementary schools and six secondary schools. In<br />
addition, there is one preschool center with an approximate enrollment <strong>of</strong> 300 students<br />
and a community adult school with approximately 8,000 students. The School District<br />
headquarters are located at 401 S. <strong>Inglewood</strong> Avenue within <strong>Inglewood</strong>. Figure 4.1-1<br />
identifies <strong>Inglewood</strong> Unified School District school locations, as well as private schools<br />
and charter schools located within the <strong>City</strong>, and corresponds to Table 4.1-1, which lists<br />
existing public schools and their associated enrollments and capacities as <strong>of</strong> the 2005/06<br />
school year.<br />
The <strong>Inglewood</strong> Unified School District (IUSD) served approximately 16,164 public<br />
school students in kindergarten through 12th grade from the cities <strong>of</strong> <strong>Inglewood</strong> and the<br />
unincorporated area <strong>of</strong> Ladera Heights during the 2005/06 school year, as depicted in<br />
Table 4.1-1 39 . This represents approximately 84 percent <strong>of</strong> the total capacity. Only three<br />
<strong>of</strong> the 20 schools in the District exceeded capacity, including Beulah Payne Elementary<br />
School (104 percent), Hillcrest Continuation High School (115 percent), and <strong>City</strong> Honors<br />
High School (107 percent). Many <strong>of</strong> the elementary schools within <strong>Inglewood</strong> are<br />
operated on a year-round schedule and use “relocatable” classrooms in order to reduce<br />
the effects <strong>of</strong> overcrowding. However, beginning in the 2006/07 school year, all schools<br />
in the District will operate on a traditional calendar. 40<br />
39 Sage Institute, 2006. <strong>Inglewood</strong> Unified School District CBED Enrollments 2005-06. 2005<br />
40 Sage Institute, 2006. <strong>Inglewood</strong> Unified School District CBED Enrollments 2005-06.<br />
<strong>City</strong> <strong>of</strong> <strong>Inglewood</strong> <strong>General</strong> <strong>Plan</strong> <strong>Update</strong> Technical Background Report<br />
4.1-1
Chapter 4 Community Services<br />
In accordance with the IUSD’s philosophy <strong>of</strong> equal educational opportunities for all<br />
students, school enrollments is to be capped at a level that the school facilities and<br />
classrooms can provide the District’s authorized educational program.<br />
Within IUSD boundaries, there are four charter schools. Charter schools are independent<br />
public schools designed and operated by educators, parents, community leaders,<br />
educational entrepreneurs, etc. In California, charter schools receive state and local<br />
funding on a per student allotment. Included in Table 4.1-1 is a list <strong>of</strong> the charter schools<br />
and their associated enrollments. There are also two new charter schools planned for<br />
development in the <strong>City</strong>, including one high school and one elementary school. 41<br />
Table 4.1-1<br />
Public Schools Operated by the <strong>Inglewood</strong> Unified School<br />
District<br />
Map<br />
No. School Grades Capacity<br />
Enrollment<br />
2005/06<br />
Percent <strong>of</strong><br />
Capacity<br />
Elementary Schools<br />
1<br />
Beulah Payne Elementary School (YR)<br />
215 West 94 th Street<br />
K–5 763* 797 104%<br />
2<br />
Centinela Elementary School (YR)<br />
1123 Marlborough Avenue<br />
K–6 1,195* 1,036 87%<br />
3<br />
Clyde Woodworth Elementary School (YR)<br />
3200 W. 104th Street<br />
K–5 1,100* 760 69%<br />
4<br />
Daniel Freeman Elementary School (TS)<br />
2602 West 79th Street<br />
K–6 478 400 84%<br />
5<br />
Frank D. Parent Elementary School (TS)<br />
5345 West 64 th Street<br />
K–8 814 743 91%<br />
6<br />
Highland Elementary School (TS)<br />
430 Venice Way<br />
K–5 851 763 90%<br />
7<br />
W. Claude Hudnall Elementary School (YR)<br />
331 W. Olive Street<br />
K–5 557* 467 84%<br />
8<br />
Bennett/Kew Elementary School (TS)<br />
11710 South Cherry Avenue<br />
K–5 859 784 91%<br />
9<br />
William H. Kelso Elementary School (YR)<br />
809 E. Kelso Street<br />
K–5 970* 789 81%<br />
10<br />
La Tijera Elementary School (TS)<br />
1415 N. La Tijera Boulevard<br />
K–8 893 793 89%<br />
11<br />
Oak Street Elementary School (YR)<br />
633 S. Oak Street<br />
K–5 1,069* 806 75%<br />
12<br />
Warren Lane Elementary School (TS)<br />
9335 S. 8 th Avenue<br />
K–8 1,000 881 88%<br />
13<br />
Worthington Elementary School (YR)<br />
11101 S. Yukon Avenue<br />
K–5 1,038* 776 75%<br />
Totals 11,587 9,795 84.5%<br />
41 Vail, Jennifer, 2006. Sage Institute, Incorporated. Personal communication. 4 August.<br />
4.1-2<br />
<strong>City</strong> <strong>of</strong> <strong>Inglewood</strong> <strong>General</strong> <strong>Plan</strong> <strong>Update</strong> Technical Background Report
4.1 Schools<br />
Table 4.1-1<br />
Public Schools Operated by the <strong>Inglewood</strong> Unified School<br />
District<br />
Map<br />
No. School Grades Capacity<br />
Middle Schools<br />
14<br />
Crozier Middle School (YR)<br />
151 N. Grevillea Avenue<br />
15<br />
Albert F. Monroe Middle School (TS)<br />
10711 South 10th Avenue<br />
High Schools<br />
16<br />
Hillcrest Continuation High School (TS)<br />
441 Hillcrest Street<br />
17<br />
<strong>Inglewood</strong> High School (TS)<br />
231 South Grevillea Avenue<br />
18<br />
Morningside High School (TS)<br />
10500 S. Yukon Avenue<br />
19<br />
<strong>City</strong> Honors High (TS)<br />
555 W. Kelson Street<br />
Adult Schools<br />
<strong>Inglewood</strong> Community Adult School<br />
20<br />
106 E. Manchester Blvd., Suite #350<br />
Los Angeles Unified School District<br />
Century Park Elementary School (TS)<br />
21<br />
10935 South Spinning Ave.<br />
Enrollment<br />
2005/06<br />
Percent <strong>of</strong><br />
Capacity<br />
6–8 1,358* 1,147 84%<br />
6–8 1,566 1,186 76%<br />
Totals 2,924 2,333 79.8%<br />
9–12 256 295 115%<br />
9–12 2,262 1,949 86%<br />
9–12 2,040 1,535 75%<br />
9–12 240 257 107%<br />
Totals 4,798 4,036 84.1%<br />
K–5 865 705 81%**<br />
Charter Schools<br />
Wilder’s Preparatory Academy Charter<br />
22 336 E. Spruce Avenue<br />
K<br />
466<br />
830 N. La Brea Avenue<br />
1–8<br />
23<br />
Century Community Charter School<br />
901 S. Maple Street<br />
6–7 264<br />
24<br />
Animo Leadership High Charter School<br />
1071 West Arbor Vitae Street<br />
9–12 511<br />
25<br />
Animo <strong>Inglewood</strong> High Charter School<br />
3425 Manchester Boulevard<br />
9–12 523<br />
Totals 1,764<br />
SOURCE: Sage Institute Inc., 2006. <strong>Inglewood</strong> Unified School District CBED Enrollment/Capacities by School<br />
Site.<br />
* Capacity for MTYRE used for year round scheduled schools<br />
** SOURCE: California Department <strong>of</strong> Education<br />
(http://data1.cde.ca.gov/dataquest/ASPGraph1.asp?cYear=2005-<br />
06&Level=School&cName=CENTURY^PARK^ELEMENTARY^^^^^^^&cCode=6016414&dCode=196<br />
4733)<br />
YR = year round TS = traditional schedule<br />
All schools will operate on a Traditional Calendar in 2006-07<br />
<strong>City</strong> <strong>of</strong> <strong>Inglewood</strong> <strong>General</strong> <strong>Plan</strong> <strong>Update</strong> Technical Background Report<br />
4.1-3
Chapter 4 Community Services<br />
Private Schools in <strong>Inglewood</strong><br />
According to the California Department <strong>of</strong> Education, there are 14 private schools<br />
located within the <strong>City</strong> 42 . Private schools <strong>of</strong>fer a range <strong>of</strong> educational opportunities for<br />
their students, ranging from pre-school and kindergarten care all the way through high<br />
school. Most private schools charge tuition, set their own admission standards,<br />
curriculum and graduation requirements, with an emphasis on preparing its graduates for<br />
college. Some, but not all private schools are affiliated with various religious groups.<br />
Table 4.1-2 lists the private schools located within <strong>Inglewood</strong>, and the grade range that<br />
they serve.<br />
The Los Angeles Unified School District operates one school within the <strong>City</strong> <strong>of</strong><br />
<strong>Inglewood</strong>, Century Park Elementary School. This elementary school serves students that<br />
reside within the <strong>City</strong>, but is operated and under the control <strong>of</strong> the Los Angeles Unified<br />
School District.<br />
Table 4.1-2 Private Schools within <strong>Inglewood</strong><br />
Map<br />
No. School Name Address Grades<br />
26 Academy for Early Learning 1014–1020 N. Park Ave. Daycare: PK–K<br />
27 Calvary Christian Elementary 2400 West 85th St. Grades: K–8<br />
28 Children's Enrichment Center 3209 West Manchester Blvd. Daycare: PK–2<br />
29 COPE Academy <strong>of</strong> Learning& People 3320 W. 85th St Grades: K–9<br />
30<br />
Crusaders Christian Pre-School &<br />
Kindergarten<br />
601 Centinela Ave. Daycare: PK–K<br />
31 Debbie's Child Care Development 521 South Osage Ave. Daycare: PK–K<br />
32 First Lutheran Preschool 600 West Queen St. Daycare: PK–K<br />
33 From the Heart Preschool 1061 E. Hyde Park Blvd. Daycare: PK–K<br />
34 Kids' Castle Child Care Center 745 North La Brea Ave. Daycare: PK–K<br />
35 Saint Mary's Academy 701 Grace Ave Grades: 9–12<br />
36 South Bay Lutheran High School 3600 West Imperial Highway Grades: 7–12<br />
37 St. John Chrysostom Elementary School 530 East Florence Ave. Grades: K–8<br />
38 The University <strong>of</strong> Children 1512 Centinela Ave. Grades: PK–3<br />
39 Wiz Schools 121 West Arbor Vitae Grades: PK–3<br />
SOURCE: California Private School Directory (http://www.cde.ca.gov) Accessed March 13, 2006.<br />
42 California Department <strong>of</strong> Education, 2006. Website:<br />
http://www.cde.ca.gov/re/sd/results.asp?Nocache=4%2F12%2F2006+8%3A56%3A51+AM, accessed<br />
March 20, 2006.<br />
4.1-4<br />
<strong>City</strong> <strong>of</strong> <strong>Inglewood</strong> <strong>General</strong> <strong>Plan</strong> <strong>Update</strong> Technical Background Report
N MARKET ST<br />
S MARKET ST<br />
CULLEN WY<br />
S LA CIENEGA BLVD<br />
CLUB DR<br />
S ASH AV<br />
S OSAGE AV<br />
CITY <strong>of</strong> INGLEWOOD<br />
<strong>General</strong> <strong>Plan</strong><br />
SCHOOL LOCATIONS<br />
AVIATION BLVD<br />
5<br />
!<br />
S ISIS AV<br />
W 64TH ST<br />
W OLIVE ST<br />
S HINDRY AV<br />
24<br />
!<br />
<strong>City</strong> <strong>of</strong><br />
Los Angeles<br />
S GLASGOW AV<br />
10<br />
!<br />
W 64TH PL<br />
W FAIRVIEW BLVD<br />
W ELLIS AV<br />
W HILLSDALE ST<br />
CENTINELA AV<br />
W HILL ST<br />
%&l(<br />
38<br />
!<br />
W VICTOR AV<br />
W FLORENCE AV<br />
W REGENT ST<br />
W QUEEN ST<br />
W OLIVE ST<br />
W KELSO ST<br />
W PLYMOUTH ST<br />
32<br />
!<br />
W VENICE WY<br />
W MANCHESTER BLVD<br />
W NECTARINE ST<br />
W LIME ST<br />
11<br />
!<br />
W HILLCREST BLVD<br />
W ELM AV<br />
W SPRUCE AV<br />
W MAGNOLIA AV<br />
W BUCKTHORN ST<br />
W ARBOR VITAE ST<br />
S OAK ST<br />
19<br />
!<br />
S HOLLY ST<br />
W 96TH ST<br />
W 97TH ST<br />
W 98TH ST<br />
W 99TH ST<br />
<strong>Inglewood</strong> Unified School District<br />
Elementary Schools<br />
1<br />
2<br />
3<br />
!!!<br />
4<br />
5<br />
6<br />
!!!<br />
7<br />
!<br />
8<br />
!!<br />
9<br />
!<br />
10<br />
11<br />
12<br />
13<br />
!!!<br />
6<br />
!<br />
N OAK ST<br />
S ROSEWOOD AV<br />
S EUCALYPTUS AV<br />
S TRURO AV<br />
N LA BREA AV<br />
22<br />
!<br />
34<br />
W HYDE PARK BLVD<br />
N FIR AV<br />
S FIR AV<br />
W IVY AV<br />
S WALNUT ST<br />
S GREVILLEA AV<br />
S MAPLE AV<br />
S BURIN AV<br />
S LA BREA AV<br />
E HARGRAVE ST<br />
E BRETT ST<br />
E HILLSDALE ST<br />
HYDE PARK PL<br />
E STEPNEY ST<br />
S HAWTHORNE BLVD<br />
E HAZEL ST<br />
S ORCHARD DR<br />
E WARREN LN<br />
S LOCUST ST<br />
E SPRUCE AV<br />
S LARCH ST<br />
30<br />
!<br />
E TAMARACK AV<br />
S MYRTLE AV<br />
35<br />
!<br />
E FLORENCE AV<br />
E GRACE AV<br />
E REGENT ST<br />
14<br />
!<br />
7<br />
17 20<br />
! !!<br />
22<br />
!<br />
9<br />
16<br />
31<br />
! !<br />
1<br />
!<br />
39<br />
! 23<br />
L o s A n g e l e s C o u n t y<br />
Beulah Payne Elementary School<br />
Monroe Junior High School<br />
High Schools<br />
16<br />
17<br />
18<br />
!!!<br />
! 19<br />
Centinela Elementary School<br />
L o s A n g e l e s C o u n t y<br />
Clyde Woodworth Elementary School<br />
Daniel Freeman Elementary School<br />
Frank Parent Elementary School<br />
Highland Elementary School<br />
Hudnall Elementary School<br />
Bennet/Kew Elementary School<br />
Kelso Elementary School<br />
La Tijera Elementary School<br />
Oak Street Elementary School<br />
Warren Lane Elementary School<br />
Worthington Elementary School<br />
Middle Schools<br />
14 G W Crozier School<br />
!!<br />
15<br />
Hillcrest High School<br />
<strong>Inglewood</strong> High School<br />
Morningside High School<br />
<strong>City</strong> Honors High School<br />
Lennox<br />
Source: <strong>City</strong> <strong>of</strong> <strong>Inglewood</strong>, February 2006,<br />
California Private School Directory (http://www.cde.ca.gov), March 16, 2006<br />
Date: August 8, 2006<br />
N:\GISProjects\<strong>Inglewood</strong>-11146\schools.mxd<br />
<strong>City</strong> <strong>of</strong> Hawthorne<br />
Adult School<br />
20<br />
!<br />
E KELSO ST<br />
W 101ST ST<br />
N PARK AV<br />
N PRAIRIE AV<br />
E QUEEN ST<br />
E LA BREA DR<br />
E ARBOR VITAE ST<br />
S FLOWER ST<br />
2<br />
!<br />
36<br />
!<br />
E AERICK ST<br />
MANCHESTER TER<br />
S OSAGE AV<br />
W 103RD ST<br />
26<br />
!<br />
S PRAIRIE AV<br />
S PRAIRIE AV<br />
E FAIRVIEW BLVD<br />
E BRETT ST<br />
E HYDE PARK BLVD<br />
E 65TH ST<br />
W MANCHESTER BLVD<br />
E HARDY ST<br />
W CENTURY BLVD<br />
W 102ND ST<br />
W 104TH ST<br />
W 105TH ST<br />
W 106TH ST<br />
W 107TH ST<br />
W 108TH ST<br />
W 109TH ST<br />
W 110TH ST<br />
W 111TH ST<br />
W 111TH PL<br />
W 112TH ST<br />
W 113TH ST<br />
KAREEM CT<br />
33<br />
!<br />
S DOTY AV<br />
W IMPERIAL HWY<br />
E 66TH ST<br />
%&d(<br />
Los Angeles Unified School District<br />
! 21<br />
Century Park Elementary School<br />
W 64TH ST<br />
WEST BLVD<br />
REDONDO BLVD<br />
Hollywood<br />
Park<br />
Lake<br />
YUKON AV<br />
WEST BLVD<br />
13<br />
!<br />
37<br />
!<br />
W 116TH ST<br />
W 117TH ST<br />
W 118TH ST<br />
W 118TH PL<br />
W 74TH ST<br />
VICTORIA AV<br />
PINCAY DR<br />
LUTHER LN<br />
POETS LN<br />
18<br />
!<br />
S CHERRY AV<br />
W 79TH ST<br />
W 81ST ST<br />
W 82ND ST<br />
W 82ND PL<br />
W 83RD ST<br />
W 84TH PL<br />
S DEHN AV<br />
8<br />
!<br />
25<br />
!<br />
S LEMOLI AV<br />
<strong>City</strong> <strong>of</strong><br />
Los Angeles<br />
S 12TH AV<br />
11TH AV<br />
S 11TH AV<br />
S 10TH AV<br />
S 10TH AV<br />
S SIMMS AV<br />
S 8TH AV<br />
! 29<br />
28<br />
3<br />
!<br />
15<br />
!<br />
CRENSHAW BLVD<br />
W 76TH ST<br />
W 77TH ST<br />
W 78TH ST<br />
W 78TH PL<br />
W 79TH ST<br />
W 80TH ST<br />
W 81ST ST<br />
W 82ND ST<br />
W 84TH ST<br />
W 84TH PL<br />
W 85TH ST<br />
W 88TH ST<br />
W 90TH ST<br />
S 8TH AV<br />
ATKINSON AV<br />
[<br />
12<br />
!<br />
S 6TH AV<br />
ARDATH AV<br />
WILKIE AV<br />
S 5TH AV<br />
W 104TH ST<br />
W 108TH ST<br />
S 5TH AV<br />
4<br />
!<br />
W 101ST ST<br />
S 4TH AV<br />
S 3RD AV<br />
THOREAU ST<br />
W 111TH ST<br />
W 112TH ST<br />
W IMPERIAL HWY<br />
MAITLAND AV<br />
S BYRD AV<br />
S 2ND AV<br />
1<br />
!<br />
S SPINNING AV<br />
W 115TH ST<br />
S VAN NESS AV<br />
27<br />
!<br />
S VAN NESS AV<br />
<strong>City</strong> <strong>of</strong> Los Angeles<br />
L o s<br />
An g e l e s<br />
C o u n t y<br />
Crusaders Christian Preschool<br />
Charter Schools<br />
! 22 31 Debbie's Child Care Development<br />
Wilder's Prep Academy Charter<br />
! 23 32 First Lutheran Preschool<br />
Century Community Charter School<br />
! 24 33 From the Heart Preschool<br />
Animo Leadership High Charter School<br />
! 25 34 Kids' Castle Child Care Center<br />
Animo <strong>Inglewood</strong> High Charter School<br />
35<br />
Private Schools<br />
Saint Mary's Academy<br />
26 Academy for Early Learning<br />
36 South Bay Lutheran High School<br />
27<br />
28<br />
29<br />
!!!!<br />
<strong>Inglewood</strong> Adult School<br />
Calvary Christian Elementary School<br />
Children's Enrichment Center<br />
COPE Academy <strong>of</strong> Learning<br />
! 30<br />
!<br />
!!!!!!!!<br />
37<br />
38<br />
39<br />
St. John Chrysostom<br />
The University <strong>of</strong> Children<br />
Wiz Schools<br />
Miles<br />
0 0.25<br />
0.5<br />
Figure 4.1-1
4.1 Schools<br />
Educational Programs<br />
The Curriculum Guide Blue Print is the <strong>Inglewood</strong> Unified School District's<br />
comprehensive guide for implementing the California Department <strong>of</strong> Education Content<br />
Standards. The Curriculum Guide Blue Print is designed to clearly define what is to be<br />
taught within each subject matter and at each grade level. Each component is a building<br />
block in constructing a sequential, coherent, comprehensive and balanced educational<br />
program. The layout <strong>of</strong> the Curriculum Guide Blue Print allows teachers to readily review<br />
the content standards. The subjects are arranged in alphabetical order, as follows:<br />
English-Language Arts, English Language Development, Health, History/Social Science,<br />
Mathematics, Physical Education, Science, Visual and Performing Arts, and Vocational<br />
Education. With the exception <strong>of</strong> Vocational Education, each subject matter is further<br />
subdivided by grade spans (K–2, 3–5, 6–8, and 9–12).<br />
Consistent with the California Content standards and the California Frameworks, each<br />
strand or major theme is clearly indicated across the grade span. The organization <strong>of</strong> the<br />
Curriculum Guide Blue Print mirrors the organization <strong>of</strong> the California Department <strong>of</strong><br />
Education documents as much as possible so as to facilitate cross-referencing for the<br />
user. 43<br />
Gifted and Talented Education (GATE)<br />
The number <strong>of</strong> identified GATE students within the <strong>Inglewood</strong> Unified School District<br />
has increased from 895 in the 2003/04 school year to 942 in the 2004/05 school year 44 .<br />
This increase is due to the District’s heightening attention to the screening and<br />
identification process. The students in the GATE program are serviced through<br />
enrichment activities, cluster grouping, and accelerated classes. School site facilitators<br />
ensure the identification and differentiated instruction <strong>of</strong> GATE students. 45<br />
UCLA/National Center for Research on Evaluation, Standards, and Student<br />
Testing (CRESST)<br />
The University <strong>of</strong> California, Los Angeles (UCLA) has partnered with the National<br />
Center for Research on Evaluation, Standards, and Student Testing (CRESST) to develop<br />
rigorous, standards-based performance assignments in English/Language Arts and<br />
Mathematics for students grades 4 through 11. These assignments measure the deep<br />
understanding and complex skills as represented in the California standards. The<br />
CRESST mission focuses on the assessment <strong>of</strong> educational quality, addressing persistent<br />
problems in the design and use <strong>of</strong> assessment systems to serve multiple purposes. The<br />
prime focus <strong>of</strong> the English/Language Arts segment <strong>of</strong> the program is the <strong>Inglewood</strong><br />
43 <strong>Inglewood</strong> Unified School District. 2006. http://inglewood.k12.ca.us/Curriculum-Staff-Developmentand-Categorical-Programs.htm.<br />
accessed March 15.<br />
44 <strong>Inglewood</strong> Unified School District, 2005. Status Report on Board and Superintendent Goals, January 26.<br />
45 <strong>Inglewood</strong> Unified School District. 2006. http://inglewood.k12.ca.us/Curriculum-Staff-Developmentand-Categorical-Programs.htm.<br />
accessed March 15.<br />
<strong>City</strong> <strong>of</strong> <strong>Inglewood</strong> <strong>General</strong> <strong>Plan</strong> <strong>Update</strong> Technical Background Report<br />
4.1-7
Chapter 4 Community Services<br />
Language Arts Performance Assignment (ILAP). The ILAP assignments are designed to<br />
achieve grade appropriate reading comprehension, literary response and analysis and<br />
writing APPLICATIONS standards. The <strong>Inglewood</strong> Mathematics Performance<br />
Assignment (IMAP) focuses primarily on grade appropriate number sense and<br />
mathematical reasoning standards in grades 4 through 6 and on Geometry and Algebra<br />
standards in later grades. 46<br />
Special Education<br />
The Special Education Department provides services to students who qualify as<br />
individuals with exceptional needs. The <strong>Inglewood</strong> Unified School District (IUSD) is<br />
required by the State <strong>of</strong> California and the federal government to serve these students in<br />
specially designed classrooms with teachers who are credentialed in the appropriate<br />
special education areas. Special education services <strong>of</strong>fered within IUSD schools include<br />
the following classroom settings 47 :<br />
• Resource Specialist Program (RSP)—Students who experience learning difficulties in<br />
one or more subject areas (as measured by formal assessments and identified in<br />
their IEP’s) are part <strong>of</strong> the Resource Specialist Program (RSP). These students<br />
attend general education classes and are taught by credentialed special education<br />
teachers in the deficit subject area. There are RSP programs at all <strong>Inglewood</strong><br />
schools.<br />
• Special Day Class (SDC)—Students who are learning handicapped or have other<br />
handicapping conditions are taught in Special Day Class (SDC) and can be<br />
mainstreamed into general education as specified by their Individualized Education<br />
<strong>Plan</strong> (IEP). There are SDC classes at all <strong>Inglewood</strong> schools.<br />
• Severely Handicapped (SH) students are developmentally delayed as measured by<br />
formal assessments and identified in their IEP’s. Their delays range from mild to<br />
severe. They are usually taught in an SH classroom. The <strong>Inglewood</strong> Unified School<br />
District has Severely Handicapped programs at the Child Development Center<br />
(pre-K), Daniel Freeman Elementary School, Woodworth Elementary School,<br />
Monroe Middle School, and Morningside High School.<br />
Other types <strong>of</strong> Special Education services are <strong>of</strong>fered to students with the following<br />
handicapping conditions: Severely Emotionally disturbed, Emotionally disturbed, Blind,<br />
Deaf, Multiple Handicaps, Autism, and Attention Deficit Hyperactive Disorder (ADHD).<br />
These students are served in IUSD schools, LACOE schools, or Southwest SELPA<br />
schools. If the student’s condition is <strong>of</strong> such severity that IUSD cannot serve them in the<br />
above schools, the student may be referred to a nonpublic school.<br />
46 Ibid.<br />
47 <strong>Inglewood</strong> Unified School District. 2006. http://inglewood.k12.ca.us/Departments/Instructional-<br />
Services-Division/Special-Education/special-education-department.htm. accessed March 15.<br />
4.1-8<br />
<strong>City</strong> <strong>of</strong> <strong>Inglewood</strong> <strong>General</strong> <strong>Plan</strong> <strong>Update</strong> Technical Background Report
4.1 Schools<br />
<strong>Inglewood</strong> Community Adult School<br />
The <strong>Inglewood</strong> Community Adult School, is dedicated to promoting students’ success<br />
through quality service and excellence by providing learning opportunities for adult<br />
learners.<br />
<strong>Inglewood</strong> Community Adult School <strong>of</strong>fers a variety <strong>of</strong> classes including English as a<br />
Second Language (ESL), word processing, high school diploma subjects, conversational<br />
Spanish, older adult subjects, computer technology, secretarial sciences, vocational<br />
education courses, and cosmetology. Classes are <strong>of</strong>fered at more than 15 locations<br />
throughout the city. 48<br />
<strong>Plan</strong>ned Improvements<br />
The following is a list <strong>of</strong> recent and proposed improvements to the schools <strong>of</strong> the<br />
<strong>Inglewood</strong> Unified School District. Staff is also working on Modernization Applications,<br />
Modernization Reimbursements, Facility Hardship and other financial resources which<br />
may be used to augment Measure K Projects (Measure K described under Regulatory<br />
Setting <strong>of</strong> this Section). The long-term plan is to replace the one-story classroom facilities<br />
with two-story buildings on each school site except for kindergarden sites, in order to<br />
create more open space for play areas on the ground and improve school sites. 49 As<br />
school enrollment declines, however, so does the amount <strong>of</strong> money the school district<br />
can receive from the State towards construction. In 2005, the decline in enrollment<br />
resulted in a $28 million loss in eligibility for State matching funds to supplement<br />
elementary school projects. Details <strong>of</strong> the planned improvements for each area are<br />
described below. 50 Currently there are no plans for new school construction within the<br />
<strong>City</strong> at this time.<br />
• The District is completing a State Facility Hardship application for replacement for<br />
Crozier Middle School. New construction at Crozier Middle School will result in a<br />
two-story, six-building complex containing 44 classrooms, science and art labs, a<br />
gymnasium, an administration building, a library/multimedia center, a cafeteriastyle<br />
kitchen, an amphitheater, a covered lunch shelter, and sports fields. The new<br />
school is designed for 1,300 students, grades 6–8.<br />
• A new building for the consolidated <strong>of</strong>fices at Morningside High School, including<br />
a parent conference room, was completed in winter <strong>of</strong> 2006.<br />
• Construction plans for Highland Elementary School include a new, two-story, 29-<br />
classroom building with a new playground. The administration building will also be<br />
modernized as a part <strong>of</strong> the improvement project. Construction began in winter <strong>of</strong><br />
2006.<br />
48 <strong>Inglewood</strong> Unified School District. 2006. http://www.iusd.net/schools/adult-school/index.htm.<br />
Accessed March 15.<br />
49 Vail, Jennifer, 2006. Sage Institute Inc. Personal communication. 4 August.<br />
50 <strong>Inglewood</strong> Unified School District. 2006. http://iusd.net/Departments/Business-Services-<br />
Division/Measure-K/MeasureK/Projects/index.htm, accessed March 13.<br />
<strong>City</strong> <strong>of</strong> <strong>Inglewood</strong> <strong>General</strong> <strong>Plan</strong> <strong>Update</strong> Technical Background Report<br />
4.1-9
Chapter 4 Community Services<br />
• Monroe Middle School serves students in grades 6 to 8. A proposal to construct a<br />
new two-story facility, which would include a gymnasium with locker rooms and a<br />
stage, a kitchen and ampitheater-style lunch area, and three classrooms on the<br />
second floor was presented to the Board <strong>of</strong> Education in June 2005.<br />
• Warren Lane Elementary School serves students in grades K–8. A proposal for the<br />
use <strong>of</strong> new construction on the eastern side <strong>of</strong> the site to divide the current campus<br />
into two sections: a K–5 campus on the 6th Street side and a 6–8 campus on the<br />
8th Street side <strong>of</strong> the site. The proposed new construction includes a new two-story<br />
14-classroom building, four new labs, a library, a gymnasium, a kitchen, and an<br />
administration facility.<br />
• La Tijera Elementary School serves students in grades K–8. The District has been<br />
approved through the State Facility Hardship Program to replace La Tijera<br />
Elementary School as the school has several structurally compromised and<br />
abandoned buildings. The IUSD plans to complete the La Tijera project using<br />
funds from Measure K, Faculty Hardship funds and the State <strong>of</strong> California.<br />
• Hudnall Elementary School currently serves students in grades K–6. Expansion<br />
plans for Hudnall Elementary School include a new two story, 12-classroom<br />
building. The administration building will be modernized, the portable classrooms<br />
removed, and the playground resurfaced as a part <strong>of</strong> the project. The anticipated<br />
start date for construction is spring <strong>of</strong> 2006.<br />
• Beulah Payne Elementary School currently serves students in grades K–6.<br />
Construction plans for Payne Elementary School include a new two-story, 15-<br />
classroom building. The school will also undergo modernization upgrades, 10<br />
portable classrooms will be removed, and the playground will be resurfaced as part<br />
<strong>of</strong> the project. The anticipated start date for construction is summer <strong>of</strong> 2006.<br />
Enrollment Projections<br />
Table 4.1-3 below provides existing and projected enrollments through 2010/11. Existing<br />
and projected enrollments include the four charter schools within District boundaries,<br />
described above. As shown in the table, IUSD, including the charter schools, is<br />
experiencing a decline in attendance district wide at the elementary school level. This<br />
decline, according to the District, may be due in part to the economy, and correlates with<br />
population cohorts as opposed to birth rates. 51 Projections in the table are based on<br />
internal growth only, however, and do not include growth from new residential<br />
construction in the <strong>City</strong>. Due to the future development expected to occur in the<br />
Renaissance Home development and Hollywood Park area, District enrollment levels are<br />
expected to increase with the increase in population 52 . For each new residential<br />
development project in the <strong>City</strong>, state law requires developers to pay a statutory school<br />
facilities fee to the <strong>City</strong> <strong>of</strong> <strong>Inglewood</strong>, which would be distributed to the District.<br />
Payment <strong>of</strong> the fee would assist the District in expanding the necessary school facilities or<br />
services, as necessary, to accommodate increased enrollment.<br />
51 Vail, Jennifer, 2006. Sage Institute Inc. Personal communication. 4 August.<br />
52 <strong>Inglewood</strong> Unified School District, 2005. Bard Summit on the Measure K Construction Program and<br />
State Eligibility, February 26.<br />
4.1-10<br />
<strong>City</strong> <strong>of</strong> <strong>Inglewood</strong> <strong>General</strong> <strong>Plan</strong> <strong>Update</strong> Technical Background Report
4.1 Schools<br />
Table 4.1-3<br />
<strong>Inglewood</strong> Unified School District Alternative Enrollment Projections<br />
Based on Adjusted Matriculation October 2005 (CBEDs)<br />
K–12 Enrollments within District Boundaries<br />
CBED Enrollment Data 4 Matriculated Enrollment Projections 1,2,3,4<br />
Grade Level 02/03 03/04 04/05 05/06 06/07 07/08 08/09 09/10 10/11<br />
Grade K 1,362 1,421 1,255 1,155 1,163 1,171 1,179 1,188 1,196<br />
Grade 1 1 1,641 1,583 1,561 1,402 1,326 1,322 1,332 1,341 1,350<br />
Grade 2 1,552 1,569 1,450 1,439 1,412 1,336 1,332 1,341 1,350<br />
Grade 3 1,550 1,537 1,520 1,363 1,449 1,422 1,345 1,341 1,350<br />
Grade 4 1,542 1,525 1,472 1,445 1,373 1,459 1,432 1,354 1,350<br />
Grade 5 1,470 1,569 1,446 1,421 1,455 1,382 1,469 1,442 1,364<br />
Grade 6 1,612 1,527 1,647 1,476 1,431 1,465 1,392 1,480 1,452<br />
Grade 7 1,424 1,529 1,338 1,515 1,486 1,441 1,476 1,402 1,490<br />
Grade 8 1,249 1,335 1,396 1,246 1,526 1,497 1,451 1,486 1,411<br />
Grade 9 1,314 1,233 1,310 1,315 1,255 1,536 1,507 1,461 1,496<br />
Grade 10 2 1,242 1,280 1,204 1,286 1,285 1,226 1,501 1,473 1,428<br />
Grade 11 2 911 1,089 1,145 1,101 1,154 1,152 1,100 1,346 1,321<br />
Grade 12 2 672 792 904 907 922 966 965 920 1,127<br />
Elementary Sub-Totals<br />
Grades K–6 10,729 10,731 10,351 9,701 9,609 9,558 9,481 9,486 9,413<br />
Grades 7–8 2,673 2,864 2,734 2,761 3,012 2,938 2,927 2,887 2,901<br />
Elem. SDC 416 393 425 396 399 402 404 407 410<br />
Total K–8 13,818 13,988 13,510 12,858 13,020 12,897 12,812 12,781 12,725<br />
Secondary Sub-Totals<br />
Grades 9–12 4,139 4,394 4,563 4,609 4,615 4,880 5,072 5,200 5,372<br />
Cont. High 165 182 186 295 297 299 301 303 305<br />
Sec. SDC 171 205 177 166 167 168 170 171 172<br />
Total 9–12 4,475 4,781 4,926 5,070 5,079 5,348 5,543 5,675 5,849<br />
GRAND TOTALS<br />
Grades K–8 13,818 13,988 13,510 12,858 13,020 12,897 12,812 12,781 12,725<br />
Total 9–12 4,475 4,781 4,926 5,070 5,079 5,348 5,543 5,675 5,849<br />
Total K–12 18,293 18,769 18,436 17,928 18,098 18,244 18,355 18,456 18,574<br />
1Due to Pre-K private schools within District boundaries an average annual increase <strong>of</strong> 13% occurs from Kindergarten to 1st<br />
grade. Therefore, projected 1st grade enrollments include an annual increase <strong>of</strong> 13% from Kindergarten to 1st grade.<br />
2Projected High School enrollments include a 3% annual dropout rate from 9th to 10th grade, a 11% annual dropout rate<br />
from 10th to 11th grade and a 17% annual dropout rate from 11th to 12th grade.<br />
3Based on historical and projected population and enrollment trends an average annual growth rate <strong>of</strong> 0.7% was included in<br />
the above enrollment projections.<br />
4Existing CBED enrollments for 2002-03 through 2005-06 and projected enrollments for 2006-07 through 2010-11 include<br />
enrollments attending and projected for four (4) Charter Schools within District Boundaries; <strong>Inglewood</strong> Preparatory,<br />
Century Community, Animo Leadership High and Animo <strong>Inglewood</strong> High.<br />
• Funding<br />
To accommodate planned improvements, IUSD funds new school facilities through a<br />
combination <strong>of</strong> several sources, including State bonds, local bonds, special taxes,<br />
developer fees, and various federal funding sources. The <strong>Inglewood</strong> Unified School<br />
<strong>City</strong> <strong>of</strong> <strong>Inglewood</strong> <strong>General</strong> <strong>Plan</strong> <strong>Update</strong> Technical Background Report<br />
4.1-11
Chapter 4 Community Services<br />
District also uses multi-track, year-round education as a way to avoid or defer the cost <strong>of</strong><br />
new construction.<br />
State Sources<br />
The major State funding program for providing permanent school facilities is the Leroy<br />
F. Greene State School Building Lease-Purchase Program <strong>of</strong> 1976 (Lease-Purchase<br />
Program), which is funded by State bonds. These bonds are placed on the ballot by the<br />
legislature on a regular basis for approval by voters. In 2000, adoption <strong>of</strong> Proposition 39<br />
changed the required majority for local voter approval <strong>of</strong> bonds from two-thirds to<br />
55 percent. Once these bonds receive voter approval, school districts may apply for the<br />
funds. Eligibility is based on a district’s need to house current, as well as projected,<br />
enrollment. The Lease-Purchase Modernization Program is an affiliated program that<br />
provides funds for improvements to enhance facilities at least 30 years old.<br />
Another source <strong>of</strong> State funding is the School Facility Program or Assembly Bill 16<br />
(AB16), administered by the State Office <strong>of</strong> New Public School Construction In 2002,<br />
Assembly Bill 16 created the Critically Overcrowded School Facilities (COS) program,<br />
which supplements the new construction provisions within the School Facilities Program.<br />
The COS program allows school districts with critically overcrowded school facilities, as<br />
determined by the California Department <strong>of</strong> Education, to apply for a preliminary<br />
apportionment for new construction projects. 53 As <strong>of</strong> the 2004/05 school year both<br />
Beulah Payne Elementary School and W. Claude Hudnall Elementary School were eligible<br />
for COS funding.<br />
Levels <strong>of</strong> developer fee contribution are determined by the State Allocation Board and<br />
increase annually. Current State statutes dictate that school districts have the authority to<br />
levy statutory or Level I fees on new development at rates <strong>of</strong> $2.14 per square foot <strong>of</strong><br />
new residential and $0.34 per square foot for commercial and industrial development. 54<br />
Because these Level I fees <strong>of</strong>ten do not generate sufficient funding for new schools,<br />
districts such as the <strong>Inglewood</strong> Unified School District use fees Level II fees to generate<br />
one-half the cost <strong>of</strong> providing new school facilities. Use <strong>of</strong> Level II fees assumes that the<br />
State will provide the other half <strong>of</strong> the cost <strong>of</strong> new schools through the issuance <strong>of</strong><br />
general obligation bonds.<br />
In the event that the State does not have funding available, participating districts have the<br />
option to temporarily increase the fees to Level III fees on new residential development<br />
to try and meet their needs if the district meets certain conditions such as having<br />
20 percent <strong>of</strong> the district’s classrooms classified as relocatable. The district must,<br />
however, refund these funds when general obligation funds from the State do become<br />
available. It should also be noted that some income for school districts is obtained<br />
53 California Department <strong>of</strong> Education. Facilities Department, . Website: www.cde.ca.gov/facilities, March<br />
21, 2006.<br />
54 State Allocation Board, 2004. Website: www.opsc.dgs.ca.gov/SAB/Default.htm, Accessed March 21,<br />
2006.<br />
4.1-12<br />
<strong>City</strong> <strong>of</strong> <strong>Inglewood</strong> <strong>General</strong> <strong>Plan</strong> <strong>Update</strong> Technical Background Report
4.1 Schools<br />
through the State lottery but cannot be used for funding construction projects due to the<br />
fluctuating funding levels available through this means.<br />
Local Sources<br />
Local funding sources include both non-revenue and revenue monies. Non-revenue<br />
funds include lease/purchases, certificates <strong>of</strong> participation, and other mechanisms<br />
typically in the form <strong>of</strong> loans. Revenue funds are generated from several sources,<br />
including the IUSD’s general fund, money from the sale <strong>of</strong> unused school sites, general<br />
obligation funds, redevelopment agreement funds, developer fees, and others.<br />
After land is acquired, school districts are exempt from local zoning regulations and<br />
planning processes. But the construction <strong>of</strong> new schools, like all development, is<br />
dependent upon multiple factors, most basically the availability <strong>of</strong> funds. Also, without<br />
support from the <strong>City</strong> itself, available funding does not guarantee new facilities will be<br />
built. It is also important to note that increases in the tax base do not necessarily affect<br />
the financial status <strong>of</strong> the school districts. Thus, a strong local economy does not<br />
necessarily mean that new school facilities will be built and that programs will be<br />
expanded. Further, other operating expenses that continually increase, such as salaries,<br />
can significantly decrease an already limited budget and eliminate opportunities for new<br />
development.<br />
Measure K Bonds<br />
In 1998, the residents <strong>of</strong> <strong>Inglewood</strong> and Ladera Heights passed a $131 million bond issue<br />
to fund the upgrade and modernization <strong>of</strong> <strong>Inglewood</strong> Unified School District schools. In<br />
<strong>Inglewood</strong> Unified School District Board <strong>of</strong> Education voted to approve the realignment<br />
<strong>of</strong> remaining Measure K bond funds for the construction and modernization <strong>of</strong><br />
<strong>Inglewood</strong> schools. This realignment allowed the district to prioritize projects that were<br />
eligible for matching State funds as well as compensate for the loss <strong>of</strong> State funds due to<br />
enrollment decreases at the elementary school level. The realignment reduces the number<br />
<strong>of</strong> schools to receive new construction and modernization from Measure K funds.<br />
However, many <strong>of</strong> those schools are to benefit from noise mitigation upgrades from the<br />
recently-signed LAX Community Benefits agreement. Maintenance funds will be used to<br />
address remaining needs, which are currently being assessed in a district-wide study. 55<br />
The LAX School Benefits Agreement<br />
A milestone agreement reached in December <strong>of</strong> 2004 provides for facility upgrades to<br />
schools affected by airplane noise and other airplane-related environmental factors. The<br />
LAX School Benefits Agreement, negotiated in conjunction with community groups as a<br />
part <strong>of</strong> the LAX Modernization plan, would provide up to $118 million for facility<br />
55<br />
<strong>Inglewood</strong> Unified School District, 2006. Measure K News, Website:<br />
http://iusd.net/Departments/Business-Services-Division/Measure-<br />
K/MeasureK/News/2005/March/Realignment.htm, accessed March 20, 2006.<br />
<strong>City</strong> <strong>of</strong> <strong>Inglewood</strong> <strong>General</strong> <strong>Plan</strong> <strong>Update</strong> Technical Background Report<br />
4.1-13
Chapter 4 Community Services<br />
upgrades at schools in the flight corridor. This is the largest amount <strong>of</strong> money that will be<br />
received by any school district from the Federal Aviation Administration.<br />
<strong>Inglewood</strong> Educational Foundation<br />
The <strong>Inglewood</strong> Educational Foundation, founded May 12, 1998, is a nonpr<strong>of</strong>it<br />
organization dedicated to improvement and enrichment <strong>of</strong> educational opportunities for<br />
students within the <strong>Inglewood</strong> Unified School District. The primary purpose <strong>of</strong> the<br />
Foundation is to provide college scholarships and supplemental financial support for a<br />
variety <strong>of</strong> programs that directly benefit students and teachers in the classroom.<br />
The <strong>Inglewood</strong> Educational Foundation supports academic enhancement programs,<br />
scholarships to institutions <strong>of</strong> higher education, cultural and social awareness, mini-grants<br />
for teachers, and mini-grants for special programs. 56<br />
• Issues<br />
• Based on the 2005/06 school enrollment levels, three <strong>of</strong> the 20 schools in the<br />
District are operating above capacity, including Beulah Payne Elementary School<br />
(104 percent), Hillcrest Continuation High School (115 percent), and <strong>City</strong> Honors<br />
High School (107 percent). While plans are in place for improvement <strong>of</strong> Beulah<br />
Payne Elementary School, no plans have been identified for Hillcrest Continuation<br />
or <strong>City</strong> Honors High Schools.<br />
• There is a demonstrated need for preschools in the <strong>Inglewood</strong> District, as indicated<br />
by waiting lists. 57<br />
• District enrollments are expected to increase in the Hollywood Park area and<br />
related attendance boundaries. 58<br />
• As stated above, school enrollments are expected to increase, but there are no plans<br />
to construct new schools to meet these future needs.<br />
• References<br />
California Department <strong>of</strong> Education. 2006. Website:<br />
http://www.cde.ca.gov/ls/fa/co/documents/coscert.xls. March 20.<br />
——. 2006. Website: http://www.cde.ca.gov/ls/fa/yr/direct04.asp. March 20.<br />
——. 2006. Website: www.cde.ca.gov/facilities, March 21.<br />
——. 2006. Website: http://data1.cde.ca.gov/dataquest/ASPGraph1.asp?cYear=2005-<br />
06&Level=School&cName=CENTURY^PARK^ELEMENTARY^^^^^^^&cCode<br />
=6016414&dCode=1964733, March 21<br />
California Office <strong>of</strong> Public School Construction. 2006. Website:<br />
http://www.opsc.dgs.ca.gov/default.htm, March 21.<br />
56 <strong>Inglewood</strong> Unified School District. 2006. http://inglewood.k12.ca.us/E-F-P.htm. accessed March 15.<br />
57 <strong>Inglewood</strong> Unified School District. 2005. Bard Summit on the Measure K Construction Program and<br />
State Eligibility, February 26.<br />
58 Ibid.<br />
4.1-14<br />
<strong>City</strong> <strong>of</strong> <strong>Inglewood</strong> <strong>General</strong> <strong>Plan</strong> <strong>Update</strong> Technical Background Report
4.1 Schools<br />
<strong>Inglewood</strong> Unified School District, 2005. Bard Summit on the Measure K Construction<br />
Program and State Eligibility, February 26.<br />
——. 2005. Status Report on Board and Superintendent Goals, January 26.<br />
——. 2006. Website: http://www.iusd.net/schools/adult-school/index.htm. Accessed<br />
March 15.<br />
——. 2006. Website: http://iusd.net/Departments/Business-Services-<br />
Division/Measure-K/MeasureK/Projects/index.htm, accessed March 13.<br />
——. 2006. Website: http://inglewood.k12.ca.us/Curriculum-Staff-Development-and-<br />
Categorical-Programs.htm. accessed March 15.<br />
——. 2006. Website: http://inglewood.k12.ca.us/Departments/Instructional-Services-<br />
Division/Special-Education/special-education-department.htm, accessed March 15,.<br />
——. 2006. Website: http://inglewood.k12.ca.us/E-F-P.htm. accessed March 15.<br />
——. 2006. Measure K News, Website: http://iusd.net/Departments/Business-Services-<br />
Division/Measure-K/MeasureK/News/2005/March/Realignment.htm, accessed<br />
March 20, 2006.<br />
——. 2006. Website: http://iusd.net/Departments/Business-Services-<br />
Division/Measure-K/MeasureK/Projects/index.htm, accessed March 13.<br />
Sage Institute Incorporated, 2006. <strong>Inglewood</strong> Unified School District Alternative Enrollment<br />
Projections. 7 August.<br />
State Allocation Board. 2006. Website: www.opsc.dgs.ca.gov/SAB/Default.htm,<br />
Accessed March 21.<br />
Vail, Jennifer. 2006. Sage Institute Incorporated.<br />
<strong>City</strong> <strong>of</strong> <strong>Inglewood</strong> <strong>General</strong> <strong>Plan</strong> <strong>Update</strong> Technical Background Report<br />
4.1-15
4.2 Recreation and Parks<br />
4.2 RECREATION AND PARKS<br />
Parklands are important land use components in an urban environment, providing both<br />
visual relief from the built environment and contributing to quality <strong>of</strong> life through<br />
recreation and aesthetic value. This section describes the <strong>City</strong>’s existing parkland and<br />
recreation centers, identifies planned expansions and improvements, and outlines current<br />
needs and future issues. Information for this section is based upon information provided<br />
by the <strong>General</strong> <strong>Plan</strong> Open Space Element, updated in 1995, and discussions with the<br />
Department <strong>of</strong> Parks, Recreation and Community Services staff. Additional information<br />
reviewed in preparation <strong>of</strong> this section included information obtained from the <strong>City</strong> <strong>of</strong><br />
<strong>Inglewood</strong>’s <strong>of</strong>ficial website and the Department <strong>of</strong> Parks, Recreation and Community<br />
Services Recovery Action Program (RAP) for the <strong>City</strong> <strong>of</strong> <strong>Inglewood</strong>’s Park System (2002)<br />
document.<br />
• Existing Conditions<br />
The Department <strong>of</strong> Parks, Recreation and Community Services is responsible for<br />
providing maintenance on city parks , as well as parkways, center medians, islands, and<br />
trees on <strong>City</strong> property. 59 The Department is currently divided into four divisions: Parks<br />
Administration, Recreation and Cultural Services, Human Services and Community<br />
Services. The following is a brief description <strong>of</strong> the duties and services provided by each<br />
division:<br />
• Parks Administration: Responsible for maintenance <strong>of</strong> <strong>City</strong> parks and landscaping<br />
<strong>of</strong> <strong>City</strong> Property<br />
• Recreation and Cultural Services: Responsible for providing programs and activities<br />
at the <strong>City</strong>’s parks and recreation facilities and <strong>City</strong>wide special events<br />
• Human Services: Responsible for providing services such as food distribution<br />
programs, senior citizen services and other programs designed to improve the<br />
quality <strong>of</strong> life for the <strong>City</strong>’s residents and<br />
• Community Services: Responsible for community beautification and fostering<br />
neighborhood preservation, including code enforcement and graffiti abatement<br />
Approximately 100 acres <strong>of</strong> open space, including parks, medians, and parkways is<br />
located within <strong>Inglewood</strong>. The <strong>City</strong> also has two recreation centers that provide a variety<br />
<strong>of</strong> parks and recreational opportunities in the community. Figure 4.2-1 identifies the park<br />
and recreational facilities in the <strong>City</strong> and corresponds to Table 4.2-1 which lists each park<br />
with corresponding acreage and available facilities.<br />
Parks<br />
All ten <strong>of</strong> <strong>Inglewood</strong>’s parks are defined as neighborhood parks by the <strong>City</strong>. It should be<br />
noted that all <strong>of</strong> the <strong>City</strong>’s parks were acquired prior to 1971.<br />
59 <strong>Inglewood</strong>, <strong>City</strong> <strong>of</strong>, “Parks, Recreation and Community Services Department 2004 Annual Report,” 2004<br />
<strong>City</strong> <strong>of</strong> <strong>Inglewood</strong> <strong>General</strong> <strong>Plan</strong> <strong>Update</strong> Technical Background Report<br />
4.2-1
Chapter 4 Community Services<br />
Proposed Facilities<br />
Due to <strong>Inglewood</strong>’s highly developed urban environment, limited opportunities for new<br />
parkland are available within the community. Although the <strong>City</strong> recognizes that land<br />
acquired in the southern and southwestern parts <strong>of</strong> the <strong>City</strong> with aircraft mitigation funds<br />
should be explored for recreational opportunities, there is limited land suitable for such<br />
acquisition 60 . However, the community has been active in providing additional and<br />
improved recreational facilities within existing parks. 61 Several ongoing capital<br />
improvement projects for the <strong>City</strong>’s park system are scheduled for completion during<br />
fiscal year 2005-2006. Recent and proposed improvements include the following:<br />
• In May 2005, the <strong>City</strong>’s first skatepark opened at Darby Park, and two additional<br />
skateparks at Rogers Park and Ed Vincent Park opened in April 2006. Other capital<br />
improvement projects include the replacement <strong>of</strong> playground equipment at North<br />
and Queen Park, as well as Lockhaven Community Center; the resurfacing <strong>of</strong> the<br />
basketball courts at Siminski and Vincent Parks; and construction <strong>of</strong> ADA<br />
compliant restrooms at Vincent Park. Additional improvements and repairs to the<br />
<strong>City</strong>’s parks are scheduled for initiation in the 2005-2006 fiscal year.<br />
• The Helen Lundeberg “History <strong>of</strong> Transportation” Mural Restoration and<br />
Relocation Project is scheduled for completion in fall 2006. The mural, a cast<br />
concrete and terrazzo paneled mural wall composed <strong>of</strong> 60 panels, is 8 feet high and<br />
240 feet long, is awaiting the construction <strong>of</strong> a new wall in the Grevillea Art Park,<br />
where the mural will be relocated. The groundbreaking ceremony occurred on<br />
November 5, 2005, and a Re-dedication Event is planned for the fall <strong>of</strong> 2006.<br />
• Construction is scheduled to start in fall 2006 on the Locust Street<br />
Intergenerational Center and Housing Complex. Along with construction <strong>of</strong> 58<br />
units <strong>of</strong> senior housing, the new complex will replace the current Senior Citizens<br />
Center with a 33,122 square-foot, state <strong>of</strong> the art, ADA compliant Senior Center. 62<br />
Recreational Facilities<br />
As described in Table 4.2-1, the <strong>City</strong>’s parks contain a variety <strong>of</strong> recreational facilities,<br />
with areas available for organized sports, including soccer/football fields, baseball<br />
diamonds, tennis courts, volleyball courts, handball courts, and basketball courts.<br />
The <strong>City</strong> also <strong>of</strong>fers opportunities for informal recreation activities with benches, picnic<br />
tables and barbecues available at several <strong>City</strong> parks. Additionally, the<br />
recreational/community centers <strong>of</strong>fer a wide variety <strong>of</strong> recreational activities, including<br />
self-defense classes, music, art, dance, games, boxing, and weight training. The pool<br />
complex in Ed Vincent Park is the only public swimming facility in the <strong>City</strong>.<br />
60 <strong>Inglewood</strong>, <strong>City</strong> <strong>of</strong>, “Recovery Action Program for the <strong>City</strong> <strong>of</strong> <strong>Inglewood</strong>’s Park System,” December<br />
2002<br />
61 Diana P. Andrade. Email with <strong>City</strong>, March 13, 2006.<br />
62 Danita Meshack-Maden. Email with <strong>City</strong>, March 21, 2006<br />
4.2-2<br />
<strong>City</strong> <strong>of</strong> <strong>Inglewood</strong> <strong>General</strong> <strong>Plan</strong> <strong>Update</strong> Technical Background Report
CITY <strong>of</strong> INGLEWOOD<br />
<strong>General</strong> <strong>Plan</strong><br />
PARKS AND RECREATION CENTERS<br />
Legend<br />
1<br />
Ashwood Park<br />
7<br />
North Park<br />
2<br />
Center Park<br />
8<br />
Queen Park<br />
3<br />
Circle Park<br />
9<br />
Rogers Park<br />
4<br />
Darby Park<br />
10<br />
Siminski Park<br />
5<br />
Edward Vincent Jr. Park<br />
1<br />
Lockhaven Community Center<br />
6<br />
Grevillea Park<br />
2<br />
<strong>Inglewood</strong> Senior Citizen’s Center<br />
Source: <strong>City</strong> <strong>of</strong> <strong>Inglewood</strong>, February 2006.<br />
Date: April 17, 2006<br />
Miles<br />
A Division <strong>of</strong> 0 0.25 0.5<br />
Figure 4.2-1
4.2 Recreation and Parks<br />
Table 4.2-1<br />
Parks<br />
Map No Name Address Acres Equipment and Facilities<br />
Parks<br />
1<br />
Ashwood<br />
Park<br />
2 Center Park<br />
3 Circle Park<br />
4 Darby Park<br />
201 South Ash<br />
Avenue<br />
3660 West<br />
111 th Street<br />
8300 Fifth<br />
Avenue<br />
3400 West<br />
Arbor Vitae<br />
Street<br />
1.3<br />
1.2<br />
• 2 playgrounds<br />
• 2 tennis courts<br />
• 1 full basketball court<br />
• 1 volleyball court<br />
• 2 picnic areas<br />
• 1 wading pool.<br />
• 1 playground<br />
• 1 multi-purpose playing field.<br />
1.3 • Tree lined circular-shaped park<br />
14<br />
• 2 playgrounds<br />
• 2 tennis courts<br />
• 1 paddle tennis court<br />
• 4 half-basketball courts<br />
• 1 outdoor handball court<br />
• 2 lighted s<strong>of</strong>tball/football/soccer fields<br />
• Wading pool<br />
• Skatepark<br />
• 2 picnic areas<br />
• Proposed water feature<br />
• 20,900 sf, ADA-compliant multi-purpose<br />
recreational building<br />
› Gymnasium/full basketball court<br />
› Weight room<br />
› Sauna<br />
› Meeting rooms<br />
› Pool room<br />
› Snack bar/kitchen<br />
› Park <strong>of</strong>fices.<br />
<strong>City</strong> <strong>of</strong> <strong>Inglewood</strong> <strong>General</strong> <strong>Plan</strong> <strong>Update</strong> Technical Background Report<br />
4.2-5
Chapter 4 Community Services<br />
Table 4.2-1<br />
Parks<br />
Map No Name Address Acres Equipment and Facilities<br />
5<br />
6<br />
Edward<br />
Vincent Jr.<br />
Park<br />
Grevillea<br />
Park<br />
7 North Park<br />
8 Queen Park<br />
700 Warren<br />
Lane<br />
231 South<br />
Grevillea<br />
Avenue<br />
625 East<br />
Hargrave Street<br />
652 East Queen<br />
Street<br />
55<br />
1.5<br />
2.3<br />
1.1<br />
• 5 playgrounds<br />
• 8 tennis courts<br />
• 2 full basketball courts<br />
• 2 lighted and fenced s<strong>of</strong>tball fields<br />
• 2 lighted and fenced football/soccer<br />
fields<br />
• Skatepark<br />
• 3 picnic areas<br />
• Pool complex consisting <strong>of</strong> 1 Olympic<br />
regulation swimming pool<br />
› 1 training pool<br />
› 1 wading pool<br />
› ADA-compliant bath house<br />
• Community playhouse<br />
• Multipurpose/Girl Scout facility<br />
• Outdoor Amphitheater.<br />
• History <strong>of</strong> Transportation Mural Project<br />
scheduled for rededication in fall 2006.<br />
• 2 playgrounds<br />
• 3 tennis courts<br />
• Picnic area.<br />
• Playground<br />
• Picnic area<br />
• Wading pool<br />
4.2-6<br />
<strong>City</strong> <strong>of</strong> <strong>Inglewood</strong> <strong>General</strong> <strong>Plan</strong> <strong>Update</strong> Technical Background Report
4.2 Recreation and Parks<br />
Table 4.2-1<br />
Parks<br />
Map No Name Address Acres Equipment and Facilities<br />
9 Rogers Park<br />
10 Siminski Park<br />
Community Centers<br />
1<br />
2<br />
Lockhaven<br />
Community<br />
Center<br />
<strong>Inglewood</strong><br />
Senior<br />
Citizen’s<br />
Center<br />
400 West<br />
Beach Avenue<br />
9717<br />
<strong>Inglewood</strong><br />
Avenue<br />
11125 Doty<br />
Avenue<br />
111 North<br />
Locust Street<br />
9<br />
1.9<br />
• 2 lighted tennis courts<br />
• Full basketball court<br />
• Lighted Little League baseball field<br />
• Lighted football/soccer field<br />
• Wading pool<br />
• Skatepark<br />
• Picnic area<br />
• Playground<br />
• 33,500 sf, multipurpose recreation<br />
building<br />
› Gymnasium/full basketball court<br />
› Auditorium for classes/productions<br />
› Portable boxing ring<br />
› Weight room<br />
› Pool room<br />
› Table tennis<br />
› Meeting rooms<br />
› Handball court<br />
› Snack bar/kitchen<br />
› Outdoor pre-school area<br />
› Park <strong>of</strong>fice<br />
› A skatepark is being planned for<br />
summer 2006<br />
• Full basketball court<br />
• 2 picnic areas<br />
• 4,305 sf, ADA-compliant Community<br />
Center<br />
› Billiards<br />
› Weight training<br />
› Restrooms and <strong>of</strong>fices<br />
• Residential house gifted to the <strong>City</strong><br />
• Serves as a community center<br />
• With playground equipment<br />
• Recently renovated in 2005<br />
• 1 Community Center<br />
• Offices<br />
• Multipurpose room<br />
• Dining room<br />
• Kitchen<br />
• Restrooms<br />
• Billiards<br />
› New Senior Center is planned.<br />
33,000 sf, 2-story building<br />
SOURCE: <strong>City</strong> <strong>of</strong> <strong>Inglewood</strong>, Department <strong>of</strong> Parks Recreation and Community Services, 2006<br />
(http://www.city<strong>of</strong>inglewood.org/depts/rec/parks_n_recreation/park_facilities/recreation_centers.<br />
asp)<br />
<strong>City</strong> <strong>of</strong> <strong>Inglewood</strong> <strong>General</strong> <strong>Plan</strong> <strong>Update</strong> Technical Background Report<br />
4.2-7
Chapter 4 Community Services<br />
The <strong>Inglewood</strong> Unified School District playgrounds are gated, locked and unavailable for<br />
play during all but school hours, and then only for children <strong>of</strong> that school. The <strong>City</strong> has<br />
approached the School District to enact a comprehensive facilities joint use agreement, to<br />
further expand the recreational opportunities available to the residents <strong>of</strong> <strong>Inglewood</strong>. 63<br />
Private Regional Recreation Opportunities<br />
A major regional attraction located in <strong>Inglewood</strong> is The Forum, an 18,000 seat<br />
entertainment venue with a 3,500 on-site parking facility, is best known as the home <strong>of</strong><br />
the Los Angeles Lakers and Kings until both teams moved to the Staples Center at the<br />
start <strong>of</strong> the 1999-2000 seasons respectively 64 . Forum Enterprises, Inc. purchased The<br />
Forum in December 2000. Dr. Kenneth C. Ulmer, is the President & CEO <strong>of</strong> Forum<br />
Enterprises, Inc. The Forum still provides a state <strong>of</strong> the art venue for a variety <strong>of</strong> uses<br />
including concerts, trade shows, sporting events, theatre productions, large conferences<br />
and conventions. Additionally, every Sunday, Dr. Ulmer hosts the Faithful Central Bible<br />
Church praise and worship service. 65 While no longer home to pr<strong>of</strong>essional sports teams,<br />
The Forum is still an important recreation venue for the <strong>City</strong> <strong>of</strong> <strong>Inglewood</strong> and the<br />
Southern California region.<br />
<strong>Inglewood</strong> is also home to Hollywood Park, one <strong>of</strong> the West Coast’s first thoroughbred<br />
horse racing venues. First opened in 1938, the 240-acre Hollywood Park consists <strong>of</strong> the<br />
main racing facility; which includes the main and infield turf tracks, the infield lakes, and<br />
north park, that includes a large all-grass area with concessions and a playground for<br />
children, the paddock and the grandstands, turf club and press boxes. 66<br />
The Hollywood Park-Casino, a $20-million, state-<strong>of</strong>-the-art gaming complex, opened<br />
July 1, 1994. It is now operated by Pinnacle Entertainment Inc. (formerly Hollywood<br />
Park Inc.). The 24-hour facility features more than 150 live-action tables <strong>of</strong>fering a variety<br />
<strong>of</strong> "California Casino Games. 67 " The site includes the Citation Restaurant, 300-seat sports<br />
lounge, a 24-hour health club, private karaoke suites, a pr<strong>of</strong>essional massage center,<br />
beauty salon/barber shop, gift shop and meeting space for up to 2,000 guests. Live and<br />
simulcast wagering is <strong>of</strong>fered at the Casino in the Finish Line Bar.<br />
Though not technically a recreation area, the <strong>Inglewood</strong> Park Cemetery encompasses a<br />
340-acre site within the <strong>City</strong>. The site provides open space and a quite scenic area in the<br />
<strong>City</strong> where people can walk, sit or enjoy peaceful reflection. People travel to <strong>Inglewood</strong><br />
Park Cemetery to see the final resting place <strong>of</strong> several notable figures, including singer<br />
Ella Fitzgerald, boxing great Sugar Ray Robinson and several other notable figures from<br />
63 <strong>Inglewood</strong>, <strong>City</strong> <strong>of</strong>, “2005-2006 Annual Budget,” p. x.<br />
64 http://www.nba.com/lakers/history/lakers_history_new.html#35, accessed March 30, 2006.<br />
65 http://www.thelaforum.com/index1.html, accessed March 30, 2006<br />
66 http://www.hollywoodpark.com/visit/facilities.html, accessed March 30, 2006.<br />
67 California casinos are allowed by law to <strong>of</strong>fer electronic gaming machines, blackjack, and other card<br />
games. Craps and roulette are not permitted, but some California casinos have modified these games to be<br />
played with cards rather than dice or roulette wheels.<br />
4.2-8<br />
<strong>City</strong> <strong>of</strong> <strong>Inglewood</strong> <strong>General</strong> <strong>Plan</strong> <strong>Update</strong> Technical Background Report
4.2 Recreation and Parks<br />
the stage and screen to the halls <strong>of</strong> Washington, D.C., from the many fields <strong>of</strong> sports to<br />
the civic entrepreneurs <strong>of</strong> the South Bay area. 68<br />
The <strong>City</strong> also contains a wide range <strong>of</strong> private and/or commercial recreational facilities,<br />
many <strong>of</strong> which are <strong>of</strong>fered to members, guests or students only. Examples include private<br />
gyms, bowling alleys, and swimming pools. Recreational facilities within multi-family<br />
developments also provide a variety <strong>of</strong> active and passive recreational opportunities for<br />
residents.<br />
Regional Park and Recreation Facilities<br />
Edward Vincent Jr. Park, within the <strong>City</strong> <strong>of</strong> <strong>Inglewood</strong>, is a 55-acre regional park,<br />
described above in Table 4.2-1. North <strong>of</strong> <strong>Inglewood</strong> is the Kenneth Hahn State<br />
Recreation Area, a regional park managed by the Los Angeles County Department <strong>of</strong><br />
Parks and Recreation. The park includes large areas <strong>of</strong> native coastal sage scrub habitat,<br />
lawns and landscaped areas, picnic sites, four playgrounds, two baseball diamonds, a<br />
basketball court, tot lots, a fishing lake, lotus pond, and seven miles <strong>of</strong> trails.<br />
According to the results <strong>of</strong> the <strong>City</strong> <strong>of</strong> <strong>Inglewood</strong> Recovery Action Program Survey (2003), other<br />
nearby parks and recreational areas used by the residents <strong>of</strong> <strong>Inglewood</strong> include 69 Ladera<br />
Park, in Ladera Heights; St. Andrews Park, in Westchester; Lennox Park in Lennox;<br />
Baldwin Park in Los Angeles; El Dorado Park in Long Beach; and Griffith Park in Los<br />
Angeles. Other popular responses for recreation opportunities included Santa Monica<br />
State Beach, Manhattan Beach, and Malibu State Beach.<br />
Park Usage<br />
The National Recreation and Park Association (NRPA) standard is five acres <strong>of</strong> parkland<br />
per 1,000 residents <strong>of</strong> “local or close to home open space.” <strong>Inglewood</strong> provides 0.8-acres<br />
<strong>of</strong> parkland per 1,000 residents, and due to the urbanized nature <strong>of</strong> the <strong>City</strong>, further<br />
acquisition <strong>of</strong> park lands is unlikely. Future increases in the <strong>City</strong>’s population will increase<br />
demand on existing parks and park facilities. The national standard, however, does not<br />
account for the open space provided within public schools and private arenas. While the<br />
<strong>City</strong> has not established its own standard ratio or goal <strong>of</strong> open space-to-population, there<br />
is less <strong>of</strong> a dependence upon public facilities in some parts <strong>of</strong> <strong>Inglewood</strong> due to the<br />
availability <strong>of</strong> non-public open space and recreation resources.<br />
According to the Recovery Action Program for the <strong>City</strong> <strong>of</strong> <strong>Inglewood</strong>’s Park System, northern and<br />
northeastern <strong>Inglewood</strong> are adequately served by parks having recreational facilities while<br />
the southern and southwestern neighborhoods are not served adequately by comparable<br />
facilities. These areas are densely populated with mostly apartments and have the greatest<br />
68 http://www.inglewoodparkcemetery.org/heritage.html<br />
69 <strong>Inglewood</strong>, <strong>City</strong> <strong>of</strong>, “Recovery Action Program for 2002-2003; Survey Results,” page 10.<br />
<strong>City</strong> <strong>of</strong> <strong>Inglewood</strong> <strong>General</strong> <strong>Plan</strong> <strong>Update</strong> Technical Background Report<br />
4.2-9
Chapter 4 Community Services<br />
need for new parks and recreational facilities and should be given priority in the planning,<br />
acquisition and development <strong>of</strong> lands to resolve these park needs. 70<br />
Although NRPA standards are useful in determining a benchmark for appropriate<br />
allocations <strong>of</strong> recreational facilities, actual demand will vary from city to city. <strong>Inglewood</strong> is<br />
a built-out city with no significant vacant tracts <strong>of</strong> land, and must address recreational<br />
demand on an as-needed basis. Current opportunities include the reconfiguring <strong>of</strong><br />
existing playing fields and recreational facilities and the development <strong>of</strong> new skateparks,<br />
expanding recreational programs to accommodate additional demand, and possible open<br />
space areas as the Hollywood Park Race Track is transitioned to a new land use over time.<br />
Recreational and Community Service Programs<br />
The four divisions <strong>of</strong> the <strong>Inglewood</strong> Department <strong>of</strong> Parks, Recreation and Community<br />
Services are Parks Administration, Recreation and Cultural Services, Human Services, and<br />
Community Services. These divisions coordinate the provision <strong>of</strong> leisure and cultural<br />
opportunities to residents through a variety <strong>of</strong> programs and facilities, as described below.<br />
Recreation and Cultural Services<br />
Recreation and Cultural programs are structured to meet the recreational interests <strong>of</strong> all<br />
<strong>Inglewood</strong>’s residents. Baby/toddler classes, adult and youth classes and sports, youth<br />
childcare and after-school programs, teen programs, summer youth camps, senior<br />
programs, and adult and senior excursions are <strong>of</strong>fered through the Parks, Recreation and<br />
Community Services Department. Cultural and recreational programs in the <strong>City</strong> are<br />
conducted at many <strong>City</strong> facilities, including neighborhood parks, <strong>City</strong> Hall, the public<br />
library, community centers, clubhouses, and public schools. 71 Art and Cultural Events<br />
programs include the Annual South Bay Jazz Festival, <strong>Inglewood</strong> Celebrates the Arts,<br />
<strong>Inglewood</strong> Idol, and other various community-wide special events.<br />
One <strong>of</strong> the main focus’s <strong>of</strong> the Department is to provide services for children <strong>of</strong> all ages.<br />
To that end, the <strong>City</strong> entered into a three year agreement with the Training Research<br />
Foundation, a private non-pr<strong>of</strong>it foundation that administers thirteen Head Start<br />
Programs throughout Los Angeles County, 72 to continue to operate a Head Start Program<br />
at Rogers Park. Head Start is a comprehensive child development program which serve<br />
children from birth to age 5, pregnant women, and their families. They are child-focused<br />
programs and have the overall goal <strong>of</strong> increasing the school readiness <strong>of</strong> young children<br />
in low-income families 73 .<br />
70 <strong>Inglewood</strong>, <strong>City</strong> <strong>of</strong>, “Recovery Action Program for the <strong>City</strong> <strong>of</strong> <strong>Inglewood</strong>’s Park System,” December<br />
2002, page 12.<br />
71 <strong>Inglewood</strong>, <strong>City</strong> <strong>of</strong>, “Parks, Recreation and Community Services Department 2004 Annual Report,”<br />
2004<br />
72 https://laworks.primeworks.org/ Accessed March 30, 2006.<br />
73 http://www.acf.hhs.gov/programs/hsb/about/generalinformation/index.htm, Accessed March 30,<br />
2006.<br />
4.2-10<br />
<strong>City</strong> <strong>of</strong> <strong>Inglewood</strong> <strong>General</strong> <strong>Plan</strong> <strong>Update</strong> Technical Background Report
4.2 Recreation and Parks<br />
The recent improvements <strong>of</strong> pre-school facilities with the completion <strong>of</strong> the Rogers Park<br />
Pre-School Renovation Project have corresponded with increased enrollment at that<br />
facility. In fact, enrollment has increased at all pre-school facilities operated by the<br />
Department, with waiting lists at Siminski and Vincent Parks. 74 In response to the need<br />
for additional child care services, the Department provides the After School Recreation<br />
Program for elementary school children within the <strong>Inglewood</strong> Unified School District.<br />
This program provides cultural and recreational activities, as well as study groups and<br />
tutoring services for children with special needs. Additionally, the Department served<br />
over 45,920 participants <strong>of</strong> various ages with sports programs in 2004, 75 with activities<br />
including flag football, tennis, s<strong>of</strong>tball, basketball, track and field, boxing, baseball, soccer<br />
and volleyball.<br />
Human Services<br />
The Human Services Division makes a significant contribution to improving the quality<br />
<strong>of</strong> life for <strong>Inglewood</strong>’s residents through provision <strong>of</strong> services such as a College Resource<br />
Lab, food distribution programs, after school and summer lunch programs, senior<br />
services, care management, transportation services, volunteer opportunities and many<br />
other intergenerational programs and services that appeal to youth, adults and seniors.<br />
The Human Services Division <strong>of</strong> the Department <strong>of</strong> Parks, Recreation and Community<br />
Services manages <strong>Inglewood</strong>’s Senior Center. The existing 30+ year-old building is too<br />
small to serve its senior constituency in need <strong>of</strong> community services. 76 The Senior Center<br />
serves 500 to 600 persons a day with recreation, clubs, transportation, classes and social<br />
services. Food service in the facility is functioning at a maximum at this time, preparing<br />
and serving 600 meals a day, some <strong>of</strong> which are transported to seniors <strong>of</strong>f-site.<br />
Parks Administration<br />
The Parks Division is responsible for maintaining <strong>City</strong> parks, parkways, center medians,<br />
islands, and trees on <strong>City</strong> property, as well as responding to requests from constituents<br />
and <strong>City</strong> Council Members. The Division also implements the Tree Master <strong>Plan</strong>, which<br />
sets out principles and strategies for conserving the existing tree population and provides<br />
a framework for sensitively integrating new plantings within the <strong>City</strong>. The Maintenance<br />
Division also provides logistical support for special events held by the Parks, Recreation<br />
and Community Services Department, as well as other <strong>City</strong> Departments or Elected<br />
Officials.<br />
Community Services<br />
The Community Services Division is responsible for community beautification and<br />
fostering neighborhood preservation. These goals are accomplished through responsive<br />
74 <strong>Inglewood</strong>, <strong>City</strong> <strong>of</strong>, “Parks, Recreation and Community Services Department 2004 Annual Report,” 2004<br />
75 <strong>Inglewood</strong>, <strong>City</strong> <strong>of</strong>, “Parks, Recreation and Community Services Department 2004 Annual Report,” 2004<br />
76 Andrade, Diana P. 2006. Email with Parks, Recreation and Community Services Department, March 13<br />
<strong>City</strong> <strong>of</strong> <strong>Inglewood</strong> <strong>General</strong> <strong>Plan</strong> <strong>Update</strong> Technical Background Report<br />
4.2-11
Chapter 4 Community Services<br />
and pr<strong>of</strong>essional blight mitigation and eradication activities in the areas <strong>of</strong> property<br />
maintenance, code enforcement and graffiti abatement.<br />
The Division consists <strong>of</strong> the following:<br />
• Code Enforcement—property maintenance issues, (formerly <strong>of</strong> the Community<br />
Development Department)<br />
• Graffiti Abatement– graffiti removal from public and private property (formerly <strong>of</strong><br />
the Public Works Department)<br />
• Regulatory Setting<br />
The Parks, Recreation and Community Services Department is guided by the 1995 Open<br />
Space Element <strong>of</strong> the <strong>City</strong>’s <strong>General</strong> <strong>Plan</strong>. This document outlines goals and policies for<br />
the <strong>City</strong> parkland and recreational activities, as well as outlining the various sources for<br />
Department Funding.<br />
• Issues<br />
• The <strong>City</strong> provides a low ratio <strong>of</strong> parkland to residents. While the northern and<br />
northeastern parts <strong>of</strong> <strong>Inglewood</strong> are adequately served by parks having recreational<br />
facilities; the southern and southwestern parts are not served by comparable<br />
facilities. 77<br />
• Given the limited potential for new parkland acquisition, attention should continue<br />
to focus on improving access to and increasing the availability <strong>of</strong> recreational<br />
opportunities.<br />
• The Senior Center is crowded beyond capacity. A new Senior Center has been<br />
planned and approved; however, a funding source has not been identified.<br />
• Land acquired by the <strong>City</strong> in the southern and southwestern parts <strong>of</strong> the <strong>City</strong> with<br />
aircraft noise mitigation funds should be explored for recreational opportunities.<br />
• References<br />
Andrade, Diana P. 2006. Email with Parks, Recreation and Community Services<br />
Department, March 13.<br />
California State Parks Department. 2006. Kenneth Hahn State Recreation Area. Website:<br />
http://www.parks.ca.gov/, accessed March 1.<br />
Forum, The. 2006. Website: http://www.thelaforum.com/index1.html, accessed March<br />
30.<br />
Head Start. 2006. Website:<br />
http://www.acf.hhs.gov/programs/hsb/about/generalinformation/index.htm,<br />
accessed March 30.<br />
77 <strong>Inglewood</strong>, <strong>City</strong> <strong>of</strong>, “Recovery Action Program for the <strong>City</strong> <strong>of</strong> <strong>Inglewood</strong>’s Park System,” December<br />
2002, page 12.<br />
4.2-12<br />
<strong>City</strong> <strong>of</strong> <strong>Inglewood</strong> <strong>General</strong> <strong>Plan</strong> <strong>Update</strong> Technical Background Report
4.2 Recreation and Parks<br />
Hollywood Park. 2006. Website: http://www.hollywoodpark.com/visit/facilities.html,<br />
accessed March 30, 2006.<br />
<strong>Inglewood</strong>, <strong>City</strong> <strong>of</strong>, “2005-2006 Annual Budget”.<br />
<strong>Inglewood</strong>, <strong>City</strong> <strong>of</strong>, “Recovery Action Program for the <strong>City</strong> <strong>of</strong> <strong>Inglewood</strong>’s Park System,”<br />
December 2002, page 12.<br />
<strong>Inglewood</strong>, <strong>City</strong> <strong>of</strong>, “Parks, Recreation and Community Services Department 2004<br />
Annual Report,” 2004<br />
<strong>Inglewood</strong> Park Cemetery. 2006. Website:<br />
http://www.inglewoodparkcemetery.org/heritage.html, accessed March 30, 2006.<br />
Los Angeles Lakers. 2006. Lakers History. Website:<br />
http://www.nba.com/lakers/history/lakers_history_new.html#35, accessed March<br />
30.<br />
Meshack-Maden, Danita. 2006. Email with Parks, Recreation and Community Services<br />
Department, March 21.<br />
Training and Research Foundation, The. 2006. Website: https://laworks.primeworks.org<br />
<strong>City</strong> <strong>of</strong> <strong>Inglewood</strong> <strong>General</strong> <strong>Plan</strong> <strong>Update</strong> Technical Background Report<br />
4.2-13
4.3 Library Services<br />
4.3 LIBRARY SERVICES<br />
This section describes the <strong>City</strong> <strong>of</strong> <strong>Inglewood</strong>’s existing library services. Information for<br />
this section is based on the <strong>City</strong>’s website and discussions with staff at the Public<br />
Library 78 .<br />
• Existing Conditions<br />
Library Facilities<br />
The <strong>Inglewood</strong> Library Department currently manages and operates three libraries; the<br />
<strong>Inglewood</strong> Main Library, the Morningside Park Branch Library and the Crenshaw-<br />
Imperial Branch Library, which is closed until early summer 2006 due to renovations.<br />
Figure 4.3-1 identifies the locations <strong>of</strong> the <strong>City</strong>’s libraries. As <strong>of</strong> March 2006, the Library<br />
Department has 30 full-time staff working at its three branches.<br />
The <strong>Inglewood</strong> library system includes a number <strong>of</strong> materials and databases including<br />
books, magazines, periodicals, business materials, s<strong>of</strong>tware, sound recordings, computer<br />
games, reference documents, and community information available for use by patrons.<br />
Many <strong>of</strong> these materials are also available in Spanish. Internet access is also available and<br />
many reference materials are available by electronic access via the Library’s database.<br />
The <strong>Inglewood</strong> library system provides more than 150,000 books for youth at the Main<br />
Library and branches as well as young adult and children's videos and sound recordings at<br />
the Audio-Visual Division, Main Library. The Library Department defines "youth" as<br />
young people from infants through the eighth grade.<br />
As <strong>of</strong> June 30, 2005, the most recent data available, the <strong>Inglewood</strong> Library Department<br />
had 78,204 79 registered borrowers, accounting for 67 percent <strong>of</strong> the <strong>City</strong>’s 2005<br />
population. The annual circulation rate for fiscal year 2004/05 was 291,939 80 ; this number<br />
includes books, periodicals and audio/video materials that were in checkout usage for the<br />
department.<br />
The <strong>Inglewood</strong> Main Library<br />
The Main Library, located at 101 W. Manchester Boulevard, has a collection <strong>of</strong> over<br />
400,000 volumes, including 1,500 periodical subscriptions. The library is open Monday<br />
through Saturday and on Sunday afternoons. The Main Library also includes a Special<br />
Collections inventory that is housed in special rooms for the use <strong>of</strong> patrons, as well as an<br />
Audio-Visual Division collection.<br />
78 Personal with Richard Siminski, Library Director, March 14, 2006.<br />
79 Ibid.<br />
80 Ibid.<br />
<strong>City</strong> <strong>of</strong> <strong>Inglewood</strong> <strong>General</strong> <strong>Plan</strong> <strong>Update</strong> Technical Background Report<br />
4.3-1
Chapter 4 Community Services<br />
The Main Library also has numerous study/conference rooms accommodating one to<br />
five persons. The Gladys Waddingham Lecture Hall is also available for larger groups up<br />
to 199 persons.<br />
The Morningside Park Library and the Crenshaw-Imperial Library Branches<br />
The Morningside Park Library Branch is located at 3202 West 85th Street. The<br />
Morningside Park Library’s resources include approximately 19,700 books, magazines,<br />
and sound recordings, as well as Internet access, educational computer games, word<br />
processing, spreadsheet s<strong>of</strong>tware, and an electronic encyclopedia, dictionary, and atlas<br />
materials. 81<br />
The Crenshaw-Imperial Branch is located at 11141 Crenshaw Boulevard. It is currently<br />
closed for renovations to provide several upgrades, including the installation <strong>of</strong> new air<br />
conditioning units, lighting, security systems, wireless computer access, and accessibility<br />
improvements. Work is scheduled to be completed in early summer, 2006.<br />
• Library Services<br />
The <strong>Inglewood</strong> Library System <strong>of</strong>fers a number <strong>of</strong> services to assist its users. Besides the<br />
traditional services <strong>of</strong> materials loaned and research questions answered, computer<br />
services are quite popular. They include the online library catalog, a number <strong>of</strong> research<br />
database subscriptions <strong>of</strong>fered free to cardholders, a web page<br />
(www.inglewoodlibrary.org), and free public access computing. Internet access is available<br />
through library computers and through wireless “hot spot” access to those bringing in<br />
their own laptop computers. Through the Library Department’s web page, a wide variety<br />
<strong>of</strong> online services are <strong>of</strong>fered, including catalog searches, and “AskNow”, an online<br />
interactive reference service, available 24 hours a day, 7 days a week. Among the key<br />
services provided by the Library Department are the following 82 :<br />
• Administrative Services is responsible for the overall operation <strong>of</strong> the Library<br />
Department, setting policy, and answering questions about library service and<br />
operations. Reservations for the Gladys Waddingham Lecture Hall go through<br />
Administration, as do Passport and Notary services, and most library personnel and<br />
budget matters.<br />
• The Adult Services/Reference Division provides reference and information service to all<br />
<strong>of</strong> the library's clientele. Librarians in this division select and maintain current<br />
reference and adult materials, including automated information services, conduct<br />
tours for the public, provide informational and cultural library programs, and <strong>of</strong>fer<br />
instruction in the use <strong>of</strong> library materials, resources, and automated services.<br />
81 http://www.city<strong>of</strong>inglewood.org/depts/library/library_services/branch_library_services.asp, accessed<br />
March 3, 2006.<br />
82 http://www.city<strong>of</strong>inglewood.org/depts/library/contact_us/directory_<strong>of</strong>_staff.asp, accessed March 3,<br />
2006.<br />
4.3-2<br />
<strong>City</strong> <strong>of</strong> <strong>Inglewood</strong> <strong>General</strong> <strong>Plan</strong> <strong>Update</strong> Technical Background Report
CITY <strong>of</strong> INGLEWOOD<br />
<strong>General</strong> <strong>Plan</strong><br />
LIBRARY LOCATIONS<br />
Legend<br />
1, Crenshaw-Imperial Library<br />
2, <strong>Inglewood</strong> Main Library<br />
3, Morningside Park Library<br />
<strong>City</strong> Boundary<br />
Water Body<br />
Metro Rail<br />
Railroad<br />
Source: <strong>City</strong> <strong>of</strong> <strong>Inglewood</strong>, February 2006.<br />
Date: May 15, 2006<br />
Miles<br />
A Division <strong>of</strong> 0 0.25 0.5<br />
Figure 4.3-1
4.3 Library Services<br />
• The Audio-Visual Division <strong>of</strong>fers a selection <strong>of</strong> popular and subject DVDs and<br />
videotapes, music audios and audio books on compact disc and audiotape.<br />
Recordings are in English, Spanish, and Vietnamese. Audio-visual staff maintains a<br />
circulation desk responsible for checking out and returning most AV items. The<br />
Division also maintains audio and visual workstations and the Language Learning<br />
Center with programs and equipment for learning Spanish, German, French,<br />
Portuguese, and English as a second language.<br />
• The Branch Library Services provides library services and resources that reflect the<br />
needs and interests <strong>of</strong> the branch communities. Free public access computing is<br />
available on Library computers.<br />
• The Children's/Youth Services Division <strong>of</strong>fers resources to children and young adults<br />
from infancy through grade twelve. The division maintains a public service desk<br />
staffed by pr<strong>of</strong>essional librarians who <strong>of</strong>fer reference and readers advisory services;<br />
provides a variety <strong>of</strong> current materials with access through automated public<br />
catalogs; conducts school visits; and presents programs for children. Free public<br />
access computing for children is available in the Children’s room.<br />
• The Circulation Division maintains two public service desks (checkout/return and<br />
registration/overdues) at all times the Main Library is open and circulates an<br />
estimated 420,000 items at the Main Library. The Division notifies borrowers when<br />
books they have reserved are available. The registration component registers some<br />
23,000 borrowers and issues approximately 30,000 library cards each year. It also<br />
generates overdue notices for resources not returned on time and sends selected<br />
accounts to collections.<br />
• The Hispanic Services Division provides reference and information service in Spanish<br />
during operating hours to Spanish-speaking clients. The division is charged with<br />
developing and maintaining Spanish language materials collections for adults and<br />
children. Hispanic Services staff conducts tours for the public, provides<br />
informational and cultural library programs, and <strong>of</strong>fers instruction in the use <strong>of</strong><br />
library materials and resources to Spanish-speaking clients.<br />
• The Serial Publications Division is responsible for acquiring, processing, and<br />
maintaining serial and document resources, and for maintaining and updating the<br />
Library’s subscription databases. Serials resources, whether housed inside the<br />
library or accessed online, constitute a major part <strong>of</strong> the Library's reference and<br />
information service. The Library is the only select depository for federal and state<br />
government documents in the local area. The division also maintains a public<br />
service desk and assists the public in the use <strong>of</strong> the Library’s study rooms, in<br />
locating materials, and in the use <strong>of</strong> the public access computers and micr<strong>of</strong>orm<br />
equipment.<br />
• The Stack Maintenance/Security aides keep up book stacks by shelving and shelfreading<br />
the Main Library book collection <strong>of</strong> some 370,000 volumes. The division is<br />
also responsible for security at the Main Library, a service primarily contracted<br />
through a local security company.<br />
• The Technical Services Division is responsible for obtaining, cataloging, and readying<br />
materials for public use. The staff maintains materials collections throughout the<br />
library system, adding, transferring and withdrawing materials as needed. Technical<br />
Processing is responsible for cataloging, classifying, and entering materials in the<br />
<strong>City</strong> <strong>of</strong> <strong>Inglewood</strong> <strong>General</strong> <strong>Plan</strong> <strong>Update</strong> Technical Background Report<br />
4.3-5
Chapter 4 Community Services<br />
Library’s materials database where they can be viewed through the online catalog<br />
and checked out through the circulation system. In addition, the Division continues<br />
the development <strong>of</strong> automated Library systems, working with the city's<br />
Information Technology and Communications Department and outside vendors as<br />
necessary.<br />
• Issues<br />
• Overall library usage has been declining for the past two years.<br />
• References<br />
Personal communication with Richard Siminski, Library Director, March 14, 2006.<br />
http://www.city<strong>of</strong>inglewood.org/depts/library/library_services/branch_library_services.<br />
asp, accessed March 3, 2006.<br />
http://www.city<strong>of</strong>inglewood.org/depts/library/contact_us/directory_<strong>of</strong>_staff.asp,<br />
accessed March 3, 2006.<br />
4.3-6<br />
<strong>City</strong> <strong>of</strong> <strong>Inglewood</strong> <strong>General</strong> <strong>Plan</strong> <strong>Update</strong> Technical Background Report
CHAPTER 5<br />
Environmental Resources<br />
This chapter describes the <strong>City</strong> <strong>of</strong> <strong>Inglewood</strong>’s existing environmental resources. This<br />
chapter includes the following sections:<br />
• Biological Resources<br />
• Hydrology and Water Quality<br />
• Topography and Hillsides<br />
• Visual Resources<br />
• Historical-Cultural Resources<br />
• Air Quality<br />
5.1 BIOLOGICAL RESOURCES<br />
This section provides information regarding existing biological resources within the <strong>City</strong><br />
<strong>of</strong> <strong>Inglewood</strong> and is based on a review <strong>of</strong> literature pertaining to the habitats, plants, and<br />
animals <strong>of</strong> the <strong>City</strong> and the region. Data sources include the California Natural Diversity<br />
Database (Natural Diversity Database), which is maintained by the California Department<br />
<strong>of</strong> Fish and Game (CDFG). The Natural Diversity Database identifies sensitive habitats<br />
and species that may be encountered within a specific United States Geologic Survey<br />
(USGS) quadrangle, and the particular area in the quadrangle where the habitat or species<br />
was identified.<br />
• Existing Conditions<br />
The <strong>City</strong> <strong>of</strong> <strong>Inglewood</strong> is fully developed with urban uses and has little undisturbed native<br />
vegetation. As a result, the diversity <strong>of</strong> terrestrial animal species is very low. While no<br />
formal biological studies have been conducted to document species <strong>of</strong> wildlife found in<br />
the <strong>City</strong>, the animal species in the <strong>City</strong> are likely to be dominated by common native and<br />
non-native animal species that thrive in an urban environment.<br />
Due to the urbanized nature <strong>of</strong> the <strong>City</strong>, the abundance and diversity <strong>of</strong> reptile and<br />
amphibian species in the <strong>City</strong> is also very low. This group <strong>of</strong> animals is particularly<br />
susceptible to exposure and lack <strong>of</strong> habitat.<br />
Some migratory bird species pass through the <strong>City</strong>. Due to their mobility and range <strong>of</strong><br />
travel, avian species tend to be more abundant and conspicuous than other animals.<br />
There is a component <strong>of</strong> migratory birds passing through the <strong>City</strong> while moving from<br />
wintering grounds in the south to breeding grounds in the north. The number <strong>of</strong> resident<br />
bird species in the <strong>City</strong> is low due to the lack <strong>of</strong> undisturbed habitat.<br />
The level <strong>of</strong> development in the <strong>City</strong> is conducive to an environment for non-native<br />
terrestrial mammal species and provides little opportunity for resident native species.<br />
Non-native mammals that may potentially occur in the <strong>City</strong> include the house mouse<br />
(Mus musculus), Norway rat (Rattus norvegicus), black rat (Rattus rattus), and domestic cats<br />
and dogs. Some native terrestrial mammal species may occur within the <strong>City</strong>, especially in<br />
<strong>City</strong> <strong>of</strong> <strong>Inglewood</strong> <strong>General</strong> <strong>Plan</strong> <strong>Update</strong> Technical Background Report<br />
5.1-1
Chapter 5 Environmental Resources<br />
those areas closest to the foothills <strong>of</strong> the Santa Monica Mountains and among those<br />
mammals adaptable to human presence. These species include the California ground<br />
squirrel (Spermophilus beecheyi), coyote (Canis latrans), and raccoon (Procyon lotor). <strong>General</strong>ly,<br />
however, the numbers and kinds <strong>of</strong> mammals found within the <strong>City</strong> limits are low.<br />
<strong>Plan</strong>t Life<br />
Review <strong>of</strong> GIS databases and aerial photographs indicate that there is little native<br />
terrestrial vegetation within the <strong>City</strong> <strong>of</strong> <strong>Inglewood</strong>. The only relatively undisturbed areas<br />
include those located near the foothills <strong>of</strong> the Santa Monica Mountains and the few open<br />
space areas located in the <strong>City</strong>, and portions near the Centinela creek, and Dominguez<br />
creek. No other area exists within the <strong>City</strong> limit that is able to support native plant<br />
communities. The remaining open space within the <strong>City</strong> is located in public parks, which<br />
typically do not contain natural or native vegetation. The principal terrestrial vegetation in<br />
this highly urbanized setting consists <strong>of</strong> landscape vegetation and other cultivated species<br />
with some invasive, weedy, non-native plants in areas that are not maintained. No unique<br />
plants can be found at destinations within any <strong>of</strong> the <strong>City</strong> parks. However, descriptions<br />
have been provided in Appendix B to illustrate the few types <strong>of</strong> plant life that exists in<br />
some <strong>of</strong> the natural areas <strong>of</strong> the <strong>City</strong> as well as the surrounding areas.<br />
Wildlife Movement<br />
Wildlife corridors vary greatly in their overall significance. <strong>General</strong> information that<br />
currently exists on corridors suggests that major drainages, canyon bottoms, and<br />
ridgetops, as well as areas that provide important resources for wildlife, will be the most<br />
significant for wildlife movement. In general, two types <strong>of</strong> corridors exist. Regional<br />
corridors are generally those that allow movement between large, <strong>of</strong>ten widely separated<br />
areas. These may connect National Forests, mountain ranges, or other major wildlife use<br />
areas. Local wildlife corridors are those that allow dispersion between smaller, generally<br />
more adjacent areas, such as between canyons or ridges, or important resource areas.<br />
Due the highly-urbanized nature <strong>of</strong> the <strong>City</strong>, the potential for overland wildlife movement<br />
through the majority <strong>of</strong> the <strong>City</strong> would be highly restricted. Some local movement <strong>of</strong><br />
wildlife would be expected to occur throughout the <strong>City</strong>.<br />
Biological Resources within <strong>Inglewood</strong> Watersheds<br />
The <strong>City</strong> <strong>of</strong> <strong>Inglewood</strong> is located within the upper boundaries <strong>of</strong> both the Ballona Creek<br />
Watershed and the Dominguez Watersheds. Biological resources within <strong>Inglewood</strong> have<br />
only been reported in the Dominquez Watershed.<br />
Dominguez Watershed<br />
Existing conditions <strong>of</strong> habitats and biological resources within the Dominguez Watershed<br />
are summarized based on review <strong>of</strong> available reports, search <strong>of</strong> the California Natural<br />
Diversity Database (CNDDB), and reconnaissance-level surveys. There are several types<br />
<strong>of</strong> habitats within the Dominguez Watershed. The largest habitat is urban, developed<br />
5.1-2<br />
<strong>City</strong> <strong>of</strong> <strong>Inglewood</strong> <strong>General</strong> <strong>Plan</strong> <strong>Update</strong> Technical Background Report
5.1 Biological Resources<br />
land. Vacant land includes several types <strong>of</strong> habitats ranging from open water to<br />
woodlands. The exact acreage associated with each <strong>of</strong> the habitat types within the<br />
watershed is unavailable since many <strong>of</strong> the open space areas have not been<br />
comprehensively surveyed.<br />
There are five sites within and immediately adjacent to the Dominguez Watershed that<br />
are designated as Significant Ecological Areas (SEA) by the Los Angeles Regional Water<br />
Quality Control Board (Feb, 2000) based on data from the California Department <strong>of</strong> Fish<br />
and Game, State Water Resources Control Board, and Los Angeles County Department<br />
<strong>of</strong> Regional <strong>Plan</strong>ning. These include Madrona Marsh (SEA 36), Harbor Lake Regional<br />
Park (SEA 35), Rolling Hills Canyons (SEA 31), Terminal Island (SEA 33), and Palos<br />
Verdes Peninsula Coastline (SEA 34). The <strong>City</strong> <strong>of</strong> Rolling Hills Estates designated two<br />
areas within the watershed boundaries as Environmentally Sensitive Areas (ESAs):<br />
Rolling Hills Canyons (also a Los Angeles County SEA) and Linden H. Chandler<br />
Preserve.<br />
Special-Status Biological Resources<br />
The following section addresses special-status biological resources observed, reported, or<br />
having the potential to occur within the <strong>City</strong> <strong>of</strong> <strong>Inglewood</strong>. These resources include plant<br />
and wildlife species that have been afforded special status and/or recognition by federal<br />
and state resource agencies, as well as private conservation organizations and special<br />
interest groups such as the California Native <strong>Plan</strong>t Society (CNPS) (List 1A, 1B, and 2).<br />
In general, the principal reason an individual taxon (species, subspecies, or variety) is<br />
given such recognition is the documented or expected decline or limitation <strong>of</strong> its<br />
population size or geographical extent and/or distribution that results in most cases, from<br />
habitat loss.<br />
Although review <strong>of</strong> the Natural Diversity Database reveals several records <strong>of</strong> sensitive<br />
species, most <strong>of</strong> these are believed to be extirpated or no longer existing within the area<br />
due to the level <strong>of</strong> development in the <strong>City</strong>. Field studies would be required to verify the<br />
presence or absence <strong>of</strong> these sensitive species within the <strong>City</strong> limits.<br />
Table 5.1-1 in Appendix B lists sensitive plants, animal and habitat types potentially<br />
occurring in and near the <strong>City</strong> <strong>of</strong> <strong>Inglewood</strong>. Special status habitats are vegetation types,<br />
associations, or sub-associations that support concentrations <strong>of</strong> special status plant or<br />
wildlife species, are <strong>of</strong> relatively limited distribution, or are <strong>of</strong> particular value to wildlife.<br />
Special Status Species Descriptions<br />
The South Coast marsh vole, Coastal dunes milk-vetch, Southern tarplant, Coulter’s<br />
goldfield, and Spreading navarretia (federally/state listed threatened or endangered<br />
species) were identified as (moderately) potentially occurring on-site or reported within an<br />
approximately ten-mile radius <strong>of</strong> the <strong>City</strong> <strong>of</strong> <strong>Inglewood</strong> [see Figure 5.1-1]. Each <strong>of</strong> the<br />
state and/or federally listed species in Appendix B are described in greater detail.<br />
<strong>City</strong> <strong>of</strong> <strong>Inglewood</strong> <strong>General</strong> <strong>Plan</strong> <strong>Update</strong> Technical Background Report<br />
5.1-3
Chapter 5 Environmental Resources<br />
• Regulatory Setting<br />
Federal<br />
Endangered Species Act <strong>of</strong> 1973 (ESA)<br />
The ESA and implementing regulations, Title 16 United States Code (USC) §1531 et seq.<br />
(16 USC 1531 et seq.), Title 50 Code <strong>of</strong> Federal Regulations (CFR) §17.1 et seq. (50 CFR<br />
§17.1 et seq.), includes provisions for the protection and management <strong>of</strong> federally listed<br />
threatened or endangered plants and animals and their designated critical habitats.<br />
Section 7 <strong>of</strong> the ESA requires a permit to take threatened or endangered species during<br />
lawful project activities. The administering agency for the above authority is the USFWS<br />
for terrestrial, avian, and most aquatic species. The National Marine Fisheries Service is<br />
responsible for administering the federal ESA as it applies to marine species and<br />
anadromous fish.<br />
Fish and Wildlife Coordination Act<br />
Section 7 <strong>of</strong> Fish and Wildlife Coordination Act, 16 USC 742 et seq., 16 USC 1531 et seq., and<br />
50 CFR 17 requires consultation if any project facilities could jeopardize the continued<br />
existence <strong>of</strong> an endangered species. Applicability depends on federal jurisdiction over<br />
some aspect <strong>of</strong> the project. The administering agency for these authorities is expected to<br />
be the Corps in coordination with the USFWS.<br />
Migratory Bird Treaty Act (MBTA)<br />
The MBTA (16 USC §§703–711) includes provisions for protection <strong>of</strong> migratory birds,<br />
including the non-permitted take <strong>of</strong> migratory birds, under the authority <strong>of</strong> the USFWS<br />
and CDFG. The MBTA protects over 800 species including geese, ducks, shorebirds,<br />
raptors, songbirds, and many relatively common species.<br />
Clean Water Act <strong>of</strong> 1977, Section 404<br />
This section <strong>of</strong> the Act (33 USC 1251 et seq., 33 CFR §§320 and 323 gives the Corps<br />
authority to regulate discharges <strong>of</strong> dredge or fill material into waters <strong>of</strong> the U.S., including<br />
wetlands.<br />
Clean Water Act <strong>of</strong> 1977, Section 401<br />
This section <strong>of</strong> the Act requires a state-issued Water Quality Certification for all projects<br />
regulated under Section 404. In California, the RWQCB issues Water Quality<br />
Certifications with jurisdiction over the project area. The RWQCB, Los Angeles Region,<br />
issues Section 401 Water Quality Certifications for Los Angeles County.<br />
5.1-4<br />
<strong>City</strong> <strong>of</strong> <strong>Inglewood</strong> <strong>General</strong> <strong>Plan</strong> <strong>Update</strong> Technical Background Report
CITY <strong>of</strong> INGLEWOOD<br />
<strong>General</strong> <strong>Plan</strong><br />
BIOLOGICAL RESOURCES<br />
Legend<br />
1, Coulter's goldfields<br />
2, South coast marsh vole<br />
3, Coastal California gnatcatcher<br />
4, Coastal dunes milk-vetch<br />
5, Southern tarplant<br />
6, Spreading navarretia<br />
Source: CA. Department <strong>of</strong> Fish & Game, January 2006.<br />
Date: April 10, 2006<br />
Miles<br />
A Division <strong>of</strong> 0 0.25 0.5<br />
Figure 5.1-1
5.1 Biological Resources<br />
California Endangered Species Act <strong>of</strong> 1984 (CESA)<br />
The CESA and implementing regulations in the Fish and Game Code, §2050 through<br />
§2089, includes provisions for the protection and management <strong>of</strong> plant and animals<br />
species listed as endangered or threatened, or designated as candidates for such listing.<br />
Incidental take <strong>of</strong> an endangered species is permitted by CDFG only under certain<br />
conditions and provided that the proper federal permits have been obtained and<br />
notifications made to the CDFG as described in Fish and Game Code §2080.1. <strong>Plan</strong>ts <strong>of</strong><br />
California declared to be endangered, threatened, or rare are listed at 14 CCR §670.2.<br />
Animals <strong>of</strong> California declared to be endangered or threatened are listed at 14 CCR<br />
§670.5.14. CCR §15000 et seq. describes the types and extent <strong>of</strong> information required to<br />
evaluate the effects <strong>of</strong> a proposed project on biological resources <strong>of</strong> a project site.<br />
Fish and Game Code <strong>of</strong> California<br />
The Fish and Game Code provides specific protection and listing for several types <strong>of</strong><br />
biological resources.<br />
Section 1580 <strong>of</strong> the Fish and Game Code presents the process and definition for<br />
Designated Ecological Reserves. Designated Ecological Reserves are significant wildlife<br />
habitats to be preserved in natural condition for the general public to observe and study.<br />
Section 1602 <strong>of</strong> the Fish and Game Code requires a Streambed Alteration Agreement for<br />
any activity that may alter the bed and/or bank <strong>of</strong> a stream, river, or channel. Typical<br />
activities that require a Streambed Alteration Agreement include excavation or fill placed<br />
within a channel, vegetation clearing, structures for diversion <strong>of</strong> water, installation <strong>of</strong><br />
culverts and bridge supports, c<strong>of</strong>ferdams for construction dewatering, and bank<br />
reinforcement.<br />
Section 2081(b) and (c) <strong>of</strong> the CESA allows CDFG to issue an incidental take permit for<br />
a state-listed threatened and endangered species only if specific criteria are met. These<br />
criteria can be found in Title 14 CCR, Sections 783.4(a) and (b). No Section 2081(b)<br />
permit may authorize the take <strong>of</strong> “fully protected” species and “specified birds.” If a<br />
project is planned in area where a species or specified bird occurs, an applicant must<br />
design the project to avoid all take; the CDFG cannot provide take authorization under<br />
CESA.<br />
Native <strong>Plan</strong>t Protection Act <strong>of</strong> 1977<br />
The Native <strong>Plan</strong>t Protection Act <strong>of</strong> 1977 and implementing regulations in Section 1900 et seq.<br />
<strong>of</strong> the Fish and Game Code designates rare and endangered plants, and provides specific<br />
protection measures for identified populations. It is administered by the CDFG.<br />
<strong>City</strong> <strong>of</strong> <strong>Inglewood</strong> <strong>General</strong> <strong>Plan</strong> <strong>Update</strong> Technical Background Report<br />
5.1-7
Chapter 5 Environmental Resources<br />
Wetlands Conservation Policy <strong>of</strong> 1993<br />
This policy provides for the protection, preservation, restoration, enhancement, and<br />
expansion <strong>of</strong> wetland habitats in California. Primarily it acts to ensure no overall net loss<br />
<strong>of</strong> wetlands within the state and achieve a long-term net gain in the quantity, quality, and<br />
permanence <strong>of</strong> wetlands acreage and values in California in a manner that fosters<br />
creativity, stewardship, and respect for private property. The administering agencies for<br />
this authority are the CDFG, the California Environmental Protection Agency (Cal-<br />
EPA), and the Regional Water Quality Control Board (RWQCB)—South Coast Region.<br />
Local<br />
<strong>City</strong> <strong>of</strong> <strong>Inglewood</strong> Municipal Code<br />
Under Section 2-164.1 <strong>of</strong> the <strong>City</strong> <strong>of</strong> <strong>Inglewood</strong> Municipal Code, the Recreation, Parks<br />
and Community Service Director will have full jurisdiction and control <strong>of</strong> the designation<br />
<strong>of</strong> the kind and type, planting, setting out, location and placement <strong>of</strong> all trees and shrubs<br />
in the public streets and parkways <strong>of</strong> the <strong>City</strong>. Under Article 3, Section 5-58 (Park<br />
Regulations), parkway plants require provisions that relate to the planting and maintaining<br />
<strong>of</strong> trees and shrubs in the public streets and parkways <strong>of</strong> the <strong>City</strong>.<br />
• Issues<br />
• While there is currently no federal or state listed species in the <strong>City</strong>, if one were to<br />
be identified at a later date, it could impact redevelopment activities within the <strong>City</strong>.<br />
• References<br />
Abrams, L. 1923. Illustrated Flora <strong>of</strong> the Pacific States. Volumes I, II, and III. Stanford<br />
University Press: Stanford, CA.<br />
———. 1960. Illustrated Flora <strong>of</strong> the Pacific States. Volume IV. Stanford University<br />
Press: Stanford, CA.<br />
California, State <strong>of</strong>. 1998. Porter-Cologne Water Quality Control Act.<br />
———. 2004. California Environmental Quality Act, Statutes and Guidelines. Governor’s<br />
Office <strong>of</strong> <strong>Plan</strong>ning and Research: Sacramento.<br />
———. 2002. Fish and Game Code <strong>of</strong> California.<br />
5.1-8<br />
<strong>City</strong> <strong>of</strong> <strong>Inglewood</strong> <strong>General</strong> <strong>Plan</strong> <strong>Update</strong> Technical Background Report
5.2 Hydrology and Water Quality<br />
5.2 HYDROLOGY AND WATER QUALITY<br />
This section describes the existing surface water and groundwater resources within the<br />
<strong>City</strong>, as well as the quality <strong>of</strong> these resources. Federal, state, and local regulations<br />
pertaining to hydrology and water quality are also provided. Information on water<br />
infrastructure and supply and potential flooding hazards can be found in Chapter 3<br />
(Infrastructure) Section 3.1 and Chapter 6 (Community Safety and Hazards) Section 6.3,<br />
respectively. Information for this section was obtained from documents provided by the<br />
<strong>City</strong>, California Department <strong>of</strong> Water Resources, Los Angeles Regional Water Quality<br />
Control Board (LARWQCB), and the various <strong>City</strong> documents.<br />
• Existing Conditions<br />
Watershed<br />
Regional Drainage<br />
The <strong>City</strong> <strong>of</strong> <strong>Inglewood</strong> is located within the boundaries <strong>of</strong> three watersheds: Los Angeles,<br />
Ballona, and Dominguez. As illustrated in Figure 5.2-1, the Dominguez Watershed makes<br />
up the greatest portion <strong>of</strong> the <strong>City</strong> and covers approximately 3,900 acres or approximately<br />
67 percent. The Ballona Watershed makes up 1,936 acres (33 percent) and the<br />
Dominguez Watershed covers only one acre (0.02 percent) <strong>of</strong> the <strong>City</strong>.<br />
Local Drainage<br />
The <strong>City</strong> <strong>of</strong> <strong>Inglewood</strong> drainage system drains into the various tributaries <strong>of</strong> each<br />
watershed discussed above. Typically, these areas are predominately channelized and<br />
highly developed with both commercial and residential properties. Most <strong>of</strong> the drainage<br />
networks are controlled by structural flood control measures, including debris basins,<br />
storm drains, underground culverts, and open concrete channels.<br />
Surface Water<br />
The <strong>City</strong> <strong>of</strong> <strong>Inglewood</strong> is a highly developed community with few natural areas. The<br />
drainage tributaries and storage reservoirs in the <strong>City</strong> are associated with the <strong>City</strong>’s water<br />
system infrastructure. Information on this can be found in Chapter 3.<br />
Groundwater<br />
Groundwater is concentrated in areas called basins, which are the natural hydro geological<br />
unit for delineating groundwater. An aquifer is a subsurface saturated geological<br />
formation that contains and transmits significant quantities <strong>of</strong> water. Multiple subbasins<br />
and aquifers may be located within each basin. The <strong>City</strong> is located on the West Coast<br />
Groundwater Basin, which underlies the southwest portion <strong>of</strong> the Los Angeles Coastal<br />
Plain.<br />
<strong>City</strong> <strong>of</strong> <strong>Inglewood</strong> <strong>General</strong> <strong>Plan</strong> <strong>Update</strong> Technical Background Report<br />
5.2-1
Chapter 5 Environmental Resources<br />
The <strong>City</strong> operates four wells immediately south <strong>of</strong> the <strong>City</strong> that draw from the local<br />
aquifer to supplement the <strong>City</strong>’s supply <strong>of</strong> imported water from the Metropolitan Water<br />
District (MWD). Currently the <strong>City</strong> <strong>of</strong> <strong>Inglewood</strong> receives approximately 56 percent <strong>of</strong> its<br />
water supply from local groundwater wells. As groundwater continues to be a valuable<br />
resource, the <strong>City</strong> must avoid the risk <strong>of</strong> overdrafting the aquifers. The risk <strong>of</strong> overdraft<br />
can be avoided through groundwater recharge activities such as recharge basins and<br />
injection wells. To replenish the West Coast Groundwater Basin (and to prevent further<br />
seawater intrusion), the Los Angeles County Flood Control District (LACFCD) created<br />
injection barriers along the West Coast and the Dominguez Gap. The Water<br />
Replenishment District (WRD), which is responsible for managing the basin, has allowed<br />
recycled and imported water to be injected into “seawater intrusion barriers” owned and<br />
operated by the County <strong>of</strong> Los Angeles Department <strong>of</strong> Public Works in the West Coast<br />
Basin. The amount <strong>of</strong> run<strong>of</strong>f can be minimized and infiltration increased by using<br />
permeable pavement for areas such as sidewalks and parking lots in future development.<br />
Subbasins<br />
West Coast Subbasin<br />
The Central Subbasin occupies part <strong>of</strong> the southern portion <strong>of</strong> the Coastal Plain <strong>of</strong> Los<br />
Angeles Groundwater Basin. This subbasin is commonly referred to as the “West Coast<br />
Basin.” The Bellflower aquiclude also falls within the West Coast Basin along with the<br />
Gardena, Gage, Gaspur, Silverado, Lynwood, Sunnyside, and Semiperched aquifers.<br />
Historically, groundwater flow in this basin has been southward and westward from the<br />
Central Coastal Plain toward the Pacific Ocean. Water levels have risen about thirty feet<br />
from levels measured in 1961. Recharge <strong>of</strong> the West Coast Basin is largely limited to<br />
underflow from the Central Basin through and over the Newport-<strong>Inglewood</strong> fault zone.<br />
Seawater intrusion occurs in some aquifers that are exposed to the ocean <strong>of</strong>fshore. Minor<br />
replenishment to the West Coast Basin occurs from infiltration <strong>of</strong> surface inflow from<br />
both the Los Angeles and San Gabriel Rivers into the uppermost aquifers. The total<br />
storage <strong>of</strong> the primary water producing aquifer, the Silverado aquifer, is estimated to be<br />
approximately 6,500,000 af. Data for the entire basin is not available.<br />
Water Quality<br />
Water Quality Constituents <strong>of</strong> Concern<br />
Total Dissolved Solids<br />
Increases in groundwater total dissolved solids (TDS) concentrations are a function <strong>of</strong> the<br />
recharge <strong>of</strong> saline water originating from storm flows, urban run<strong>of</strong>f, imported water, and<br />
incidental recharge. Increased TDS concentrations begin to interfere with water usage<br />
between 500 and 1,000 mg/L. Above 1,000 mg/L TDS water is generally considered<br />
brackish and requires treatment for domestic purposes.<br />
5.2-2<br />
<strong>City</strong> <strong>of</strong> <strong>Inglewood</strong> <strong>General</strong> <strong>Plan</strong> <strong>Update</strong> Technical Background Report
CITY <strong>of</strong> INGLEWOOD<br />
<strong>General</strong> <strong>Plan</strong><br />
WATERSHEDS<br />
B allona<br />
Waters hed<br />
S anta Moni ca<br />
Upper<br />
S anta Monica B ay<br />
Waters hed<br />
Cul ver Ci ty<br />
L OS<br />
ANGE L E S<br />
COU NT Y<br />
L ader a H ei ghts<br />
Vi ew P ar k -<br />
Wi nds or H i l l s<br />
Mar i na<br />
del<br />
R ey<br />
L OS<br />
ANGE L E S<br />
COU NT Y<br />
<strong>City</strong> <strong>of</strong> <strong>Inglewood</strong><br />
L os Angeles<br />
Waters hed<br />
L OS<br />
ANGE L E S<br />
COU NT Y<br />
L ower<br />
S anta Monica B ay<br />
Waters hed<br />
L ennox<br />
Wes tmont<br />
E l S egundo<br />
Del Ai r e<br />
Wes t Athens<br />
Wi l l owbr ook<br />
H awthor ne<br />
Manhattan B each<br />
L awndal e<br />
Dominguez<br />
Waters hed<br />
Al ondr a<br />
P ar k<br />
Gar dena<br />
Wes t<br />
Compton<br />
L OS<br />
ANGE L E S<br />
COU NT Y<br />
Legend<br />
Watershed Boundary<br />
H er mos a<br />
B each<br />
R edondo B each<br />
Car s on<br />
<strong>City</strong> <strong>of</strong> <strong>Inglewood</strong><br />
Source: <strong>City</strong> <strong>of</strong> <strong>Inglewood</strong>, February 2006.<br />
Date: April 6, 2006<br />
A Division <strong>of</strong><br />
Miles<br />
0 0.250.5 1 1.5<br />
Figure 5.2-1
5.2 Hydrology and Water Quality<br />
Nitrates<br />
Most nitrates are associated with agricultural activities and are among California’s leading<br />
contaminants. The federal water quality standard for nitrate is 10 mg/L. At this level the<br />
water is not safe for consumption.<br />
Hydrogen Sulfide<br />
Hydrogen sulfide gas is formed from decomposing underground deposits <strong>of</strong> organic<br />
matter. Hydrogen sulfide gas is a nuisance that is not usually considered a health risk at<br />
the concentrations normally found in household water. Water containing hydrogen<br />
sulfide, commonly called sulfur water, has a distinctive "rotten egg" odor, which may be<br />
especially noticeable when running hot water. Hydrogen sulfide dissolved in water can<br />
also corrode plumbing metals, such as iron, steel, copper, and brass and exposed metal<br />
parts in washing machines and other water-using appliances. Typical treatment methods<br />
include carbon filtration, aeration, and chlorination. The EPA has established a<br />
"secondary" standard related to odor for hydrogen sulfide <strong>of</strong> 250 mg/L.<br />
Iron and Manganese<br />
Iron and manganese occur naturally in geologic formations. They dissolve into<br />
groundwater as acidic rainfall percolates through the soil and rock. In higher<br />
concentrations, iron and manganese can cause the following problems:<br />
• Staining: iron and manganese stain laundry and household water fixtures<br />
• Taste: iron and manganese cause a metallic taste in water<br />
• Appearance: they will <strong>of</strong>ten give an oily appearance, or “crusty” sheen to the<br />
water’s surface<br />
• Clogging: iron and manganese support the growth <strong>of</strong> bacteria that is not considered<br />
a health risk, but can clog strainers, pumps, and valves<br />
Iron in water is not a health hazard by itself but it may increase the hazard <strong>of</strong> pathogenic<br />
organisms, since many <strong>of</strong> these organisms require iron to grow. Manganese in large doses<br />
causes headaches, apathy, irritability, insomnia, and weakness <strong>of</strong> the legs. Long-term<br />
heavy exposure may result in a nervous-system disorder.<br />
The EPA has established “secondary” standards for iron and manganese in drinking<br />
water. These limits are based on aesthetic concerns, such as staining, taste and odor, etc.,<br />
and are as follows:<br />
• Iron = 0.30 mg/L<br />
• Manganese = 0.05 mg/L<br />
EPA has not set health standards for either iron or manganese in drinking water.<br />
Volatile Organic Compounds<br />
Volatile organic compounds (VOCs) are considered human-made contaminants. The<br />
primary source <strong>of</strong> VOCs in the environment is from industrial activities. When VOCs are<br />
<strong>City</strong> <strong>of</strong> <strong>Inglewood</strong> <strong>General</strong> <strong>Plan</strong> <strong>Update</strong> Technical Background Report<br />
5.2-5
Chapter 5 Environmental Resources<br />
spilled or dumped, a portion evaporates, but some soaks into the ground. Once in the<br />
soil, VOCs can be transported to the water table via percolation. This group includes a<br />
wide range <strong>of</strong> individual contaminates; as a result the water quality standards reflect this<br />
wide range.<br />
Surface Water Quality<br />
In general, changes in land use will result in changes in water quality. There is a strong<br />
correlation between decreasing water quality and increasing development. As more land is<br />
developed and more impervious surfaces are created, groundwater recharge is affected as<br />
well as the volume, rate, and quality <strong>of</strong> surface water run<strong>of</strong>f. Urban run<strong>of</strong>f flows into<br />
storm drains and in most cases flows directly to creeks, rivers, lakes, and the ocean.<br />
Polluted run<strong>of</strong>f can have harmful effects on drinking water, recreational water, and<br />
wildlife. The EPA National Water Quality Inventory has identified run<strong>of</strong>f from development<br />
as one <strong>of</strong> the leading sources <strong>of</strong> water quality impairment. Urban run<strong>of</strong>f was ranked as<br />
the sixth leading source <strong>of</strong> impairment in rivers, fourth leading source <strong>of</strong> impairment in<br />
lakes, and the second in estuaries.<br />
As directed by the federal Clean Water Act (CWA), the State Water Resources Control<br />
Board (SWRCB) adopts a list <strong>of</strong> impaired water bodies (the 303(d) list) for the state <strong>of</strong><br />
California. The list was most recently updated in 2002 (adopted in 2003) and identifies<br />
water quality impairments including trash, metals, pathogens, and organic pesticides.<br />
Specifically, high levels <strong>of</strong> dissolved solids, chlorides, sulfates and heavy metals have been<br />
recorded in the Watershed. During wet weather, measurements <strong>of</strong> copper, lead, and zinc<br />
have regularly exceeded values set in the California Toxic Rule. These elevated<br />
contaminate levels restrict the beneficial uses <strong>of</strong> the watershed.<br />
Groundwater Quality<br />
West Coast Subbasin<br />
The TDS concentration, measured from 45 wells across the West Coast Basin, ranges<br />
from 170 to 5,510 mg/L, with an average concentration <strong>of</strong> 720 mg/L. Additionally,<br />
approximately 45 wells were analyzed for inorganic and radiological contaminants,<br />
nitrates, pesticides, and VOCs. The concentration <strong>of</strong> inorganic contaminants in 30 wells<br />
exceeded the maximum contaminant level. The MCL for VOCs was not exceeded at any<br />
<strong>of</strong> the wells in this subbasin. Radiological contaminants were above the maximum<br />
contaminant level in one well and nitrate concentrations were not above the MCL in any<br />
wells.<br />
5.2-6<br />
<strong>City</strong> <strong>of</strong> <strong>Inglewood</strong> <strong>General</strong> <strong>Plan</strong> <strong>Update</strong> Technical Background Report
5.2 Hydrology and Water Quality<br />
• Regulatory Setting<br />
Federal<br />
Safe Drinking Water Act<br />
The Safe Drinking Water Act (SDWA) and subsequent amendments authorize the<br />
Environmental Protection Agency (EPA) to set health-based standards or maximum<br />
contaminant levels (MCL) for drinking water to protect public health against both<br />
naturally-occurring and man-made contaminants. EPA administers the SDWA at the<br />
federal level and establishes MCLs for bacteriological, inorganic, organic and radiological<br />
contaminants (United States Code Title 42, and Code <strong>of</strong> Federal Regulations Title 40).<br />
California EPA administers and enforces the drinking water program and has adopted its<br />
own SDWA, which incorporates the federal SDWA requirements including some<br />
requirements specific only to California (California Health and Safety Code,<br />
Section 116350 and related sections).<br />
The California Office <strong>of</strong> Environmental Health Hazard Assessment (OEHHA) is<br />
initiating evaluation for several chemicals for which new MCLs have been promulgated<br />
by the EPA, which triggers a requirement that OEHHA prepare a Public Health Goal<br />
(PHG) designed to define the level <strong>of</strong> pollutant at which no adverse health effect is<br />
expected to occur. PHG levels are concentrations <strong>of</strong> chemicals in drinking water that are<br />
not anticipated to produce adverse health effects following long-term exposures. These<br />
goals are advisory but must be used as the health basis to update the state’s primary<br />
drinking water standards (MCLs) by the California Department <strong>of</strong> Health Services (DHS)<br />
(Health and Safety Code Section 116365(b)(1). In addition, re-review, as required by<br />
Health and Safety Code Section 116365(e)(1), is being initiated for chemicals for which<br />
initial PHGs were published in 1997 and 1999. Risk assessments are being initiated for<br />
the chemicals listed below that are newly regulated:<br />
• Bromate<br />
• Chlorite<br />
• Haloacetic acid<br />
• Nitrosodimethylamine (NDMA)<br />
A list <strong>of</strong> all public health goals can be found at: http://www.oehha.ca.gov/water/ohg/<br />
allphgs.html.<br />
Federal Clean Water Act<br />
The federal CWA is designed to restore and maintain the chemical, physical, and<br />
biological integrity <strong>of</strong> the nation’s waters. The CWA also directs states to establish water<br />
quality standards for all “waters <strong>of</strong> the United States” and to review and update such<br />
standards on a triennial basis. Other provisions <strong>of</strong> the CWA related to basin planning<br />
include Section 208, which authorizes the preparation <strong>of</strong> waste treatment management<br />
plans, and Section 319, which mandates specific actions for the control <strong>of</strong> pollution from<br />
nonpoint sources. The EPA has delegated responsibility for implementation <strong>of</strong> portions<br />
<strong>City</strong> <strong>of</strong> <strong>Inglewood</strong> <strong>General</strong> <strong>Plan</strong> <strong>Update</strong> Technical Background Report<br />
5.2-7
Chapter 5 Environmental Resources<br />
<strong>of</strong> the CWA to the SWRCB and the Regional Water Quality Control Board (RWQCB),<br />
including water quality control planning and control programs, such as the National<br />
Pollutant Discharge Elimination System (NPDES) Program.<br />
Section 303 <strong>of</strong> the CWA requires states to adopt water quality standards for all surface<br />
waters <strong>of</strong> the United States. Section 304(a) requires the EPA to publish water quality<br />
criteria that accurately reflect the latest scientific knowledge on the kind and extent <strong>of</strong> all<br />
effects on health and welfare that may be expected from the presence <strong>of</strong> pollutants in<br />
water. Where multiple uses exist, water quality standards must protect the most sensitive<br />
use. Water quality standards are typically numeric, although narrative criteria based upon<br />
biomonitoring methods may be employed where numerical standards cannot be<br />
established or where they are needed to supplement numerical standards.<br />
Section 303(c)(2)(b) <strong>of</strong> the CWA requires states to adopt numerical water quality<br />
standards for toxic pollutants for which EPA has published water quality criteria and<br />
which reasonably could be expected to interfere with designated uses in a water body.<br />
All projects resulting in discharges, whether to land or water, are subject to Section 13263<br />
<strong>of</strong> the California Water Code and are required to obtain approval <strong>of</strong> Waste Discharge<br />
Requirements (WDRs) by the RWQCBs. Land and groundwater-related WDRs (i.e., non-<br />
NPDES WDRs) regulate discharges <strong>of</strong> privately or publicly treated domestic wastewater<br />
and process and wash-down wastewater. WDRs for discharges to surface waters also<br />
serve as NPDES permits, which are further described below.<br />
Responsibility for the protection <strong>of</strong> basin water quality in California rests with the<br />
SWRCB and nine RWQCBs. The SWRCB establishes statewide policies and regulations<br />
for the implementation <strong>of</strong> water quality control programs mandated by federal and state<br />
water quality statutes and regulations. The RWQCBs develop and implement Water<br />
Quality Control <strong>Plan</strong>s (Basin <strong>Plan</strong>s) that consider regional beneficial uses, water quality<br />
characteristics, and water quality problems. The Los Angeles Basin <strong>Plan</strong> implements a<br />
number <strong>of</strong> federal and state laws, the most important <strong>of</strong> which are the state Porter-Cologne<br />
Water Quality Control Act and the federal CWA.<br />
NPDES Permits<br />
The NPDES permit system was established in the CWA to regulate both point source<br />
discharges (municipal or industrial discharge at a specific location or pipe) and nonpoint<br />
source discharges (diffuse run<strong>of</strong>f <strong>of</strong> water from adjacent land uses) to surface waters <strong>of</strong><br />
the United States. For point source discharges, each NPDES permit contains limits on<br />
allowable concentrations and mass emissions <strong>of</strong> pollutants contained in the discharge.<br />
For nonpoint source discharges, the NPDES program establishes a comprehensive<br />
stormwater quality program to manage urban stormwater and minimize pollution <strong>of</strong> the<br />
environment to the maximum extent practicable (MEP). The NPDES program consists<br />
<strong>of</strong> (1) characterizing receiving water quality, (2) identifying harmful constituents,<br />
(3) targeting potential sources <strong>of</strong> pollutants, and (4) implementing a Comprehensive<br />
Stormwater Management Program.<br />
5.2-8<br />
<strong>City</strong> <strong>of</strong> <strong>Inglewood</strong> <strong>General</strong> <strong>Plan</strong> <strong>Update</strong> Technical Background Report
5.2 Hydrology and Water Quality<br />
The reduction <strong>of</strong> pollutants in urban stormwater discharge to the MEP through the use<br />
<strong>of</strong> structural and nonstructural Best Management Practices (BMPs) is one <strong>of</strong> the primary<br />
objectives <strong>of</strong> the water quality regulations. BMPs typically used to manage run<strong>of</strong>f water<br />
quality include controlling roadway and parking lot contaminants by installing oil and<br />
grease separators at storm drain inlets, cleaning parking lots on a regular basis,<br />
incorporating peak-flow reduction and infiltration features, such as grass swales,<br />
infiltration trenches, and grass filter strips into landscaping, and implementing educational<br />
programs.<br />
NPDES Phase I (<strong>General</strong> Construction Activity Stormwater Permit)<br />
Phase I <strong>of</strong> the NPDES Program addresses stormwater run<strong>of</strong>f from “medium” and<br />
“large” municipal separate storm sewer systems (MS4s) generally serving populations <strong>of</strong><br />
100,000 or greater, construction activities disturbing five acres <strong>of</strong> land or greater, and ten<br />
categories <strong>of</strong> industrial activities. With respect to the disturbance <strong>of</strong> five acres <strong>of</strong> land or<br />
greater from construction activities, the SWRCB issued one statewide <strong>General</strong><br />
Construction Activity Stormwater Permit (on August 20, 1992) to apply to all<br />
construction activities. Landowners are responsible for obtaining and complying with the<br />
permit but may delegate specific duties to developers and contractors by mutual consent.<br />
For construction activities, the permit requires landowners, or their designated agent, to:<br />
• Eliminate or reduce nonstormwater discharges to stormwater systems and other<br />
waters <strong>of</strong> the United States<br />
• Develop and implement a Stormwater Pollution Prevention <strong>Plan</strong><br />
• Perform inspections <strong>of</strong> stormwater control structures and pollution prevention<br />
measures<br />
A Stormwater Pollution Prevention <strong>Plan</strong> (SWPPP), prepared in compliance with the<br />
Permit, describes the site, erosion and sediment controls, run<strong>of</strong>f water quality monitoring,<br />
means <strong>of</strong> waste disposal, implementation <strong>of</strong> approved local plans, control <strong>of</strong> postconstruction<br />
sediment and erosion control measures and maintenance responsibilities,<br />
and nonstormwater management controls. Dischargers are also required to inspect<br />
construction sites before and after storms to identify stormwater discharge from<br />
construction activity and to identify and implement controls where necessary.<br />
NPDES Phase II<br />
New NPDES Phase II stormwater regulations were finalized and issued by the EPA in<br />
January 2000 in an effort to continue to preserve, protect, and improve the nation’s water<br />
resources from polluted stormwater run<strong>of</strong>f. These new regulations are designed to<br />
implement programs to control urban stormwater run<strong>of</strong>f from additional MS4s in<br />
urbanized areas and the operations <strong>of</strong> small construction sites that were not already<br />
covered by Phase I NPDES permits. The main objectives <strong>of</strong> the Phase II regulations are<br />
to reduce the amount <strong>of</strong> pollutants being discharged to the maximum extent practicable<br />
and protect the quality <strong>of</strong> the receiving waters.<br />
<strong>City</strong> <strong>of</strong> <strong>Inglewood</strong> <strong>General</strong> <strong>Plan</strong> <strong>Update</strong> Technical Background Report<br />
5.2-9
Chapter 5 Environmental Resources<br />
To meet this goal, the permittee must implement a Stormwater Management Program<br />
that addresses six minimum control measures, including (1) public education and<br />
outreach; (2) public participation/involvement; (3) illicit discharge detection and<br />
elimination; (4) construction site stormwater run<strong>of</strong>f control for sites greater than one<br />
acre; (5) post-construction stormwater management in new development and<br />
redevelopment; and (6) pollution prevention/good housekeeping for municipal<br />
operations. These control measures will typically be addressed by developing BMPs.<br />
The LARWQCB completed a revision <strong>of</strong> the NPDES permit for the Los Angeles region<br />
in 1996 and 2001. The revised permit is more comprehensive and specific than the<br />
previous permit and requires the <strong>City</strong> to conduct additional employee education and<br />
institute a construction site inspection program to help mitigate construction-related<br />
stormwater impacts.<br />
Porter-Cologne Water Quality Control Act<br />
The state <strong>of</strong> California Porter-Cologne Water Quality Control Act authorizes the SWRCB to<br />
adopt, review, and revise policies for all waters <strong>of</strong> the state (including both surface and<br />
groundwaters) and directs the RWQCB to develop regional Basin <strong>Plan</strong>s. Section 13170 <strong>of</strong><br />
the California Water Code also authorizes the SWRCB to adopt water quality control<br />
plans on its own initiative.<br />
The Los Angeles Basin <strong>Plan</strong> specifically (1) designates beneficial uses for surface and<br />
ground waters, (2) sets narrative and numerical objectives that must be attained or<br />
maintained to protect the designated beneficial uses and conform to the state’s antidegradation<br />
policy, and (3) describes implementation programs to protect all waters in the<br />
region. In cases where the Basin <strong>Plan</strong> does not contain a standard for a particular<br />
pollutant, other criteria are used to establish a standard. Other criteria may be applied<br />
from SWRCB documents (e.g., the Inland Surface Waters <strong>Plan</strong> and the Pollutant Policy<br />
Document) or from water quality criteria developed under Section 304(a) <strong>of</strong> the CWA.<br />
Reclaimed Water Regulations<br />
Within the state <strong>of</strong> California, reclaimed water is regulated by the U.S. Environmental<br />
Protection Agency (EPA), the SWRCB, RWQCBs, and the state Department <strong>of</strong> Health<br />
Services. The SWRCB has adopted Resolution No. 77-1, Policy with Respect to Water<br />
Reclamation in California. This policy states that the SWRCB and RWQCBs will<br />
encourage and consider or recommend for funding water reclamation projects that do<br />
not impair water rights or beneficial in-stream uses.<br />
The RWQCBs implement the SWRCB’s Guidelines for Regulation <strong>of</strong> Water Reclamation<br />
and issue waste discharge permits that serve to regulate the quality <strong>of</strong> reclaimed water<br />
based on stringent water quality requirements. The state Department <strong>of</strong> Health Services<br />
develops policies protecting human health and comments and advises on RWQCB<br />
permits (RCIP Existing Setting Report and Resolution No. 77-1, Policy with Respect to<br />
Water Reclamation in California).<br />
5.2-10<br />
<strong>City</strong> <strong>of</strong> <strong>Inglewood</strong> <strong>General</strong> <strong>Plan</strong> <strong>Update</strong> Technical Background Report
5.2 Hydrology and Water Quality<br />
Metropolitan Water District Groundwater Recovery Program<br />
MWD established the Groundwater Recovery Program (GRP), which provides financial<br />
assistance to member agencies to improve and enhance the quality <strong>of</strong> local ground water<br />
that does not meet the regulatory standards <strong>of</strong> the EPA and DHS.<br />
Local<br />
The <strong>City</strong> <strong>of</strong> <strong>Inglewood</strong> supports water conservation planning and implementation <strong>of</strong><br />
water conservation measures. Historically, the <strong>City</strong> has employed numerous conservation<br />
measures to discourage water waste and overuse. In addition, the <strong>City</strong> participates in the<br />
promotion <strong>of</strong> water conservation programs developed and implemented by MWD. The<br />
following list outlines the various programs the <strong>City</strong> implements:<br />
• Water Survey Programs for Single-Family and Multi-Family Residential<br />
Customers. This program includes literature for the public that provides tips on<br />
identifying systems leaks and instruction for repair. Under the program, the <strong>City</strong><br />
also monitors water usage by water use category. This helps identify changes in<br />
water demand patterns.<br />
• Residential Plumbing Retr<strong>of</strong>it. The <strong>City</strong> participates in several programs to<br />
encourage the retr<strong>of</strong>it <strong>of</strong> residential plumbing. These include installation <strong>of</strong> lowflow<br />
showerheads and toilet dams to conserve water. It also includes participation<br />
in ultra low-flow toilet replacement and rebate programs.<br />
• System Water Audits, Leak Detection, and Repair. As part <strong>of</strong> normal<br />
operation and maintenance <strong>of</strong> the water system, water division staff does<br />
preventive maintenance <strong>of</strong> approximately 152 miles <strong>of</strong> water pipelines. This<br />
includes regular valve, meter, detector check, and pipeline maintenance. If during<br />
routine inspection <strong>of</strong> the system leaks are encountered or suspected, further<br />
evaluation is conducted, and if leaks are found, they are repaired.<br />
• Metering with Commodity Rates for All New Connections and Retr<strong>of</strong>it <strong>of</strong><br />
Existing Connections. The <strong>City</strong> meters all customers, including separate metering<br />
for residential, commercial, industrial, municipal facilities, and fire flows. The <strong>City</strong><br />
has an inclining block rate for water service based on the quality <strong>of</strong> water<br />
consumed. Based on the current billing system, the more water a customer<br />
consumes, the higher the water bill because the commodity rates are per unit <strong>of</strong><br />
water consumed, thereby providing a cost benefit to conserving water.<br />
• Large Landscape Conservation Programs and Incentives. As part <strong>of</strong> this<br />
program, the <strong>City</strong> provides reclaimed water at a lower rate than potable water to<br />
provide an incentive to use reclaimed water.<br />
• High-Efficiency Washing Machine Rebate Program. In cooperation with<br />
MWD and other agency sponsors, the <strong>City</strong> participates in a high-efficiency washing<br />
machine rebate program.<br />
• Public Information Programs. The <strong>City</strong> has developed a public information<br />
program to educate the public to the benefits <strong>of</strong> water conservation. The program<br />
<strong>City</strong> <strong>of</strong> <strong>Inglewood</strong> <strong>General</strong> <strong>Plan</strong> <strong>Update</strong> Technical Background Report<br />
5.2-11
Chapter 5 Environmental Resources<br />
involves the dissemination <strong>of</strong> information through literature provided at <strong>City</strong> Hall<br />
and other <strong>City</strong> facilities, articles in the <strong>City</strong> newsletter and local cable television.<br />
• School Education. The <strong>City</strong> participates in a variety <strong>of</strong> school education programs<br />
in cooperation with MWD.<br />
• Conservation Programs for Commercial, Industrial, and Institutional<br />
Accounts. These programs include specific provisions for commercial, industrial,<br />
and institutional customers.<br />
The <strong>City</strong> has several other programs to generally promote water conservation. These<br />
include water waste prohibition, residential ultra-low flush toilet replacement program,<br />
and conservation pricing.<br />
• Issues<br />
• Increasing urbanization will increase impervious surfaces, increasing stormwater<br />
run<strong>of</strong>f and sedimentation, thereby triggering potential decreases in water quality.<br />
• References<br />
<strong>Inglewood</strong>, <strong>City</strong> <strong>of</strong>. 1997. <strong>Inglewood</strong> <strong>General</strong> <strong>Plan</strong>, Conservation Element.<br />
———. 2003. 25-Year Water Master <strong>Plan</strong>. September.<br />
———. 2005. Urban Water Management <strong>Plan</strong>. December.<br />
California Department <strong>of</strong> Water Resources. 2003. California’s Groundwater – Bulletin<br />
118, <strong>Update</strong> 2003.<br />
Los Angeles Regional Water Quality Control Board (LARWQCB). 2006. Watershed<br />
Management. Website: http://www.swrcb.ca.gov/rwqcb4/html/programs/<br />
regional_program/ws_santamonica.html, April.<br />
Rhode Island Department <strong>of</strong> Health. 2003. Healthy Drinking Waters for Rhode<br />
Islanders. http://www.uri.edu/ce/wq/has/html/Hydrogen.pdf<br />
United States Environmental Protection Agency. n.d. National Water Quality Inventory.<br />
www.epa.gov.<br />
Whatcom County Washington Health Department. 2003. Drinking Water Program,<br />
Environmental Health Division.<br />
www.co.whatcom.wa.us/health/environmental/drinking_water/iron.jsp<br />
5.2-12<br />
<strong>City</strong> <strong>of</strong> <strong>Inglewood</strong> <strong>General</strong> <strong>Plan</strong> <strong>Update</strong> Technical Background Report
5.3 Topography and Hillsides<br />
5.3 TOPOGRAPHY AND HILLSIDES<br />
This section describes the existing topography, slope, and elevation <strong>of</strong> the <strong>City</strong>.<br />
Information for this section was obtained from the 1995 Safety Element <strong>of</strong> the <strong>General</strong><br />
<strong>Plan</strong>.<br />
• Existing Conditions<br />
The <strong>City</strong> <strong>of</strong> <strong>Inglewood</strong> is comprised <strong>of</strong> three main topographical terrains: the Baldwin<br />
Hills located north <strong>of</strong> Centinela Creek, the southern Morningside Park area known as the<br />
Rosecrans Hills, and the <strong>Inglewood</strong>-Torrance coastal plain.<br />
The Baldwin Hills represent the highest and steepest terrain conditions within the <strong>City</strong>.<br />
Slopes within the hills are generally no steeper than 20 percent. Figure 5.3-1 identifies the<br />
topography and slope characteristics <strong>of</strong> the <strong>City</strong>. The sides <strong>of</strong> the steeper drainages rarely<br />
exceed a slope <strong>of</strong> 33 percent. The Rosecrans Hills, along with the Baldwin Hills, are part<br />
<strong>of</strong> the Newport-<strong>Inglewood</strong> uplift, a belt <strong>of</strong> discontinuous low hills that extend from the<br />
Santa Monica mountains southeastward across the Los Angeles Basin to Newport Beach.<br />
The <strong>Inglewood</strong>-Torrance plain is nearly flat with a gentle slope to the southwest <strong>of</strong> 50 to<br />
75 feet per mile. This plain merges with the El Segundo sand hills along the coast west <strong>of</strong><br />
the <strong>City</strong>.<br />
As shown in Table 5.3-1, approximately 93 percent <strong>of</strong> the <strong>City</strong> (approximately<br />
5,396.3 acres) has a slope gradient between approximately zero and five degrees. This<br />
area, located throughout the majority <strong>of</strong> the <strong>City</strong>, is considered to be easily developed.<br />
Table 5.3-1<br />
SOURCE:<br />
Percent <strong>of</strong> <strong>City</strong> Land within Specified Slope Gradients<br />
Slope Acres Percent<br />
0–5 5,396.3 92.6<br />
6–10 386.7 6.6<br />
11–15 38.0 0.65<br />
16–20 3.6 0.06<br />
Total 5,824.7 100.0<br />
<strong>City</strong> <strong>of</strong> <strong>Inglewood</strong>, 2006. GIS data. April<br />
Slope gradient in the <strong>City</strong> increases along the Rosecrans Hills, which run northwest to<br />
southeast in the eastern portion <strong>of</strong> the <strong>City</strong>. In the northern portion <strong>of</strong> the <strong>City</strong>, slope<br />
gradient increases in the Baldwin Hills area by as much as 15-20 percent. All <strong>of</strong> the<br />
approximately 3.6 percent <strong>of</strong> the <strong>City</strong> with a gradient <strong>of</strong> greater than 16 percent is within<br />
the Rosecrans and Baldwin Hills areas.<br />
Because a relatively small portion <strong>of</strong> the <strong>City</strong> has a gradient greater than 16 percent<br />
(approximately 3.6), the <strong>City</strong> does not currently have regulations designed to protect<br />
properties from slope failure and other potential hazards.<br />
<strong>City</strong> <strong>of</strong> <strong>Inglewood</strong> <strong>General</strong> <strong>Plan</strong> <strong>Update</strong> Technical Background Report<br />
5.3-1
Chapter 5 Environmental Resources<br />
• Regulatory Context<br />
There are no applicable Federal, State or local regulations related to topography.<br />
• Issues<br />
• The <strong>City</strong> does not currently have regulations or policies to mitigate potential<br />
hazards, including landslides that could result from development in areas <strong>of</strong> the<br />
<strong>City</strong> with increasing gradients (i.e. Baldwin Hills area).<br />
• References<br />
<strong>Inglewood</strong> <strong>General</strong> <strong>Plan</strong>, 1995. Safety Element, July.<br />
<strong>City</strong> <strong>of</strong> <strong>Inglewood</strong>, 2006. GIS Data. April.<br />
5.3-2<br />
<strong>City</strong> <strong>of</strong> <strong>Inglewood</strong> <strong>General</strong> <strong>Plan</strong> <strong>Update</strong> Technical Background Report
CITY <strong>of</strong> INGLEWOOD<br />
<strong>General</strong> <strong>Plan</strong><br />
TOPOGRAPHY/SLOPE ANALYSIS<br />
Legend<br />
Contour (10' interval)<br />
Slope<br />
Up to 5%<br />
5.1% - 10%<br />
10.1% - 15%<br />
15.1% - 20%<br />
Sources: <strong>City</strong> <strong>of</strong> <strong>Inglewood</strong>, February 2006 and<br />
EIP Associates, March 2006.<br />
Date: April 10, 2006<br />
Miles<br />
A Division <strong>of</strong><br />
0 0.25 0.5<br />
Figure 5.3-1
P:\Projects - All Users\D21000.00+\D21146.00 <strong>Inglewood</strong> GP and EIR\TBR\!Final TBR\5.4 VisualResources.doc Printed on 8/24/2006 8:55:00 AM<br />
5.4 Visual Resources<br />
5.4 VISUAL RESOURCES<br />
This section describes the existing<br />
visual environment <strong>of</strong> the <strong>City</strong> <strong>of</strong><br />
<strong>Inglewood</strong> and its surroundings. The<br />
scenic resources within the <strong>City</strong><br />
include a variety <strong>of</strong> natural and manmade<br />
elements that serve as visual<br />
landmarks and contribute to the<br />
identity and character <strong>of</strong> the <strong>City</strong>.<br />
Although specific visual resources in<br />
the <strong>City</strong> are identified in this section,<br />
it is not intended to provide an<br />
exhaustive inventory, as the nature <strong>of</strong><br />
these resources is somewhat<br />
View <strong>of</strong> <strong>Inglewood</strong>’s Great Western Forum from Darby Park<br />
subjective and not easily quantified.<br />
Existing regulations associated with visual resources, as well as issues and opportunities<br />
related to the formulation <strong>of</strong> policies regarding visual resources are discussed in this<br />
section.<br />
• Overview <strong>of</strong> Scenic Resources<br />
Visual resources are an important component <strong>of</strong> the quality <strong>of</strong> life <strong>of</strong> any geographic area.<br />
As users experience a place, their primary sensory interaction with that place is visual in<br />
nature. Several types <strong>of</strong> visual resources are defined below.<br />
“Aesthetic value” refers to the perception <strong>of</strong> the natural beauty <strong>of</strong> an area, as well as the<br />
elements that create or enhance its visual quality. While aesthetic value is subjective, it is<br />
typically included as a criterion for evaluating those elements that contribute to the quality<br />
that distinguishes an area. Most communities identify scenic resources as an important<br />
asset, although what is considered “scenic” may vary according to its environmental<br />
setting.<br />
“Scenic resources” can include natural open spaces, topographic formations, and<br />
landscapes. These are resources that can be maintained and enhanced to promote a<br />
positive image in the future. Many people associate natural landforms and landscapes<br />
with scenic resources, such as oak woodlands, lakes, rivers, streams, and some historical<br />
areas. Scenic resources can also include urban open spaces and the built environment.<br />
Examples <strong>of</strong> these would include parks, trails, and pathways, nature centers,<br />
archaeological, and architectural features.<br />
“Scenic vistas” constitute the range <strong>of</strong> vision in which scenic resources may be observed.<br />
They are defined by physical features that frame the boundaries or context to one or<br />
more scenic resources. A region’s topography can lend aesthetic value through the<br />
creation <strong>of</strong> public view corridors and through the visual backdrop created by hillsides.<br />
<strong>City</strong> <strong>of</strong> <strong>Inglewood</strong> <strong>General</strong> <strong>Plan</strong> <strong>Update</strong> Technical Background Report<br />
5.4-1
P:\Projects - All Users\D21000.00+\D21146.00 <strong>Inglewood</strong> GP and EIR\TBR\!Final TBR\5.4 VisualResources.doc Printed on 8/24/2006 8:55:00 AM<br />
Chapter 5 Environmental Resources<br />
Scenic vistas may include views <strong>of</strong> a range <strong>of</strong> resources, whether natural or man-made,<br />
and are also considered important scenic resources for preservation.<br />
A wide variety <strong>of</strong> shapes, colors, and textures form the views <strong>of</strong> and from the <strong>City</strong> <strong>of</strong><br />
<strong>Inglewood</strong>, including hillsides, structures, roadways, and vegetation. Some <strong>of</strong> these<br />
resources are described below.<br />
• Existing Conditions<br />
The <strong>City</strong> <strong>of</strong> <strong>Inglewood</strong> <strong>of</strong>fers a variety <strong>of</strong><br />
natural and man-made aesthetic resources that<br />
are visible to those walking, cycling, or driving<br />
through the <strong>City</strong>. <strong>Inglewood</strong> has a rich<br />
architectural heritage, and contains a variety <strong>of</strong><br />
building types and designs, representing a range<br />
<strong>of</strong> time periods and architectural styles, as well<br />
as landmarks, such as the Centinela Adobe, the<br />
Hollywood Park Race Track and Casino, the<br />
Great Western Forum, the Art-Deco District in<br />
Morningside Park, and the <strong>Inglewood</strong> Park<br />
Cemetery. The preservation and maintenance <strong>of</strong><br />
the man-made and natural aesthetic resources<br />
are important components <strong>of</strong> maintaining the<br />
quality <strong>of</strong> life in <strong>Inglewood</strong>.<br />
Hollywood Park Main Access<br />
Great Western Forum main access<br />
While the <strong>City</strong> includes areas <strong>of</strong> moderately dense urban development along its major<br />
corridors, it maintains the characteristics <strong>of</strong> a residential community, with large residential<br />
areas along the entire boundary <strong>of</strong> the <strong>City</strong>.<br />
Natural Elements<br />
<strong>Inglewood</strong> lies on and around the land known<br />
in the late nineteenth century as the Rancho<br />
Aguaje del Centinela. The townsite <strong>of</strong><br />
<strong>Inglewood</strong> was planned by the Centinela-<br />
<strong>Inglewood</strong> Land Company in 1887. The <strong>City</strong><br />
plan was divided into northern and southern<br />
sections following the patterns <strong>of</strong> urban growth<br />
that characterized late-nineteenth through earlytwentieth-century<br />
Southern California.<br />
In the present day, the <strong>City</strong> <strong>of</strong> <strong>Inglewood</strong> is fully<br />
developed and does not contain any wildlife<br />
areas, rivers, streams, undeveloped watersheds,<br />
forests, agricultural land, hiking trails, lakes, or<br />
mountains. However, man made open space<br />
Landscape elements along residential area<br />
<strong>Inglewood</strong> Park<br />
5.4-2<br />
<strong>City</strong> <strong>of</strong> <strong>Inglewood</strong> <strong>General</strong> <strong>Plan</strong> <strong>Update</strong> Technical Background Report
5.4 Visual Resources<br />
such as parks, and landscaped areas are also considered natural elements because <strong>of</strong> their<br />
visual importance to the surrounding areas.<br />
A major focus <strong>of</strong> the <strong>City</strong> <strong>of</strong> <strong>Inglewood</strong> has been the creation <strong>of</strong> two basic man-made<br />
types <strong>of</strong> open space. One is the traditional city park, providing either active or passive<br />
recreation. There are ten traditional city parks in <strong>Inglewood</strong> today, most <strong>of</strong> which are<br />
smaller one-to-two-acre neighborhood parks with the exception <strong>of</strong> three larger parks<br />
which provide a full <strong>of</strong>fering <strong>of</strong> recreational and community facilities. These parks include<br />
Centinela Park (51 acres), Darby Park (14 acres), and Rogers Park (10 acres). <strong>Inglewood</strong>’s<br />
parks are further discussed in Section 4.2 (Recreation and Parks) <strong>of</strong> this TBR, and their<br />
locations are illustrated in Figure 4.2-1. The second type <strong>of</strong> man-made open space that<br />
exists in the <strong>City</strong> is non-park open space that also provides visual relief from the<br />
increasing urbanization <strong>of</strong> <strong>Inglewood</strong> and its environs. Examples <strong>of</strong> this latter type can<br />
include public plazas, landscaped boulevards and even greenbelts between buildings on<br />
private property.<br />
Views and Vistas<br />
The <strong>City</strong> <strong>of</strong> <strong>Inglewood</strong> is characterized by<br />
moderate hillside areas mostly to the north<br />
(Baldwin Hills residential areas) and the southeast<br />
(Darby Park, residential areas along Manchester<br />
Blvd. between Crenshaw Blvd. and Prairie Ave,<br />
and south Crenshaw residential areas between<br />
Century Blvd. and W. 108 th Street), with relatively<br />
flat areas in the remainder <strong>of</strong> the <strong>City</strong> (See<br />
View from Darby Park looking southwest<br />
Figure 5.3-1 (Topography/Slope Analysis) in Section 5.3 <strong>of</strong> this TBR). Elevations within<br />
<strong>Inglewood</strong> range from approximately 42 feet to 250 feet from ocean level. With the<br />
exception <strong>of</strong> the northern and southeastern hillside areas, the majority <strong>of</strong> the <strong>City</strong><br />
(approximately 92 percent) has a ground slope between zero and five percent. Views onto<br />
and across the <strong>City</strong> include views <strong>of</strong> the hilly residential areas that are situated in the<br />
north and southeastern portions <strong>of</strong> <strong>Inglewood</strong> and adjacent communities. <strong>Inglewood</strong> is<br />
largely built-out and characterized by residential, commercial and some industrial uses.<br />
Scenic Highways<br />
California’s Scenic Highway Program was created<br />
in 1963, and the scenic highway designation serves<br />
to protect and enhance California’s natural scenic<br />
beauty and to protect the social and economic<br />
values provided by the state’s scenic resources.<br />
Presently, there are no scenic highways <strong>of</strong>ficially<br />
designated by the state within <strong>Inglewood</strong>.<br />
Landscape elements along north section<br />
<strong>of</strong> Hillcrest Boulevard<br />
<strong>City</strong> <strong>of</strong> <strong>Inglewood</strong> <strong>General</strong> <strong>Plan</strong> <strong>Update</strong> Technical Background Report<br />
5.4-3
Chapter 5 Environmental Resources<br />
Scenic Drives and Vistas<br />
Scenic drives can provide views <strong>of</strong> a variety <strong>of</strong> natural and man-made elements.<br />
Sometimes they include views <strong>of</strong> city landmarks, or wide expanses <strong>of</strong> tree lined<br />
boulevards as well as more intimate vistas along shorter road segments. These drives<br />
provide not only an important scenic resource for residents, but are <strong>of</strong>ten the only<br />
aesthetic experience for visitors.<br />
Scenic drives are streets in which the presence <strong>of</strong> high quality landscaping and/or major<br />
<strong>City</strong> landmarks lends to a positive visual character. Major scenic drives usually include<br />
landscape elements that add a distinctive character<br />
<strong>of</strong> green space to what otherwise would be a simple<br />
asphalt street.<br />
Transportation corridors in <strong>Inglewood</strong> which could<br />
be considered scenic drives due to the presence <strong>of</strong><br />
landscape elements and/or major <strong>City</strong> landmarks<br />
include Florence Avenue, Crenshaw Boulevard,<br />
Prairie Avenue, and some secondary residential<br />
roads such as the northern section <strong>of</strong> Hillcrest<br />
Boulevard (between Florence Avenue and<br />
Manchester Boulevard). These roads <strong>of</strong>ten include a<br />
Landscape elements along Crenshaw<br />
Boulevard<br />
median and/or a landscaped buffer between the street curb and the sidewalk with<br />
different types <strong>of</strong> Southern California trees, providing the driver and the pedestrian with a<br />
pleasant visual experience. Scenic drives within the community are described below:<br />
• Prairie Avenue: The northern section <strong>of</strong> Prairie Avenue begins at Florence<br />
Avenue, and travels south alongside the west boundary <strong>of</strong> the <strong>Inglewood</strong> Park<br />
Cemetery. The next major intersection is Manchester Avenue which includes the<br />
southwest corner <strong>of</strong> the Park Cemetery, the Western Forum (on the southeast<br />
corner) and its large asphalted surface parking lot, a 1980s-era Sizzler’s Restaurant<br />
<strong>of</strong> standard design (northwest corner), and a 1980s two-story <strong>of</strong>fice building and<br />
structure parking lot. Of these four properties, only the <strong>Inglewood</strong> Cemetery<br />
property possesses architectural, landscaping and historical relevance.<br />
South <strong>of</strong> the Prairie-Manchester intersection, the entire eastern side <strong>of</strong> Prairie<br />
Avenue is occupied by two large surface parking lots: one belonging to the Forum,<br />
the other to the Hollywood Park<br />
Racetrack. According to the<br />
Crenshaw-Prairie Transportation<br />
Corridor Historic Assessment<br />
Report, none <strong>of</strong> these elements are<br />
<strong>of</strong> historic interest. However,<br />
Hollywood Park’s Turf Club and<br />
Grandstand, designed in 1937 (with<br />
subsequent additions and rebuilding<br />
following the 1948 fire) are <strong>of</strong><br />
design significance. The original<br />
Hollywood Park parking lot along Prairie Avenue<br />
structure was designed by the<br />
5.4-4<br />
<strong>City</strong> <strong>of</strong> <strong>Inglewood</strong> <strong>General</strong> <strong>Plan</strong> <strong>Update</strong> Technical Background Report
5.4 Visual Resources<br />
Saint John<br />
Chrysostom Church<br />
West side <strong>of</strong> Prairie Avenue between Manchester<br />
Avenue and Century Boulevard<br />
architect Stiles O. Clements and the<br />
site plan and landscape design was<br />
the work <strong>of</strong> Edward Huntsman<br />
Trout, one <strong>of</strong> the best known<br />
landscape architect working in the<br />
Los Angeles region during the<br />
second quarter <strong>of</strong> the twentieth<br />
century. While the main racetrack<br />
structure sits back a few hundred<br />
yards from Prairie Avenue, it is<br />
clearly within view <strong>of</strong> drivers and<br />
pedestrians due to its massive scale.<br />
The west side <strong>of</strong> Prairie Avenue, below Manchester Avenue to Century Boulevard<br />
is densely developed with diverse building types and uses, nearly all <strong>of</strong> which date<br />
from 1960 or later. Pre-1960 buildings which could be considered <strong>of</strong> historic value<br />
include the William H. Kelso Elementary School (1935), the McCormick Mortuary<br />
(1950), and a group between Buckthorn Street and La Brea Drive <strong>of</strong> several singlefamily<br />
residences ranging in construction dates from 1925–1960. Post-1960<br />
buildings include a gas station, one-story commercial buildings, two and three-story<br />
apartment buildings, a 1970s mini mall,<br />
and a smaller 1980s mini mall.<br />
• Crenshaw Boulevard: The northern<br />
section <strong>of</strong> Crenshaw between<br />
Manchester Avenue and Century<br />
Boulevard, consists mostly <strong>of</strong><br />
residential properties ranging from<br />
single-family to multi-family with some<br />
neighborhood<br />
commercial,<br />
institutional, and religious uses on<br />
major intersections.<br />
Northern Section <strong>of</strong> Crenshaw Boulevard<br />
The southern section <strong>of</strong> Crenshaw Boulevard, between Century Boulevard and<br />
Imperial Highway, consists <strong>of</strong> higher density residential and higher concentrations<br />
<strong>of</strong> commercial uses. Landscape elements are present along both sides <strong>of</strong> the<br />
Boulevard throughout the <strong>City</strong>. There is a landscaped green median and a buffer<br />
zone between the curb and the sidewalk with large palm trees, providing the driver<br />
and the pedestrian with a pleasant experience.<br />
• Florence Avenue: The eastern section <strong>of</strong> Florence Avenue between Hillcrest<br />
Boulevard and the eastern <strong>City</strong> limit consists <strong>of</strong> diverse<br />
commercial, government, institutional, religious, and<br />
recreation (park) uses.<br />
Important resources<br />
along the eastern<br />
section which could be<br />
considered <strong>City</strong><br />
landmarks include the<br />
Saint John Chrysostom<br />
Church, the <strong>Inglewood</strong><br />
Park Cemetery, and the<br />
Eastern Section <strong>of</strong> Florence Avenue<br />
<strong>City</strong> <strong>of</strong> <strong>Inglewood</strong> <strong>General</strong> <strong>Plan</strong> <strong>Update</strong> Technical Background Report<br />
5.4-5
Chapter 5 Environmental Resources<br />
Edward Vincent Jr. Park. Landscape elements along the<br />
eastern section consist <strong>of</strong> mature palm trees which are<br />
planted along the north side <strong>of</strong> the Avenue creating a<br />
unique scenic setting.<br />
The western section <strong>of</strong> Florence, between Hillcrest<br />
Boulevard and the western <strong>City</strong> limit, includes higher<br />
concentrations <strong>of</strong> commercial and industrial uses.<br />
Landscape elements are also present along the western<br />
section. There are blocks which include landscaped<br />
medians with different types <strong>of</strong> trees and shrubs. Some<br />
intersections include landscaped areas with mature trees<br />
which work effectively as screening elements blocking<br />
surface parking lots and industrial facilities from<br />
pedestrian and driver view.<br />
Western Section <strong>of</strong> Florence<br />
Landscaped Areas at<br />
Intersections<br />
Manmade Elements<br />
Manmade elements such as historic buildings and landmarks, freeways and scenic<br />
highways, as well as scenic drives and vistas are considered visual resources. These<br />
elements are further described below.<br />
<strong>Inglewood</strong> Civic Center<br />
Historic Resources and Landmarks<br />
As discussed in Section 5.5 (Historic and Cultural Resources),<br />
the <strong>City</strong> <strong>of</strong> <strong>Inglewood</strong> has many buildings <strong>of</strong> architectural,<br />
historic, landmark, or cultural significance as they are<br />
representative <strong>of</strong> and<br />
provide glimpses into the<br />
<strong>City</strong>’s past. Historical<br />
resources can help to<br />
define the visual character <strong>of</strong> an area by contributing<br />
to a sense <strong>of</strong> place, maintaining a visual link to an<br />
area’s past, and providing glimpses <strong>of</strong> historical<br />
views. Historic resources in <strong>Inglewood</strong> are generally<br />
located within or around the Downtown District<br />
along Market Street, Manchester Blvd, and South La<br />
Brea Blvd. Other historic resources around the <strong>City</strong><br />
include the historic Art-Deco District <strong>of</strong>f Manchester<br />
Boulevard in Morningside Park, and the original<br />
Centinela Adobe.<br />
Bookstore on Market Street (former Bank<br />
<strong>of</strong> <strong>Inglewood</strong> built in 1927)<br />
Historic resources that can be considered <strong>of</strong> scenic<br />
value, include, but are not limited to:<br />
• The Fox West Coast Theater<br />
• The Bank <strong>of</strong> <strong>Inglewood</strong><br />
• The Lepper Building<br />
Hollywood Park main access<br />
5.4-6<br />
<strong>City</strong> <strong>of</strong> <strong>Inglewood</strong> <strong>General</strong> <strong>Plan</strong> <strong>Update</strong> Technical Background Report
5.4 Visual Resources<br />
• The S.H. Kress Store<br />
• <strong>Inglewood</strong> Veterans Memorial Building<br />
• Centinela Adobe<br />
• Art-Deco District—Morningside Park<br />
Landmarks can also be found in close proximity to the Downtown District, particularly<br />
along S. Prairie Avenue. A landmark is a significant reference point, <strong>of</strong>ten represented by<br />
a well-known building or a structure, a landscaped area, or a freestanding element, which<br />
provides a point <strong>of</strong> reference in identifying a particular area or destination. Landmarks<br />
commonly have singularity, allowing them to be distinguished from features surrounding<br />
them. They also provide visual and functional reference for residents and visitors within<br />
the community, contributing to a distinct sense <strong>of</strong> place. Landmarks <strong>of</strong>ten have<br />
architectural, historical, and/or cultural significance. Although they are not <strong>of</strong>ficially<br />
designated as historical landmarks, the following landmark resources can be considered <strong>of</strong><br />
scenic value and provide a clear point <strong>of</strong> reference within <strong>Inglewood</strong>:<br />
• The Hollywood Park Race Track & Casino<br />
• The Great Western Forum<br />
• The <strong>Inglewood</strong> Park Cemetery<br />
• The <strong>Inglewood</strong> Civic Center<br />
Additional discussion <strong>of</strong> the historical significance <strong>of</strong> these and other historical resources<br />
or landmarks is contained in Section 5.5 (Historical and Cultural Resources) <strong>of</strong> this<br />
document.<br />
• Regulatory Setting<br />
Federal<br />
No existing federal regulations pertain to the visual resources within the <strong>City</strong>.<br />
State<br />
No existing estate regulations pertain to the visual resources within the <strong>City</strong>.<br />
Los Angeles County<br />
Los Angeles County regulates scenic open space in unincorporated areas primarily<br />
through its <strong>General</strong> <strong>Plan</strong> and Area <strong>Plan</strong>s. Policies and programs <strong>of</strong> the <strong>General</strong> <strong>Plan</strong><br />
directed toward management and protection <strong>of</strong> the scenic qualities <strong>of</strong> these areas<br />
constitutes the Open Space <strong>Plan</strong> <strong>of</strong> Los Angeles County. Open space lands may be<br />
subject to additional controls through special management areas such as National<br />
Recreation and Forest areas, Significant Ecological Areas (SEAs), mineral resource areas,<br />
hazard areas, and areas subject to cultural heritage protection.<br />
<strong>City</strong> <strong>of</strong> <strong>Inglewood</strong> <strong>General</strong> <strong>Plan</strong> <strong>Update</strong> Technical Background Report<br />
5.4-7
Chapter 5 Environmental Resources<br />
Local<br />
The <strong>City</strong> <strong>of</strong> <strong>Inglewood</strong> addresses aesthetics considerations for development in the<br />
community in many <strong>City</strong> documents, including the Zoning Code. The Code sets forth<br />
specific design guidelines, height limits, building density, building design and landscaping<br />
standards, sign regulations, and open space and setback requirements. In addition to the<br />
Zoning Code, several documents have been prepared which include additional guidelines,<br />
standards, and recommendations to revitalize certain areas <strong>of</strong> the <strong>City</strong>. These documents<br />
include:<br />
• The <strong>Inglewood</strong> Downtown District Main Street Project Area<br />
• The Market Street Renaissance and Downtown Revitalization <strong>Plan</strong><br />
• The Market/La Brea Shopping District Revitalization Implementation <strong>Plan</strong><br />
• The Century Boulevard Fly-Away and Beautification Project Study<br />
In addition, all residential and commercial development is reviewed by appointed<br />
Commissions and staff for aesthetic impact.<br />
• Issues<br />
• Prairie Avenue has the potential to become a strong visual resource; however, large<br />
unscreened parking lots, lack <strong>of</strong> street improvements including a median parkway<br />
landscaping and onsite landscaping and buffers contribute to lack <strong>of</strong> visual appeal<br />
along the corridor for pedestrians and vehicles.<br />
• Vacant store fronts and lack <strong>of</strong> maintenance along some <strong>of</strong> the <strong>City</strong>’s major<br />
corridors such as Imperial Highway create visually unappealing environments.<br />
• References<br />
Cheryl D. Cromwell and Lee Draper Associates, 1996. Cultural Arts Master <strong>Plan</strong> for the<br />
<strong>City</strong> <strong>of</strong> <strong>Inglewood</strong> Department <strong>of</strong> Recreation and Community Services. June.<br />
University <strong>of</strong> Southern California School <strong>of</strong> Policy <strong>Plan</strong>ning and Development, 1999. The<br />
Main Street Organization and Downtown <strong>Inglewood</strong> Commercial Revitalization<br />
Feasibility Analysis and Project <strong>Plan</strong>. December.<br />
Lauren Weiss Bricker, Marion Mitchell-Wilson, and Janet L. Tearnen, 2000. <strong>Inglewood</strong><br />
Downtown District Main Street Project Area Historic Design Guidelines. May 15.<br />
Carson Anderson, 1997. Crenshaw-Prairie Transportation Corridor Historic Assessment<br />
Report. October.<br />
National Register <strong>of</strong> Historic Places, Los Angeles County, website:<br />
http://www.nationalregister<strong>of</strong>historicplaces.com/CA/Los+Angeles/state.html,<br />
accessed February, 2006.<br />
California Environmental Resources Evaluation System website, State Historical<br />
Landmarks, Los Angeles County, website:<br />
http://ceres.ca.gov/geo_area/counties/Los_Angeles/landmarks.html, accessed<br />
February, 2006.<br />
5.4-8<br />
<strong>City</strong> <strong>of</strong> <strong>Inglewood</strong> <strong>General</strong> <strong>Plan</strong> <strong>Update</strong> Technical Background Report
5.5 Historical and Cultural Resources<br />
5.5 HISTORICAL AND CULTURAL RESOURCES<br />
This section describes the existing historical and cultural resources in the <strong>City</strong> <strong>of</strong><br />
<strong>Inglewood</strong>. Historic resources include structures which are listed or may be eligible for<br />
listing on the National Register <strong>of</strong> Historic Places (National Register), the California<br />
Register <strong>of</strong> Historical Resources (CRHR),<br />
or any local designation. Cultural resources<br />
include all forms <strong>of</strong> public art, as well as<br />
venues that host cultural activities.<br />
<strong>Inglewood</strong>’s historic-cultural resources<br />
include physical elements, which define the<br />
<strong>City</strong>’s past and present and give <strong>Inglewood</strong><br />
a unique identity and charm. These<br />
resources, when preserved and well<br />
maintained, provide the community with a<br />
sense <strong>of</strong> permanence which fosters civic<br />
Bookstore on Market Street (former Bank <strong>of</strong><br />
<strong>Inglewood</strong> built in 1927)<br />
pride and stewardship among its residents and businesses. Information for this section is<br />
based on data obtained from the <strong>Inglewood</strong> Downtown District/Main Street Historic<br />
Resources Survey (October 1998), the California Environmental Resources Evaluation<br />
System (CERES) website, 83 the National Register website 84 , and the <strong>Inglewood</strong> Cultural<br />
Arts Master <strong>Plan</strong> (1996).<br />
• <strong>Inglewood</strong> Historical Background<br />
The <strong>City</strong> <strong>of</strong> <strong>Inglewood</strong> was originally designed following the patterns <strong>of</strong> urban growth<br />
that characterized late-nineteenth through early-twentieth-century Southern California.<br />
However, unlike most cities and communities comprising the greater metropolitan Los<br />
Angeles region, the periods <strong>of</strong> <strong>Inglewood</strong>’s development are readable within its built<br />
environment. Retention and respect for its historic street pattern, the scale relationships<br />
between the streets and their buildings, and the commercial center <strong>of</strong> what was initially<br />
the Centinela Valley, and in later years, the South Bay Region. The decline <strong>of</strong> its local<br />
economy in more recent decades has slowed down the pace <strong>of</strong> change.<br />
The evolving perception <strong>of</strong> land in nineteenth-century Southern California can be<br />
characterized by a gradual change <strong>of</strong> use from agricultural activities to real estate<br />
speculation, a process that was aided by the advent <strong>of</strong> streetcar lines. <strong>Inglewood</strong>’s chapter<br />
in this story began with the Rancho Aguaje del Centinela, a 2,200 acre property named<br />
after the Centinela Spring around which it was located. The creek still flows today within<br />
Edward Vincent Junior Park. The headquarters <strong>of</strong> the ranch property, called the<br />
83 California Environmental Resources Evaluation System website, State Historical Landmarks, Los Angeles<br />
County, http://ceres.ca.gov/geo_area/counties/Los_Angeles/landmarks.html, accessed February, 2006.<br />
84 National Register <strong>of</strong> Historic Places, Los Angeles County, website:<br />
http://www.nationalregister<strong>of</strong>historicplaces.com/CA/Los+Angeles/state.html, accessed February, 2006.<br />
<strong>City</strong> <strong>of</strong> <strong>Inglewood</strong> <strong>General</strong> <strong>Plan</strong> <strong>Update</strong> Technical Background Report<br />
5.5-1
Chapter 5 Environmental Resources<br />
Centinela Adobe House, is considered to be the birthplace <strong>of</strong> <strong>Inglewood</strong>. This house has<br />
since been relocated to 7634 Midfield Avenue within the <strong>City</strong>. Figure 5.5-1 identifies the<br />
<strong>City</strong>’s historic structures. The Centinela Adobe was completed in 1834 by Ignacio<br />
Machado, who owned it briefly. The property passed through many hands before finally<br />
being purchased in 1885 by Daniel Freeman, a<br />
Canadian attorney who had arrived in the area<br />
in 1873. By 1887, Freeman had become a<br />
partner in the Centinela-<strong>Inglewood</strong> Land<br />
Company. The stated purpose <strong>of</strong> this land<br />
company was to create a town near Centinela<br />
Springs.<br />
The <strong>Inglewood</strong> <strong>City</strong> plan was divided into<br />
northern and southern sections by the Centinela Adobe House<br />
California Central Railroad and it was completed in 1887. The southern half <strong>of</strong> the <strong>City</strong><br />
was bounded by Redondo Avenue (now Hillcrest Boulevard) which formed three sides <strong>of</strong><br />
an octagon; this pattern was continued in a more irregular fashion by the alignment <strong>of</strong><br />
Centinela Avenue which ran through the northern half <strong>of</strong> the city. Remnants <strong>of</strong> the<br />
octagon are found along Hillcrest Boulevard from <strong>Inglewood</strong> to Florence Avenues and<br />
Oak Street between Manchester Boulevard and Florence Avenue. Nethermead Park, later<br />
Centinela Park (today Edward Vincent Jr. Park), a linear park containing Centinela Creek,<br />
paralleled the railroad track to the north. The grid pattern <strong>of</strong> the streets located south <strong>of</strong><br />
the tracks was in marked contrast with the<br />
irregular angles formed by the streets north<br />
<strong>of</strong> the tracks.<br />
The major north/south street leading into<br />
<strong>Inglewood</strong> was Grevillea Avenue. The<br />
narrow, uniform lot configurations <strong>of</strong> the<br />
blocks fronting onto Grevillea Avenue, as<br />
well as onto Commercial (now La Brea<br />
Market Street<br />
Avenue) and Market Streets to the east,<br />
suggest that they were projected for<br />
commercial development. The prices <strong>of</strong> the lots ranged from $200 to $750 with residence<br />
properties priced at the lower range. By 1888 there were several small businesses, a<br />
planning mill, a brickyard, a projected “College <strong>of</strong> Applied Sciences”, and at least five real<br />
estate <strong>of</strong>fices in town. A hotel was built on Queen Street between Commercial and<br />
Market Streets.<br />
5.5-2<br />
<strong>City</strong> <strong>of</strong> <strong>Inglewood</strong> <strong>General</strong> <strong>Plan</strong> <strong>Update</strong> Technical Background Report
CITY <strong>of</strong> INGLEWOOD<br />
<strong>General</strong> <strong>Plan</strong><br />
HISTORIC RESOURCES<br />
Source: <strong>City</strong> <strong>of</strong> <strong>Inglewood</strong>, February 2006 and<br />
California State Office <strong>of</strong> Historic Preservation, May 2006.<br />
Date: May 16, 2006<br />
Miles<br />
A Division <strong>of</strong> 0 0.25 0.5<br />
Figure 5.5-1
5.5 Historical and Cultural Resources<br />
By 1888 <strong>Inglewood</strong> had a population <strong>of</strong><br />
three hundred. During the years immediately<br />
preceding <strong>Inglewood</strong>’s incorporation in<br />
1908, architectural development was sparse.<br />
Most buildings were impermanent wood<br />
frame construction. The principal<br />
commercial building was the Hotel<br />
<strong>Inglewood</strong>, whose two-story structure,<br />
located at the southwest corner <strong>of</strong><br />
Commercial (now La Brea) and Regent<br />
La Brea Avenue<br />
Streets, contained commercial units that<br />
fronted onto Commercial Street. Businesses addressing the agricultural and building<br />
needs <strong>of</strong> the community were located on the west side <strong>of</strong> Commercial Street, north <strong>of</strong><br />
Regent. These consisted <strong>of</strong> a blacksmith shop, <strong>Inglewood</strong> Mills, and storage and repair<br />
shops. During the early years <strong>of</strong> <strong>Inglewood</strong>’s history, Market Street was principally a<br />
residential area with a street car line that dated from 1904.<br />
By the 1910s, several churches were constructed in <strong>Inglewood</strong>. With the exception <strong>of</strong> the<br />
First Methodist Episcopal Church at the northwest corner <strong>of</strong> East Pimiento (now West<br />
Manchester Boulevard) and Commercial<br />
Street, and St. John’s Catholic Church at<br />
the northeast corner <strong>of</strong> East Pimiento<br />
and South Locust Street, the churches<br />
were constructed in the more sparsely<br />
developed residential area south <strong>of</strong><br />
Nutwood Street, i.e., the Presbyterian<br />
Church, the Church <strong>of</strong> the Brethren, and<br />
the Christian Church. None <strong>of</strong> these<br />
buildings survived (though the First<br />
Christian Church at 215 East Hillcrest<br />
Boulevard is on the site <strong>of</strong> the earlier<br />
Christian Church). The only church that<br />
Market Street Intersection<br />
survived from this period, in an altered state, is the Episcopal Church <strong>of</strong> the Holy Faith,<br />
located at the southeast corner <strong>of</strong> Grace Avenue and Locust Street, as shown in<br />
Figure 5.5-1.<br />
In the early 1920s, <strong>Inglewood</strong>’s collection <strong>of</strong> commercial buildings coalesced into a<br />
downtown commercial district. The pattern <strong>of</strong> development shared features with the<br />
development <strong>of</strong> other downtown districts in Southern California (and elsewhere<br />
nationally). The buildings that were constructed have been labeled by architectural<br />
historians as “taxpayer blocks”, so named since they were viewed as interim<br />
improvements that would garner some tax benefit until more valuable development could<br />
be carried out. These were typically multi-unit one- to two-story commercial buildings.<br />
Offices or apartments would be located above the first story commercial units. Singlestory<br />
buildings were particularly prevalent after World War I, when automotive traffic<br />
<strong>City</strong> <strong>of</strong> <strong>Inglewood</strong> <strong>General</strong> <strong>Plan</strong> <strong>Update</strong> Technical Background Report<br />
5.5-5
Chapter 5 Environmental Resources<br />
made arterial routes less agreeable places to live, and apartment dwellers expected some<br />
<strong>of</strong>f-street space for their cars.<br />
Most 1920s commercial buildings were constructed on a speculative basis. During this<br />
period the principal construction materials were brick and hollow tile. Their relative<br />
permanence (in comparison with wood frame structures) was seen as an indicator <strong>of</strong> the<br />
formation <strong>of</strong> neighborhoods. The exterior design was somewhat more elaborate than had<br />
been true during earlier periods <strong>of</strong> commercial development. Surface ornament framed<br />
the entrance; the parapet above the entry was frequently elaborated with contrasting types<br />
<strong>of</strong> brick or terra cotta and the name <strong>of</strong> the building imbedded into its surface. Pilasters<br />
(flat, engaged columns) framing double-hung windows introduced a formality that<br />
connoted economic stability. The interior space <strong>of</strong> these buildings was characteristically<br />
flexible since the tenants’ needs could not be known. These buildings were not<br />
anticipated to be long-term investments. Once they were built, their architectural<br />
attributes were seemingly taken for granted; distinctive features were usually<br />
overshadowed by signs. While these features characterized the design <strong>of</strong> American<br />
commercial buildings irrespective <strong>of</strong> their location, in Southern California the advent <strong>of</strong><br />
the Spanish Colonial Revival (which began to take hold by the mid 1910s) created a<br />
regionally identifiable image. Characteristic features were stucco sheathed walls with<br />
Spanish tile covering ro<strong>of</strong>s or parapet edges. The theme <strong>of</strong> the arcade (associated with the<br />
Mission traditions) was expressed through arched door and window openings;<br />
occasionally a recessed porch at the entrance would be transformed into a miniature<br />
courtyard complete with tiled floor and baseboard and fountain. Restrained use <strong>of</strong> plaster<br />
or cast-stone detailing at the entrance and parapet gave the building additional visual<br />
interest.<br />
In the Metropolitan Los Angeles area, the normal land use pattern was dominated by<br />
one-story rather than two-story commercial buildings. A similar low-scale pattern<br />
characterized post World War I downtown <strong>Inglewood</strong>, with commercial enterprises<br />
established to meet the needs <strong>of</strong> local consumers (the 1920 census reported a population<br />
<strong>of</strong> 3,248).<br />
In 1920, <strong>Inglewood</strong> suffered a severe earthquake. The <strong>Inglewood</strong> Hotel and the<br />
<strong>Inglewood</strong> Mercantile Company, located at the intersection <strong>of</strong> Regent and Commercial<br />
were severely damaged and later demolished. The loss <strong>of</strong> these buildings was graphically<br />
reported in contemporary photographs. However the earthquake did not seriously<br />
hamper the <strong>City</strong>’s growth. In fact, the aftermath <strong>of</strong> the earthquake was such a spectacle<br />
that the people who flocked to see the damage were seeing <strong>Inglewood</strong> for the first time,<br />
and were so impressed that they came back to live. They liked the climate, reputed to be<br />
the best in the nation, and liked the quiet little town (the 1922 census reported a growth<br />
in the city’s population to 7,000).<br />
Soon after the earthquake, on the site <strong>of</strong> the <strong>Inglewood</strong> Mercantile Company, Citizens<br />
Savings was constructed by a group <strong>of</strong> local investors. At this time, Commercial Street<br />
continued to be the primary commercial artery for the city. However, many more<br />
businesses were establishing locations on Market Street and the cross streets. During the<br />
5.5-6<br />
<strong>City</strong> <strong>of</strong> <strong>Inglewood</strong> <strong>General</strong> <strong>Plan</strong> <strong>Update</strong> Technical Background Report
5.5 Historical and Cultural Resources<br />
early 1920s, George Lepper, originally from Pittsburg, purchased property at 314 South<br />
Market Street, as shown in Figure 5.5-1, with the intention <strong>of</strong> building a shoe store for his<br />
son. Other citizens derided his expectation that Market Street would become prominent.<br />
Along with Sanford Anderson, Lepper was a prime mover in organizing the local<br />
People’s Federal Building and Loan Association. They established their first <strong>of</strong>fice in one<br />
<strong>of</strong> the units <strong>of</strong> the Market Street building, but eventually outgrew the facility and<br />
constructed a new building at the northeast corner <strong>of</strong> Market and Manchester. At the<br />
northeast corner <strong>of</strong> North Market and Queen Streets, the Bank <strong>of</strong> <strong>Inglewood</strong> erected a<br />
Mediterranean style bank building in 1927, as shown in Figure 5.5-1. This was sold to the<br />
Bank <strong>of</strong> America National Trust and Savings Association in 1936, and currently functions<br />
as a bookstore.<br />
By the early 1920s, signs <strong>of</strong> the impact <strong>of</strong> the automobile were showing in <strong>Inglewood</strong>, as<br />
was true for other Southern California cities. Automotive repair garages and corner<br />
service stations were sited at the northern and southern edges <strong>of</strong> Commercial and Market<br />
Streets. Detached automotive garages were built to the rear <strong>of</strong> the dwellings, particularly<br />
the newer housing constructed east <strong>of</strong> the commercial blocks, along Locust Street and<br />
Hillcrest Boulevard. By this period a movie theater had been constructed at the northwest<br />
corner <strong>of</strong> Commercial and Queen Streets. On Market Street, the Granada Theater was<br />
constructed in 1923, and it was later replaced by the Fox Theater, 1948-49, as shown in<br />
Figure 5.5-1. The new city hall (replacing its predecessor) was constructed to the east, at<br />
the corner <strong>of</strong> Grevillea and Queen Streets.<br />
The 1920s saw the advent <strong>of</strong> the chain stores in outlying areas and smaller downtown<br />
districts such as <strong>Inglewood</strong>’s. These were companies comprised <strong>of</strong> two or more stores.<br />
Chain stores enjoyed greater buying power and could therefore demand lower prices<br />
from manufacturers and retailers. The chains could afford to lure well-trained personnel<br />
away from other establishments, and they had the means to advertise in local newspapers.<br />
The chain store helped validate the mercantile strength <strong>of</strong> the areas selected for their<br />
development. In downtown <strong>Inglewood</strong>, the S.H. Kress Variety Store at 233-239 South<br />
Market Street (see Figure 5.5-1) was a product <strong>of</strong> the chain store phenomenon. California<br />
was a significant area for S.H. Kress & Company. Their first store in the state opened in<br />
San Diego in 1918 and by 1928 there were 28 stores statewide, with more to come.<br />
J.C. Penney, another nationwide merchandiser had established a store at 139 South<br />
Market Street (see Figure 5.5-1) in <strong>Inglewood</strong> by 1940. In 1954 they remodeled and<br />
expanded their store. The new two-story facility, with its deep canopy and single-glazed<br />
terra cotta column shared a number <strong>of</strong> features with other Penney stores.<br />
The branch bank was another aspect <strong>of</strong> the chain store phenomenon. It provided services<br />
previously only available in a major urban center, and in so doing functioned as a stimulus<br />
for local development. Established banks might construct new branch banks or they<br />
would purchase or lease existing bank buildings. For years the most formal building in<br />
downtown <strong>Inglewood</strong> was the First State Bank (later the First National Bank) located at<br />
the southeast corner <strong>of</strong> Commercial and Queen Streets, as shown in Figure 5.5-1. This<br />
<strong>City</strong> <strong>of</strong> <strong>Inglewood</strong> <strong>General</strong> <strong>Plan</strong> <strong>Update</strong> Technical Background Report<br />
5.5-7
Chapter 5 Environmental Resources<br />
was replaced in the post-war period by Security First National Bank. As noted earlier,<br />
Bank <strong>of</strong> America took over the Bank <strong>of</strong> <strong>Inglewood</strong> building in 1936.<br />
Although the depression deeply affected <strong>Inglewood</strong>, as it did other communities<br />
throughout the nation, the <strong>City</strong> benefited from the region’s relatively rapid economic<br />
recovery. Construction continued throughout the early 1930s. A number <strong>of</strong> the buildings<br />
constructed on both sides <strong>of</strong> the two hundred block <strong>of</strong> South Market Street date from the<br />
1930s. Another stimulus for construction came from the Long Beach earthquake <strong>of</strong> 1933.<br />
1930s commercial architecture in <strong>Inglewood</strong>, and throughout the Los Angeles region, was<br />
greatly affected by the automobile. The automobile changed the perception <strong>of</strong> how<br />
buildings are seen in the landscape. During the previous decade, access to commercial<br />
centers had gradually shifted from a dependence on public transportation, to the privately<br />
owned vehicle. By the 1930s, architects and designers had developed and architectural<br />
vocabulary that could express the speed and sensation <strong>of</strong> the automobile. The ubiquitous<br />
vernacular stucco box that housed commercial enterprises throughout Southern<br />
California was altered by popular Modern architectural imagery which ranged from the<br />
Art Deco <strong>of</strong> the 1920s to the Streamline Modern style. The Art Deco introduced a zigzag<br />
pattern <strong>of</strong> ornamentation around the entrance and window openings and parapet. The<br />
Sentinel Building (a 1921 building that had its two upper stories removed after the ’33<br />
earthquake) at 335–357 East Queen Street (see Figure 5.5-1) is characterized by its hybrid<br />
Deco-Egyptian that frames its upper floor. The Art-Deco style <strong>of</strong> architecture is also still<br />
seen today in the <strong>City</strong>’s only <strong>of</strong>ficially designated Art-Deco District along Manchester<br />
Boulevard in the Morningside Park’s commercial area. The Streamline Modern (popular<br />
from the 30s to the post-war period) was<br />
essentially an updated interpretation <strong>of</strong> a<br />
classical building and it was frequently employed<br />
in the design <strong>of</strong> public buildings and regional<br />
institutions , such as the Bank <strong>of</strong> America on<br />
330 West Manchester Boulevard (see<br />
Figure 5.5-1).<br />
The growth <strong>of</strong> the film industry during the<br />
1930s presented an opportunity for the<br />
application <strong>of</strong> new design to an emerging<br />
Fox Theater on Market Street<br />
development <strong>of</strong> the movie theater. The movie<br />
palace at 136–144 North Market Street was built as a United Artists Theater (1931), while<br />
the Fox Theater at 115 North Market Street was built for Fox West Coast Theaters<br />
(1948/49).<br />
<strong>Inglewood</strong>’s economic base began to expand outside the core downtown area toward the<br />
end <strong>of</strong> the 1930s. In 1938, the ultra-modern Hollywood Park racing facility opened,<br />
making <strong>Inglewood</strong> the home <strong>of</strong> Southern California’s summer racing season. This<br />
addition also made <strong>Inglewood</strong> a tourist destination—a status it had not previously<br />
enjoyed. Perhaps <strong>of</strong> greater significance to <strong>Inglewood</strong>’s future development was its<br />
proximity to Mines Field, an airstrip located to the southwest <strong>of</strong> the city. In 1937, the <strong>City</strong><br />
5.5-8<br />
<strong>City</strong> <strong>of</strong> <strong>Inglewood</strong> <strong>General</strong> <strong>Plan</strong> <strong>Update</strong> Technical Background Report
5.5 Historical and Cultural Resources<br />
<strong>of</strong> Los Angeles purchased Mines Field; they renamed it the Los Angeles Airport in 1946.<br />
Airplane manufacturers and related businesses located their factories in the area, and by<br />
the time <strong>of</strong> America’s entry into the World War II, Los Angeles had become the nation’s<br />
center for aircraft industry. These<br />
developments directly affected<br />
<strong>Inglewood</strong>’s growth. In 1938, the <strong>City</strong> had<br />
a population <strong>of</strong> 26,000; by 1956 the<br />
community had grown to 63,000. Housing<br />
construction naturally responded to the<br />
increased demand. Within the project site,<br />
a number <strong>of</strong> the single-family and multifamily<br />
residences on Locust Street date<br />
from the late 1930s through the early<br />
Hollywood Park Racing Facility<br />
1950s.<br />
<strong>Inglewood</strong>’s Chamber <strong>of</strong> Commerce claimed credit for persuading Los Angeles to select<br />
the Mines Field site for its airport. The Chamber’s new building (built in 1948), located at<br />
330 East Queen Street (see Figure 5.5-1), was one <strong>of</strong> the most visible expressions <strong>of</strong> the<br />
<strong>City</strong>’s optimistic outlook in the post-war period.<br />
In response to the increased local economy, new development occurred along the eastern<br />
edge <strong>of</strong> <strong>Inglewood</strong>’s downtown. In 1947, Sears opened a store at Manchester and<br />
Hillcrest (1947; demolished 1990s). La Brea Boulevard, defining the western edge <strong>of</strong> the<br />
historic downtown, was the other area <strong>of</strong> new construction in the post-war period.<br />
Sparkling Cleaners (see Figure 5.5-1) located at 320 South La Brea (built in 1948) is an<br />
excellent example <strong>of</strong> an architectural response to the automobile.<br />
While the Fox Theater, built on the site <strong>of</strong> the Granada Theater (1948-49) was the<br />
outstanding new building constructed on Market Street during the post-war period, a<br />
number <strong>of</strong> existing commercial buildings continued to be remodeled during this time in<br />
an effort to maintain and attract new costumers. LeRoy’s Credit Jewelers located at 125<br />
South Market Street (see Figure 5.5-1), is among the more visually interesting.<br />
By the end <strong>of</strong> the 1940s, <strong>Inglewood</strong> followed national trends in merchandizing, which<br />
favored decentralization, and the downtown area began to lose its primacy as the city’s<br />
shopping center. By the early 1960s, the city included four retail business areas which, in<br />
addition to downtown, included North <strong>Inglewood</strong>, Morningside Park, and Crenshaw.<br />
After World War II, the influx <strong>of</strong> defense-related industries, in addition to expanding<br />
retail areas, transformed the agriculturally oriented town into an urban industrial<br />
community, which ultimately brought <strong>Inglewood</strong> its present “urban look”.<br />
<strong>City</strong> <strong>of</strong> <strong>Inglewood</strong> <strong>General</strong> <strong>Plan</strong> <strong>Update</strong> Technical Background Report<br />
5.5-9
Chapter 5 Environmental Resources<br />
• Definitions—Historic Resources<br />
Federal<br />
The National Historic Preservation Act <strong>of</strong> 1966 established the National Register to recognize<br />
resources associated with the country’s history and heritage. Structures and features must<br />
usually be at least 50 years old to be considered for listing on the National Register,<br />
barring exceptional circumstances. Criteria for listing on the National Register, which are<br />
set forth in Title 26, Part 63 <strong>of</strong> the Code <strong>of</strong> Federal Regulations (36 CFR Part 63), are<br />
significance in American history, architecture, archaeology, engineering, and culture as<br />
present in districts, sites, buildings, structures, and objects that possess integrity <strong>of</strong><br />
location, design, setting, materials, workmanship, feeling, and association, and that are:<br />
A. Associated with events that have made a significant contribution to the broad<br />
patterns <strong>of</strong> our history;<br />
B. Associated with the lives <strong>of</strong> persons significant in our past;<br />
C. Embody the distinctive characteristics <strong>of</strong> a type, period, or method <strong>of</strong> construction;<br />
represent the work <strong>of</strong> a master; possess high artistic values, represent a significant<br />
and distinguishable entity whose components may lack individual distinction; or<br />
D. Have yielded, or may be likely to yield, information important in prehistory or<br />
history. Criterion D is usually reserved for archaeological and paleontological<br />
resources.<br />
State<br />
In 1992, the California Register <strong>of</strong> Historical Resources (CRHR) was created to identify<br />
resources deemed worthy <strong>of</strong> preservation on a state level and was modeled closely after<br />
the National Register process. The criteria are nearly identical to those <strong>of</strong> the National<br />
Register but focus upon resources <strong>of</strong> statewide, rather than national, significance. The<br />
CRHR encourages public recognition and protection <strong>of</strong> resources <strong>of</strong> architectural,<br />
historical, archeological, and cultural significance, identifies historical resources for state<br />
and local planning purposes, determines eligibility for state historic preservation grant<br />
funding, and affords certain protections under the California Environmental Quality Act<br />
(CEQA). The CRHR automatically includes resources listed on the National Register.<br />
Specifically, the CRHR includes the following resources:<br />
• Resources formally determined eligible for, or listed in, the National Register <strong>of</strong><br />
Historic Places<br />
• State Historical Landmarks numbered 770 or higher<br />
• Points <strong>of</strong> Historical Interest recommended for listing by the State Historical<br />
Resources Commission (SHRC)<br />
• Resources nominated for listing and determined eligible in accordance with criteria<br />
and procedures adopted by the SHRC including<br />
› Individual historic resources and historic districts<br />
› Resources identified as significant in historical resources surveys which meet<br />
certain criteria<br />
5.5-10<br />
<strong>City</strong> <strong>of</strong> <strong>Inglewood</strong> <strong>General</strong> <strong>Plan</strong> <strong>Update</strong> Technical Background Report
5.5 Historical and Cultural Resources<br />
› Resources and districts designated as city or county landmarks pursuant to a city<br />
or county ordinance when the designation criteria are consistent with California<br />
Register criteria<br />
Local<br />
Although there is no established local register, different historic resource surveys have<br />
been completed for <strong>Inglewood</strong> in order to identify individual buildings and places <strong>of</strong><br />
historic/architectural significance, and determine the potential for a historic district.<br />
These surveys were prepared according to the Secretary <strong>of</strong> the Interior’s Standards for<br />
preservation, planning, identification, evaluation, and registration <strong>of</strong> historic resources.<br />
Each surveyed property was assigned a National Register <strong>of</strong> Historic Places (NRHP)<br />
Status Code. These codes were developed by the California Office <strong>of</strong> Historic<br />
Preservation and are standardized throughout the state. They rate buildings according to<br />
their level <strong>of</strong> historical significance, ranging from National Register eligible to local<br />
landmark eligible to not historically/architecturally significant.<br />
It is important to note that properties that are not listed or not eligible to be listed on the<br />
National Register <strong>of</strong> Historic Places, may still be considered historical for the purposes <strong>of</strong><br />
applying the CEQA to a proposed project that could have an adverse impact on these<br />
properties, depending on the results <strong>of</strong> analysis performed at the time the project is<br />
evaluated.<br />
• Existing Conditions—Historic Resources<br />
Important historic resources which exist in <strong>Inglewood</strong> today, as shown in Figure 5.5-1<br />
include the following:<br />
Listed in the State and National Register:<br />
The Centinela Adobe House: Birthplace <strong>of</strong><br />
<strong>Inglewood</strong>. The oldest house in Centinela Valley. Built<br />
in the 1830s by Ignacio Machado, it has been owned<br />
by a Civil War <strong>General</strong>, a Scottish Baronet and Daniel<br />
Freeman, founder <strong>of</strong> <strong>Inglewood</strong>, whose land <strong>of</strong>fice<br />
was relocated to the property. This property is located<br />
on 7634 Midfield Avenue and is used as a museum<br />
today. It is a California State Historic Landmark, and is<br />
listed on the National Register <strong>of</strong> historic places.<br />
The Centinela Springs: Listed as a landmark under<br />
the National Register <strong>of</strong> historic places; the bubbling<br />
springs once flowed from their source in a deep water<br />
basin which has existed continuously since the<br />
Pleistocene Era. Prehistoric animals, Indians, and early<br />
Centinela Adobe House<br />
The Centinela Springs<br />
<strong>City</strong> <strong>of</strong> <strong>Inglewood</strong> <strong>General</strong> <strong>Plan</strong> <strong>Update</strong> Technical Background Report<br />
5.5-11
Chapter 5 Environmental Resources<br />
<strong>Inglewood</strong> settlers were attracted here by the pure artesian water. The springs and valley<br />
were named after sentinels guarding cattle in the area. The Centinela Springs are located<br />
in Edward Vincent Jr. Park, on the corner <strong>of</strong> Park Ave. and Stepney Street.<br />
The <strong>Inglewood</strong> Veteran’s Memorial Building: This<br />
building is located in Edward Vincent Jr. Park at 330 West<br />
Centinela Avenue. Built in the 1930s, it is a California<br />
State Historic Landmark and is listed on the National<br />
Register <strong>of</strong> historic places.<br />
Other Local Resources<br />
Other resources which are not listed on the National or<br />
State Register but may still qualify as historic include:<br />
Veteran’s Memorial<br />
The Grace Chapel at <strong>Inglewood</strong> Park Cemetery:<br />
Built in 1925, Grace Chapel is a replica <strong>of</strong> a chapel<br />
in Edinburgh, Scotland. The Columbarium adjacent<br />
to it is filled with urns and adorned with stained<br />
glass windows and ceilings that cast an amber hue<br />
to the room.<br />
Despite efforts to preserve these and other<br />
resources within <strong>Inglewood</strong>, the <strong>City</strong> has<br />
Grace Chapel at <strong>Inglewood</strong> experienced economic decline over the past decade.<br />
Many <strong>of</strong> the commercial properties with historic value are vacant or contain businesses<br />
which are marginal or underutilized. Additional efforts which provide financial help and<br />
incentives to revitalize local businesses are being made by different organisms under the<br />
Community Development Department.<br />
In 1998 a historic survey was prepared for the area designated as “Main Street<br />
<strong>Inglewood</strong>”, located within the downtown district. The area is bounded by La Brea<br />
Avenue to the west, Locus Street to the east, Florence Avenue to the north, and Hillcrest<br />
Boulevard to the south. A total <strong>of</strong> 112 buildings were surveyed as part <strong>of</strong> this project. The<br />
results, in accordance with the NRHP Status Codes, are as follows:<br />
• No historic district was identified for the project area.<br />
• 8 buildings determined individually National Register eligible.<br />
• 2 buildings determined potentially National Register eligible when 50 years <strong>of</strong> age.<br />
• 1 site determined potentially National Register eligible with more research.<br />
• 5 buildings determined potentially National Register eligible if restored.<br />
• 17 buildings determined eligible for local landmark listing.<br />
• 14 buildings determined worthy <strong>of</strong> consideration in the local planning process.<br />
• 51 buildings determined not historically or architecturally significant.<br />
• 1 building demolished during the survey project.<br />
• Results <strong>of</strong> this survey by property are summarized in the Database Master Report<br />
<strong>of</strong> the <strong>Inglewood</strong> Downtown District Main Street Project Area Design Guidelines<br />
document. The eight properties that were identified as eligible for individual listing<br />
5.5-12<br />
<strong>City</strong> <strong>of</strong> <strong>Inglewood</strong> <strong>General</strong> <strong>Plan</strong> <strong>Update</strong> Technical Background Report
5.5 Historical and Cultural Resources<br />
in the National Register <strong>of</strong> Historic Places in their existing conditions are listed<br />
below.<br />
• 170 North La Brea Avenue, Citizens Savings Bank: constructed in 1921-22, the<br />
Citizens Savings Bank, is eligible for listing in the National Register under Criterion<br />
A for its association with early commercial development in <strong>Inglewood</strong>. Built during<br />
the city’s rapid population growth and rebuilt after the 1920 earthquake, it reflects<br />
the continued development <strong>of</strong> North La Brea Avenue (then Commercial Street) as<br />
the city’s primary commercial artery.<br />
• 320 South La Brea Blvd, Sparkling Cleaners: This building is eligible for listing<br />
in the National Register under Criterion C as it embodies the distinctive<br />
characteristics <strong>of</strong> Post-War late Modern style architecture and is one <strong>of</strong> the finest<br />
examples remaining in <strong>Inglewood</strong>. Since its construction in 1948 it has been used<br />
as a dry cleaners.<br />
• 330 East Manchester Blvd, Bank <strong>of</strong> America: The Bank <strong>of</strong> America building<br />
was constructed in 1948 and is eligible for listing in the National Register under<br />
Criterion C as a very good example <strong>of</strong> the Post-War Modern style in <strong>Inglewood</strong>.<br />
The small building at 320 East Manchester was remodeled in 1954 as part <strong>of</strong> the<br />
bank and may become a contributing feature <strong>of</strong> the property as it is also older than<br />
50 years.<br />
• 100 North Market Street, Bank <strong>of</strong> <strong>Inglewood</strong>: Constructed in 1927 as the Bank<br />
<strong>of</strong> <strong>Inglewood</strong>, this building is eligible for listing in the National Register <strong>of</strong> Historic<br />
Places under Criterion C as an excellent example <strong>of</strong> a Mediterranean Revival style<br />
in <strong>Inglewood</strong>. The building was sold to the Bank <strong>of</strong> America National Trust and<br />
Savings Association in 1936. It is now a bookstore.<br />
• 115 North Market Street, Fox Theater: The Fox Theater was constructed in<br />
1948-49, and is eligible for listing in the National Register under Criterion C as a<br />
very good example <strong>of</strong> a late Modern style movie theater in <strong>Inglewood</strong>. It was<br />
designed by the architect S. Charles for Fox West Coast Theaters.<br />
• 200–204 South Market, Scotty’s Men’s Shop: Historically known as Scotty’s<br />
Men’s Shop, this building is eligible for listing in the National Register <strong>of</strong> Historic<br />
Places under Criterion C because it embodies the distinctive characteristics <strong>of</strong> the<br />
Streamline Modern style which became popular beginning in the late 1930s. The<br />
building now houses Cox Menswear.<br />
• 233–239 Market Street, S.H. Kress Variety Store: The S.H. Kress Variety Store<br />
was built in 1927 and is eligible for listing in the National Register <strong>of</strong> Historic<br />
Places under Criterion C for its association with the chain store concept <strong>of</strong><br />
merchandizing which developed in the 1920s. California was a significant area for<br />
S.H. Kress & Company. They opened the first store in San Diego in 1918 and by<br />
1928 there were 28 stores statewide. The <strong>Inglewood</strong> store shares a number <strong>of</strong> the<br />
features with Kress stores that were built during the latter part <strong>of</strong> the 1920s<br />
throughout the nation.<br />
• 330 East Queen Street, <strong>Inglewood</strong> Chamber <strong>of</strong> Commerce: The Chamber <strong>of</strong><br />
Commerce building, constructed in 1948, is eligible for listing in the National<br />
Register <strong>of</strong> Historic Places under Criteria C as it embodies the distinctive<br />
characteristics <strong>of</strong> Post-War architecture as is one <strong>of</strong> the finest examples remaining<br />
in <strong>Inglewood</strong>.<br />
• Since the focus <strong>of</strong> the existing survey was <strong>Inglewood</strong>’s downtown commercial<br />
development (where most historic resources within the <strong>City</strong> are located), other<br />
resources located outside the downtown district (with the exception <strong>of</strong> the<br />
<strong>City</strong> <strong>of</strong> <strong>Inglewood</strong> <strong>General</strong> <strong>Plan</strong> <strong>Update</strong> Technical Background Report<br />
5.5-13
Chapter 5 Environmental Resources<br />
Centinela Adobe House, the Centinela Springs, and the Grace Chapel at <strong>Inglewood</strong><br />
Park Cemetery) have not been evaluated in terms <strong>of</strong> their historic value as <strong>of</strong> today.<br />
Further survey work and historic research on <strong>Inglewood</strong>’s resources outside <strong>of</strong> the<br />
downtown area is needed.<br />
• Regulatory Setting—Historical Resources<br />
The treatment <strong>of</strong> historical resources is governed by federal, state, and local laws and<br />
guidelines. There are specific criteria for determining whether historic sites or objects are<br />
significant and/or protected by law. Federal and state significance criteria generally focus<br />
on the resource’s integrity and uniqueness, its relationship to similar resources, and its<br />
potential to contribute important information to scholarly research. Some resources that<br />
do not meet federal significance criteria may be considered significant by state criteria.<br />
The laws and regulations seek to mitigate impacts on significant historic resources. The<br />
federal, state, and local laws and guidelines for protecting historic resources are<br />
summarized below.<br />
Federal Regulations<br />
The National Historic Preservation Act<br />
The National Historic Preservation Act established the National Register to recognize<br />
resources associated with the country’s history and heritage. Structures and features<br />
usually must be at least 50 years old to be considered for listing on the National Register,<br />
barring exceptional circumstances. Criteria for listing on the National Register, which are<br />
set forth in Title 26, Part 63 <strong>of</strong> the Code <strong>of</strong> Federal Regulations (36 CFR Part 63), are<br />
significance in American history, architecture, archaeology, engineering, and culture as<br />
present in districts, sites, buildings, structures, and objects that possess integrity <strong>of</strong><br />
location, design, setting, materials, workmanship, feeling, and association, and that are (A)<br />
associated with events that have made a significant contribution to the broad patterns <strong>of</strong><br />
our history; (B) associated with the lives <strong>of</strong> persons significant in our past; (C) embody the<br />
distinctive characteristics <strong>of</strong> a type, period, or method <strong>of</strong> construction; represent the work<br />
<strong>of</strong> a master; possess high artistic values, represent a significant and distinguishable entity<br />
whose components may lack individual distinction; or (D) have yielded, or may be likely<br />
to yield, information important in prehistory or history. Criterion D is usually reserved<br />
for archaeological and paleontological resources.<br />
The Secretary <strong>of</strong> the Interior’s Standards for the Treatment <strong>of</strong> Historic<br />
Properties<br />
The Secretary <strong>of</strong> the Interior is responsible for establishing standards for the preservation<br />
and protection <strong>of</strong> buildings and other cultural resources eligible for listing in the National<br />
Register. The 1990 Secretary <strong>of</strong> the Interior’s Standard for the Treatment <strong>of</strong> Historic Properties<br />
document outlines specific standards and guidelines for the preservation, rehabilitation,<br />
restoration, and reconstruction <strong>of</strong> historically designated structures. Preservation<br />
standards and guidelines apply to those buildings that require ongoing maintenance to<br />
sustain its existence for historicity. Rehabilitation standards and guidelines involve the<br />
5.5-14<br />
<strong>City</strong> <strong>of</strong> <strong>Inglewood</strong> <strong>General</strong> <strong>Plan</strong> <strong>Update</strong> Technical Background Report
5.5 Historical and Cultural Resources<br />
reuse <strong>of</strong> a historic structure or property while maintaining portions that maintain historic<br />
value. Restoration standards and guidelines are applicable to projects that remove<br />
portions <strong>of</strong> a building from another historic period in order to reconstruct missing<br />
features from the restoration period. Reconstruction standards and guidelines apply to<br />
new developments that replicate a historic period or setting. Each set <strong>of</strong> standards<br />
provides specific recommendations for the proper treatment <strong>of</strong> specific building<br />
materials, as well as parts <strong>of</strong> building development.<br />
State Regulations<br />
State historic preservation regulations include the statutes and guidelines contained in the<br />
California Environmental Quality Act (CEQA) Public Resources Code Sections 21083.2<br />
and 21084.1, and Section 15064.5 <strong>of</strong> the CEQA Guidelines. CEQA requires lead agencies<br />
to carefully consider the potential effects <strong>of</strong> a project on historical resources. A “historical<br />
resource” includes, but is not limited to, any object, building, structure, site, area, place,<br />
record, or manuscript that is historically or archaeologically significant (Public Resources<br />
Code Section 5020.1). Advice on procedures to identify such resources, evaluate their<br />
importance, and estimate potential effects is given in several agency publications such as<br />
the series produced by the Governor’s Office <strong>of</strong> <strong>Plan</strong>ning and Research (OPR).<br />
The California Register <strong>of</strong> Historic Resources<br />
As discussed previously, the California Register <strong>of</strong> Historic Resources (CRHR) was<br />
created to identify resources deemed worthy <strong>of</strong> preservation on a state level and was<br />
modeled closely after the National Register. The criteria are nearly identical to those <strong>of</strong><br />
the National Register but focus upon resources <strong>of</strong> Statewide, rather than national<br />
significance. The CRHR automatically includes resources listed on the National Register.<br />
Local<br />
There is no existing regulation within the <strong>Inglewood</strong> zoning code intended to protect<br />
historic resources.<br />
• Cultural Resources<br />
In January 1995, the <strong>City</strong> if <strong>Inglewood</strong> was awarded a Municipal Cultural <strong>Plan</strong>ning Grant<br />
by the Music and Performing Arts Commission <strong>of</strong> Los Angeles County. A Committee<br />
comprised <strong>of</strong> staff from Recreation and Community Services, the <strong>Plan</strong>ning Division and<br />
an administrator <strong>of</strong> an arts organization was created to select a consultant for the creation<br />
<strong>of</strong> <strong>Inglewood</strong>’s Cultural Arts Master <strong>Plan</strong>. Major goals to be accomplished by this master<br />
plan include:<br />
• Establish an ongoing <strong>City</strong> government sponsored entity to administer and support<br />
arts and culture related activities in <strong>Inglewood</strong>.<br />
• Integrate arts education into the regular <strong>Inglewood</strong> School District curriculum.<br />
• Increase opportunities for community based arts appreciation and instruction for<br />
youth and adults.<br />
<strong>City</strong> <strong>of</strong> <strong>Inglewood</strong> <strong>General</strong> <strong>Plan</strong> <strong>Update</strong> Technical Background Report<br />
5.5-15
Chapter 5 Environmental Resources<br />
• Create a multi-use venue or a cluster <strong>of</strong> venues which can serve as focal points for<br />
art in <strong>Inglewood</strong> and provide appropriate spaces for the presentation <strong>of</strong> the visual<br />
and performing arts.<br />
• Create a supportive environment that encourages artists to live and present their<br />
work in <strong>Inglewood</strong>.<br />
• Develop funding and other resources to support the arts.<br />
• Expand <strong>Inglewood</strong>’s image to include arts and culture.<br />
Different recognized pr<strong>of</strong>essional artists from all <strong>of</strong> the visual and performing arts<br />
disciplines live in <strong>Inglewood</strong>; however the artists have low pr<strong>of</strong>iles within the <strong>City</strong> due to<br />
the inadequacy <strong>of</strong> the venues and the lack <strong>of</strong> funding to support the creation and<br />
presentation <strong>of</strong> art in <strong>Inglewood</strong>. An important challenge for the Cultural Arts Master<br />
<strong>Plan</strong> is to provide local artists with better opportunities and funding to display their work<br />
locally. Some <strong>of</strong> the existing cultural resources / art pieces within <strong>Inglewood</strong> today<br />
include:<br />
• “Teach Us to Know”—a mural painted<br />
by <strong>Inglewood</strong> youth. <strong>Inglewood</strong> based<br />
artist Nancy Williams led a group <strong>of</strong> teens<br />
through the design and paint process <strong>of</strong><br />
“Teach Us to Know”, a mural which is<br />
located at Darby Park. The theme <strong>of</strong> the<br />
mural was inspired by the thirst for<br />
knowledge, and the idea that knowing<br />
should dispel ignorance and<br />
misunderstanding.<br />
• Renowned Artist Gift to Community<br />
Presents a Composite <strong>of</strong> the Past and<br />
the Present Mural. Muralist Richard<br />
Wyatt, whose work is recognized<br />
throughout Los Angeles County, is the<br />
creative talent behind the mural located on<br />
<strong>Inglewood</strong> High School’s Gymnasium<br />
north wall. The work is a reflection <strong>of</strong><br />
<strong>Inglewood</strong>’s modern character, strong<br />
presence and rich history, portrays a mirror<br />
image <strong>of</strong> <strong>Inglewood</strong>’s roots, the Centinela<br />
Valley.<br />
Teach Us to Know Mural<br />
Composite <strong>of</strong> the Past and the<br />
• The Centinela Adobe Museum. Built in the 1830s, it is the oldest house in all <strong>of</strong><br />
Centinela Valley. The property functions as a museum today representing a cultural<br />
as well as historic resource for the <strong>City</strong>. The Centinela Adobe Museum contains<br />
important buildings, artifacts and photographs depicting <strong>Inglewood</strong>’s heritage.<br />
• History <strong>of</strong> Transportation Mural. This mural is listed in the California Register<br />
<strong>of</strong> Historical Resources and plays an important role in conveying the history <strong>of</strong><br />
<strong>Inglewood</strong>. The mural was originally constructed in Edward Vincent Jr. Park in<br />
1940 as a Works Progress Administration (WPA) project by the noted California<br />
artist Helen Lundeberg. Today, the mural is being restored and will be relocated to<br />
Grevillea Art Park on fall <strong>of</strong> 2006. The mural is 240 feet long and it is comprised <strong>of</strong><br />
5.5-16<br />
<strong>City</strong> <strong>of</strong> <strong>Inglewood</strong> <strong>General</strong> <strong>Plan</strong> <strong>Update</strong> Technical Background Report
5.5 Historical and Cultural Resources<br />
History <strong>of</strong> Transportation Mural<br />
(before restoration)<br />
60 panels, each 7½ ft. high x 4 ft.<br />
wide, the 2-inch deep mosaic<br />
elements are supported by a 14-<br />
inch-thick cast concrete wall.<br />
• Regulatory Setting—Cultural<br />
Resources<br />
On June 8, 2004, the Mayor, and Council<br />
Members adopted what became the first<br />
ordinance specifically designated for the<br />
support <strong>of</strong> the arts in <strong>Inglewood</strong>, the Percent for Arts in Public Places Ordinance,<br />
mandating the following: The ordinance requires that any new development <strong>of</strong> a private<br />
structure over $250,000, must provide public arts valued at one percent <strong>of</strong> the project’s<br />
value (project’s value is determined by the Building and Safety Division). The provision<br />
<strong>of</strong> the required public art can be satisfied in one <strong>of</strong> the following methods:<br />
• Donation <strong>of</strong> artwork.<br />
• Development <strong>of</strong> art project or art program.<br />
• In-lieu <strong>of</strong> fee payment.<br />
• Issues<br />
• The <strong>City</strong> lacks a local register <strong>of</strong> historical resources or a historic preservation<br />
ordinance to protect and promote preservation <strong>of</strong> the <strong>City</strong>’s historic resources.<br />
• The <strong>City</strong> has not performed local surveys or studies that evaluate resources outside<br />
<strong>of</strong> the downtown area that may be historically significant.<br />
• Many <strong>of</strong> the commercial properties with historic value are vacant or contain<br />
businesses which are marginal or underutilized.<br />
• The pressure for redevelopment continues to threaten historic residential and<br />
commercial structures within the <strong>City</strong>.<br />
• A large number <strong>of</strong> the existing historic areas have been negatively affected by<br />
incompatible architectural designs that do not acknowledge the historical context<br />
<strong>of</strong> surrounding development.<br />
• <strong>Inglewood</strong> has limited venues suitable for the presentation <strong>of</strong> pr<strong>of</strong>essional quality<br />
visual and performing artists.<br />
• The <strong>City</strong> <strong>of</strong> <strong>Inglewood</strong> is noted for sports and entertainment but lacks recognition<br />
for artist cultural opportunities<br />
• References<br />
Cheryl D. Cromwell and Lee Draper Associates, 1996. Cultural Arts Master <strong>Plan</strong> for the<br />
<strong>City</strong> <strong>of</strong> <strong>Inglewood</strong> Department <strong>of</strong> Recreation and Community Services. June.<br />
University <strong>of</strong> Southern California School <strong>of</strong> Policy <strong>Plan</strong>ning and Development, 1999. The<br />
Main Street Organization and Downtown <strong>Inglewood</strong> Commercial Revitalization<br />
Feasibility Analysis and Project <strong>Plan</strong>. December.<br />
<strong>City</strong> <strong>of</strong> <strong>Inglewood</strong> <strong>General</strong> <strong>Plan</strong> <strong>Update</strong> Technical Background Report<br />
5.5-17
Chapter 5 Environmental Resources<br />
Lauren Weiss Bricker, Marion Mitchell-Wilson, and Janet L. Tearnen, 2000. <strong>Inglewood</strong><br />
Downtown District Main Street Project Area Historic Design Guidelines. May 15.<br />
Carson Anderson, 1997. Crenshaw-Prairie Transportation Corridor Historic Assessment<br />
Report. October.<br />
National Register <strong>of</strong> Historic Places, Los Angeles County, website:<br />
http://www.nationalregister<strong>of</strong>historicplaces.com/CA/Los+Angeles/state.html,<br />
accessed February, 2006.<br />
California Environmental Resources Evaluation System website, State Historical<br />
Landmarks, Los Angeles County, website:<br />
http://ceres.ca.gov/geo_area/counties/Los_Angeles/landmarks.html, accessed<br />
February, 2006.<br />
5.5-18<br />
<strong>City</strong> <strong>of</strong> <strong>Inglewood</strong> <strong>General</strong> <strong>Plan</strong> <strong>Update</strong> Technical Background Report
5.6 Air Quality<br />
5.6 AIR QUALITY<br />
This section describes the environmental conditions affecting and affected by existing air<br />
quality within the <strong>City</strong> <strong>of</strong> <strong>Inglewood</strong>. The regulatory agencies responsible for managing<br />
and improving air quality within the <strong>City</strong> are discussed along with the regulations and<br />
plans that have been adopted to improve regional air quality. Informational sources used<br />
to prepare this section include the South Coast Air Quality Management District’s<br />
(SCAQMD’s) 2003 Air Quality Management <strong>Plan</strong> (AQMP) and CEQA Air Quality<br />
Handbook (1993 edition).<br />
• Existing Conditions<br />
Meteorology and Climate<br />
The <strong>City</strong> <strong>of</strong> <strong>Inglewood</strong> is located within the South Coast Air Basin (Basin). This area<br />
includes all <strong>of</strong> Orange County and the non-desert portions <strong>of</strong> Los Angeles, San<br />
Bernardino, and Riverside Counties. The Basin is bounded by the Pacific Ocean to the<br />
west and the San Gabriel, San Bernardino, and San Jacinto Mountains to the north and<br />
east. The regional climate within the Basin is considered semi-arid and is characterized by<br />
warm summers, mild winters, infrequent seasonal rainfall, moderate daytime onshore<br />
breezes, and moderate humidity. The Basin is almost entirely urban and its pollution is<br />
typically related to dense population and associated area sources, heavy vehicular traffic,<br />
and industrial sources. The Basin’s meteorological conditions and topography also<br />
contribute heavily to regional air pollution. The mountains surrounding the Basin <strong>of</strong>ten<br />
trap the air and its pollutants in the valleys or basins below resulting in increased pollutant<br />
levels.<br />
The annual average temperature varies little throughout the Basin, ranging from the low<br />
to middle 60s, measured in degrees Fahrenheit (°F). With a more pronounced oceanic<br />
influence, coastal areas show less variability in annual minimum and maximum<br />
temperatures than inland areas. The <strong>City</strong> <strong>of</strong> <strong>Inglewood</strong> is located in Los Angeles County,<br />
which is in the western portion <strong>of</strong> the Basin. Annual average temperature in the <strong>City</strong><br />
ranges from 55.2 to 71.2°F. 85 Typically, the hottest and coldest months in the <strong>City</strong> are in<br />
August and January, respectively.<br />
The majority <strong>of</strong> annual rainfall in the Basin occurs between November and April.<br />
Summer rainfall is minimal and generally limited to scattered thundershowers in coastal<br />
regions and slightly heavier showers in the eastern portion <strong>of</strong> the Basin along the coastal<br />
side <strong>of</strong> the mountains. The average rainfall measured at the <strong>City</strong> ranges from 0.1 inches in<br />
July to 3.2 inches in February, with an annual average total <strong>of</strong> 13.5 inches. 86<br />
85 Western Regional Climate Center, http://www.wrcc.dri.edu, accessed April 2006.<br />
86 Ibid.<br />
<strong>City</strong> <strong>of</strong> <strong>Inglewood</strong> <strong>General</strong> <strong>Plan</strong> <strong>Update</strong> Technical Background Report<br />
5.6-1
Chapter 5 Environmental Resources<br />
The Basin experiences a persistent temperature inversion. Temperature typically decreases<br />
with height. However, under inversion conditions, temperature increases as altitude<br />
increases, thereby preventing air close to the ground from mixing with the air above it.<br />
This inversion limits the vertical dispersion <strong>of</strong> air contaminants, holding them relatively<br />
near the ground. As the sun warms the ground and the lower air layer, the temperature <strong>of</strong><br />
the lower air layer approaches the temperature <strong>of</strong> the base <strong>of</strong> the inversion (upper) layer<br />
until the inversion layer finally breaks, allowing vertical mixing with the lower layer.<br />
Aside from a persistent temperature inversion, the vertical dispersion <strong>of</strong> air contaminants<br />
in the Basin is also affected by wind conditions. The combination <strong>of</strong> stagnant wind<br />
conditions and low inversions produces the greatest pollutant concentrations. On days <strong>of</strong><br />
no inversion or high wind speeds, ambient air pollutant concentrations are the lowest.<br />
During periods <strong>of</strong> low inversions and low wind speeds, air pollutants generated in<br />
urbanized areas in the Basin are transported predominantly on shore into Riverside and<br />
San Bernardino Counties. The Santa Ana winds, which are strong and dry north or<br />
northeasterly winds that occur during the fall and winter months, also disperse air<br />
contaminants in the Basin. The Santa Ana conditions tend to last for several days at a<br />
time.<br />
The nearest, most representative meteorological monitoring station to the <strong>City</strong> <strong>of</strong><br />
<strong>Inglewood</strong> is located in the <strong>City</strong> <strong>of</strong> Lennox. 87 Wind speeds recorded at this monitoring<br />
station average 5.0 miles per hour. Calm winds (i.e., winds less than approximately 3.5<br />
miles per hour) occur approximately 10.3 percent <strong>of</strong> the time. The <strong>City</strong> <strong>of</strong> <strong>Inglewood</strong> and<br />
its surrounding area typically experience a daytime onshore sea breeze. While nighttime<br />
land breezes can also occur, wind in the Los Angeles area is almost exclusively from the<br />
west. This regime is broken only by occasional winter storms and infrequent strong<br />
northeasterly Santa Ana winds from the mountains and deserts north <strong>of</strong> the Basin. A<br />
diagram showing wind directions and speeds within the vicinity <strong>of</strong> the <strong>City</strong> is shown in<br />
Figure 5.6-1. The wind rose diagram includes frequencies symbolizing wind directions.<br />
Each frequency in the figure shows the direction from which the wind is blowing.<br />
Air Quality Background<br />
Air pollutant emissions within the Basin are generated by stationary and mobile sources.<br />
Stationary sources can be divided into two major subcategories: point and area sources.<br />
Point sources are usually subject to a permit to operate from SCAQMD, the agency<br />
principally responsible for comprehensive air pollution control in the Basin. Point sources<br />
occur at a specific identified location and are usually associated with manufacturing and<br />
industrial processes. Examples <strong>of</strong> point sources are smoke stacks, boilers, and<br />
combustion equipment.<br />
87 South Coast Air Quality Management District, Meteorological Data for Lennox,<br />
http://www.aqmd.gov/smog/metdata/MeteorologicalData.html, accessed April 2006.<br />
5.6-2<br />
<strong>City</strong> <strong>of</strong> <strong>Inglewood</strong> <strong>General</strong> <strong>Plan</strong> <strong>Update</strong> Technical Background Report
CITY <strong>of</strong> INGLEWOOD<br />
<strong>General</strong> <strong>Plan</strong><br />
WIND ROSE<br />
NORTH<br />
30%<br />
24%<br />
18%<br />
12%<br />
6%<br />
WEST<br />
EAST<br />
WIND SPEED<br />
(Knots)<br />
>= 22<br />
17 - 21<br />
SOUTH<br />
11 - 17<br />
7 - 11<br />
4 - 7<br />
1 - 4<br />
Calms: 12.79%<br />
Source: South Coast Air Quality Management District.<br />
Date: April 5, 2006<br />
Miles<br />
A Division <strong>of</strong> 0 0.25 0.5<br />
Figure 5.6-1
5.6 Air Quality<br />
Area sources are widely distributed and produce many small emissions. Area sources do<br />
not require permits to operate from SCAQMD. Examples <strong>of</strong> area sources include<br />
residential and commercial water heaters, painting operations, portable generators, lawn<br />
mowers, agricultural fields, landfills, and consumer products, such as charcoal lighter fluid<br />
and hair spray.<br />
Mobile sources refer to emissions from motor vehicles, including tailpipe and evaporative<br />
emissions. Mobile sources are classified as either on-road or <strong>of</strong>f-road. On-road sources<br />
are those that are legally operated on roadways and highways, such as automobiles and<br />
trucks. Off-road sources include aircraft, ships, trains, and construction equipment<br />
vehicles. Mobile sources account for the majority <strong>of</strong> air pollutant emissions within the<br />
Basin.<br />
Natural sources account for a small percentage <strong>of</strong> air pollutants in the Basin. Natural<br />
sources include high winds that pull dust particles from the surface and pollen.<br />
Both the federal and state governments have established ambient air quality standards for<br />
outdoor concentrations <strong>of</strong> specific pollutants, referred to as “criteria pollutants,” to<br />
protect public health. The National and California Ambient Air Quality Standards,<br />
although different, have both been set at concentration levels to protect the most<br />
sensitive persons from illness or discomfort with a margin <strong>of</strong> safety. In general, the state<br />
standards are more health protective than the national standards. Applicable ambient air<br />
quality standards are identified in Table 5.6-1. SCAQMD is responsible for bringing air<br />
quality within the Basin into attainment with national and state ambient air quality<br />
standards.<br />
The criteria pollutants for which national and state standards have been promulgated and<br />
that are most relevant to air quality planning and regulation in the Basin are ozone (O 3 ),<br />
carbon monoxide (CO), suspended particulate matter (PM 10 and PM 2.5 ), nitrogen dioxide<br />
(NO 2 ), sulfur dioxide (SO 2 ), and lead (Pb). In addition, toxic air contaminants (TACs) are<br />
<strong>of</strong> concern in the Basin. Each <strong>of</strong> these is briefly described below.<br />
• Ozone is a gas that is formed when volatile organic compounds (VOC) and nitrogen<br />
oxides (NO X ), both byproducts <strong>of</strong> internal combustion engine exhaust, undergo<br />
slow photochemical reactions in the presence <strong>of</strong> sunlight. Ozone concentrations<br />
are generally highest during the summer months when direct sunlight, light wind,<br />
and warm temperature conditions are favorable to the formation <strong>of</strong> this pollutant.<br />
• Carbon Monoxide is a colorless, odorless gas produced by the incomplete<br />
combustion <strong>of</strong> fuels. CO concentrations tend to be the highest during cooler<br />
winter mornings with little to no wind when surface-based inversions trap the<br />
pollutant at ground levels. Because CO is emitted directly from internal<br />
combustion engines, unlike O 3 , and motor vehicles operating at slow speeds are the<br />
primary source <strong>of</strong> CO in the Basin, the highest ambient CO concentrations are<br />
generally found near congested transportation corridors and intersections.<br />
• Suspended Particulate Matter consists <strong>of</strong> very small liquid and solid particles floating in<br />
the air, which can include smoke, soot, dust, salts, acids, and metals. Particulate<br />
<strong>City</strong> <strong>of</strong> <strong>Inglewood</strong> <strong>General</strong> <strong>Plan</strong> <strong>Update</strong> Technical Background Report<br />
5.6-5
Chapter 5 Environmental Resources<br />
matter also forms when gases emitted from industries and motor vehicles undergo<br />
chemical reactions in the atmosphere. PM 10 and PM 2.5 represent fractions <strong>of</strong><br />
particulate matter. Inhalable particulate matter (PM 10 ) refers to particulate matter 10<br />
microns or less in diameter, about one/seventh the thickness <strong>of</strong> a human hair. Fine<br />
particulate matter (PM 2.5 ) refers to particulate matter that is 2.5 microns or less in<br />
diameter, roughly 1/28th the diameter <strong>of</strong> a human hair. Major sources <strong>of</strong> PM 10<br />
include crushing or grinding operations; dust stirred up by vehicles traveling on<br />
roads; wood burning stoves and fireplaces; dust from construction, landfills, and<br />
agriculture; wildfires and brush/waste burning; industrial sources; windblown dust<br />
from open lands; and atmospheric chemical and photochemical reactions. PM 2.5<br />
results from fuel combustion (from motor vehicles, power generation, and<br />
industrial facilities), residential fireplaces, and wood stoves. In addition, PM 2.5 can<br />
be formed in the atmosphere from gases, such as SO 2 , NO X , and VOC.<br />
• Nitrogen Dioxide, like ozone is not directly emitted into the atmosphere, but is<br />
formed by an atmospheric chemical reaction between nitric oxide (NO) and<br />
atmospheric oxygen. NO and NO 2 are collectively referred to as nitrogen oxides<br />
(NO X ) and are major contributors to ozone formation. Nitrogen oxides are<br />
commonly produced by the combustion <strong>of</strong> fossil fuels, such as in internal<br />
combustion engines (both gasoline- and diesel-powered), as well as point sources,<br />
especially power plants. Of the seven types <strong>of</strong> nitrogen oxide compounds, NO 2 is<br />
the most abundant in the atmosphere. As ambient concentrations <strong>of</strong> NO 2 are<br />
related to traffic density, commuters in heavy traffic may be exposed to higher<br />
concentrations <strong>of</strong> NO 2 than those indicated by regional monitors.<br />
• Sulfur Dioxide enters the atmosphere as a pollutant mainly as a result <strong>of</strong> burning<br />
high sulfur-content fuel oils and coal and from chemical processes occurring at<br />
chemical plants and refineries. When sulfur dioxide oxidizes in the atmosphere, it<br />
forms sulfates (SO 4 ). Together, these pollutants are referred to as sulfur oxides<br />
(SO X ).<br />
• Lead occurs in the atmosphere as particulate matter. The combustion <strong>of</strong> leaded<br />
gasoline is the primary source <strong>of</strong> airborne lead in the Basin. The use <strong>of</strong> leaded<br />
gasoline is no longer permitted for on-road motor vehicles so most such<br />
combustion emissions are associated with <strong>of</strong>f-road vehicles such as racecars. Other<br />
sources <strong>of</strong> lead include the manufacturing and recycling <strong>of</strong> batteries, paint, ink,<br />
ceramics, ammunition, and secondary lead smelters.<br />
• Toxic Air Contaminants refer to a diverse group <strong>of</strong> air pollutants that are capable <strong>of</strong><br />
causing chronic (i.e., <strong>of</strong> long duration) and acute (i.e., severe but <strong>of</strong> short duration)<br />
adverse effects on human health. They include both organic and inorganic chemical<br />
substances that may be emitted from a variety <strong>of</strong> common sources, including<br />
gasoline stations, motor vehicles, dry cleaners, industrial operations, painting<br />
operations, and research and teaching facilities. TACs are different than “criteria<br />
pollutants” in that ambient air quality standards have not been established for<br />
TACs, largely because there are hundreds <strong>of</strong> air toxics and their effects on health<br />
tend to be localized rather than regional.<br />
Health Effects <strong>of</strong> Pollutants<br />
Exposure to air pollution causes a variety <strong>of</strong> health issues. Some air pollutants result in<br />
chronic (i.e., <strong>of</strong> long duration) or acute (i.e., severe but <strong>of</strong> short duration). In some cases,<br />
5.6-6<br />
<strong>City</strong> <strong>of</strong> <strong>Inglewood</strong> <strong>General</strong> <strong>Plan</strong> <strong>Update</strong> Technical Background Report
5.6 Air Quality<br />
exposure to air pollution may cause cancer. The health effects <strong>of</strong> the criteria pollutants, as<br />
well as TACs, are briefly described below.<br />
• Ozone can cause numerous health effects. It interferes with lung function and can<br />
cause pain and discomfort at low concentrations. Health effects <strong>of</strong> ozone include<br />
chest pain, coughing, wheezing, pulmonary and nasal congestion, and labored<br />
breathing. Studies have also linked O 3 exposure to reduced resistance to infections.<br />
• Carbon Monoxide competes with oxygen, <strong>of</strong>ten replacing it in the blood, thus<br />
reducing the blood’s ability to transport oxygen to vital organs. The results <strong>of</strong><br />
excess CO exposure can be dizziness, fatigue, and impairment to central nervous<br />
system functions.<br />
• Suspended Particulate Matter (PM 10 and PM 2.5 ) pose a greater health risk than largersize<br />
particles. When inhaled, these tiny particles can penetrate the human<br />
respiratory system’s natural defenses and damage the respiratory tract. PM 10 and<br />
PM 2.5 can increase the number and severity <strong>of</strong> asthma attacks, cause or aggravate<br />
bronchitis and other lung diseases, and reduce the body’s ability to fight infections.<br />
Very small particles <strong>of</strong> substances, such as lead, sulfates, and nitrates can cause lung<br />
damage directly. These substances can be absorbed into the blood stream and cause<br />
damage elsewhere in the body. These substances can transport absorbed gases,<br />
such as chlorides or ammonium, into the lungs and cause injury. Whereas, particles<br />
2.5 to 10 microns in diameter tend to collect in the upper portion <strong>of</strong> the respiratory<br />
system, particles 2.5 microns or less are so tiny that they can penetrate deeper into<br />
the lungs and damage lung tissues.<br />
• Nitrogen Dioxide acts mainly as an irritant affecting the mucosa <strong>of</strong> the eyes, nose,<br />
throat, and respiratory tract. Extremely high-dose exposure (as in a building fire) to<br />
NO 2 may result in pulmonary edema and diffuse lung injury. Continued exposure<br />
to high NO 2 levels can contribute to the development <strong>of</strong> acute or chronic<br />
bronchitis. Low-level NO 2 exposure may cause increased bronchial reactivity in<br />
some asthmatics, decreased lung function in patients with chronic obstructive<br />
pulmonary disease and increased risk <strong>of</strong> respiratory infections, especially in young<br />
children.<br />
• Sulfur Dioxide is an irritant gas that can affect the respiratory system, the functions<br />
<strong>of</strong> the lungs, and irritate our eyes. When sulfur dioxide irritates the respiratory tract<br />
it causes coughing, mucus secretion, aggravates conditions such as asthma and<br />
chronic bronchitis, and makes people more prone to respiratory tract infections.<br />
Sulfur dioxide can attach itself to particles and, if these particles are inhaled, they<br />
can cause more serious effects.<br />
• Lead exposure may result in gastrointestinal disturbances, anemia, kidney disease,<br />
and in severe cases, neuromuscular and neurological dysfunction. Of particular<br />
concern are low-level lead exposures during infancy and childhood. Such exposures<br />
are associated with decrements in neurobehavioral performance including<br />
intelligence quotient performance, psychomotor performance, reaction time, and<br />
growth.<br />
• Toxic Air Contaminant exposure can cause or contribute to cancer or noncancer<br />
health effects such as birth defects, genetic damage, and other adverse health<br />
effects. Effects may be chronic or acute on human health. Acute health effects are<br />
attributable to sudden exposure to high quantities <strong>of</strong> air toxics. These effects<br />
<strong>City</strong> <strong>of</strong> <strong>Inglewood</strong> <strong>General</strong> <strong>Plan</strong> <strong>Update</strong> Technical Background Report<br />
5.6-7
Chapter 5 Environmental Resources<br />
include nausea, skin irritation, respiratory illness, and, in some cases, death. Chronic<br />
health effects result from low-dose, long-term exposure from routine releases <strong>of</strong> air<br />
toxics. The effect <strong>of</strong> major concern for this type <strong>of</strong> exposure is cancer, which<br />
requires a period <strong>of</strong> 10-30 years after exposure to develop.<br />
Existing Regional Air Quality<br />
Ambient concentrations <strong>of</strong> criteria pollutants are used by the United States<br />
Environmental Protection Agency (USEPA) and the California Air Resources Board<br />
(ARB) to assess and classify air quality in each air basin, county, or, in some cases, a<br />
specific urbanized area. The classification is determined by comparing monitoring data<br />
with federal and state standards. If a pollutant concentration in an area is lower than the<br />
standard, the area is classified as an “attainment” area for that pollutant. If the pollutant<br />
exceeds the standard, the area is classified as a “nonattainment” area. Exceedances that<br />
are affected by highly irregular or infrequent events (e.g., uncontrolled fires) are not<br />
considered violations <strong>of</strong> standards. If there are not enough data available to determine<br />
whether the standard is exceeded in the area, the area is designated as “unclassified.” An<br />
air basin classified as a “nonattainment” area for a certain pollutant can file a maintenance<br />
plan with the USEPA if the three-year average concentration in the basin is below the<br />
applicable standards. A maintenance plan demonstrates how an air basin will prevent new<br />
exceedances <strong>of</strong> the standards.<br />
Regarding the national standards, the Basin has been designated as a severe-17<br />
nonattainment area for eight-hour O 3 , meaning that national ambient air quality standards<br />
are not expected to be met for more than 17 years. The Basin is also a nonattainment area<br />
for PM 10 , PM 2.5 , CO and NO 2 . Deadlines for meeting the national standards have been<br />
set as 2021 for eight-hour O 3 and 2006 for PM 10 . As <strong>of</strong> early 2006, it is unclear if the<br />
Basin will meet the PM 10 attainment deadline. The three-year annual PM 10 average is 52<br />
micrograms per meter cubed (µg/m 3 ) and the national standard is 50 µg/m 3 . The<br />
deadline for meeting the PM 2.5 standard has not been set. Regarding CO and NO 2 , the<br />
Basin must achieve attainment by the most expeditious date that can be achieved, but no<br />
later than five years from the date the area was designated nonattainment. If the Basin<br />
experiences difficulty doing so, the USEPA may extend the period for attainment by an<br />
additional ten years.<br />
Regarding the state standards, the Basin is a nonattainment area for 1-hour O 3 , PM 10 , and<br />
PM 2.5 . Even though the Basin is in nonattainment for several pollutants, regional air<br />
quality throughout the Basin has improved over the last few decades as technological<br />
advancements in pollution controls have <strong>of</strong>fset population growth.<br />
Existing Local Air Quality<br />
The SCAQMD divides the Basin into source receptor areas (SRAs) in which monitoring<br />
stations operate to monitor the various concentrations <strong>of</strong> air pollutants in the Basin.<br />
Pollutant levels vary widely at each SRA depending on the location and time <strong>of</strong> year. The<br />
highest levels <strong>of</strong> O 3 and PM 10 are generally recorded in SRAs in the interior valleys during<br />
5.6-8<br />
<strong>City</strong> <strong>of</strong> <strong>Inglewood</strong> <strong>General</strong> <strong>Plan</strong> <strong>Update</strong> Technical Background Report
5.6 Air Quality<br />
warm, stable periods in the summer and autumn. PM 10 can be generated in large amounts<br />
by construction activity, especially activities that involve grading <strong>of</strong> land. CO<br />
concentrations are highest near heavy traffic areas near large business districts or on<br />
freeways.<br />
The <strong>City</strong> <strong>of</strong> <strong>Inglewood</strong> is located within SRA 3, which covers the southwest Los Angeles<br />
County coastal area. Air quality for SRA 3 is measured at the Hawthorne Monitoring<br />
Station. Criteria pollutants monitored at the Hawthorne Monitoring Station include O 3 ,<br />
CO, PM 10 , NO 2 , and SO 2 . The nearest, most representative monitoring station for PM 2.5<br />
is the Lynwood Monitoring Station, located within SRA 12 (South Central Los Angeles<br />
County). The most recent data available for the Hawthorne and Lynwood Monitoring<br />
Stations encompasses up to year 2005. Table 5.6-1 identifies the national and state<br />
ambient air quality standards for air pollutants along with the ambient pollutant<br />
concentrations that have been measured at the Hawthorne and Lynwood Monitoring<br />
Stations from 2003 to 2005.<br />
Table 5.6-1<br />
Summary <strong>of</strong> Ambient Air Quality Data<br />
Year<br />
Air Pollutants 2003 2004 2005<br />
Ozone (O3)<br />
Maximum one-hour concentration<br />
measured<br />
0.11 ppm a 0.12 ppm 0.09 ppm<br />
Number <strong>of</strong> days exceeding state<br />
0.09 ppm one-hour standard<br />
2 4 0<br />
Maximum eight-hour concentration<br />
measured<br />
0.08 ppm 0.10 ppm 0.08 ppm<br />
Number <strong>of</strong> days exceeding national<br />
0.08 ppm eight-hour standard<br />
0 4 0<br />
Carbon Monoxide (CO) b<br />
Maximum one-hour concentration<br />
measured<br />
Number <strong>of</strong> days exceeding national<br />
35 ppm one-hour standard<br />
Number <strong>of</strong> days exceeding state 20<br />
ppm one-hour standard<br />
Maximum eight-hour concentration<br />
measured<br />
Number <strong>of</strong> days exceeding national<br />
9 ppm eight-hour standard<br />
Number <strong>of</strong> days exceeding state 9.0<br />
ppm eight-hour standard<br />
Nitrogen Dioxide (NO2)<br />
Maximum one-hour concentration<br />
measured<br />
Number <strong>of</strong> days exceeding state<br />
0.25 ppm one-hour standard<br />
7 ppm 6 ppm 3 ppm<br />
0 0 0<br />
0 0 0<br />
5.0 ppm 4.4 ppm 2.2 ppm<br />
0 0 0<br />
0 0 0<br />
0.12 ppm 0.09 ppm 0.09 ppm<br />
0 0 0<br />
<strong>City</strong> <strong>of</strong> <strong>Inglewood</strong> <strong>General</strong> <strong>Plan</strong> <strong>Update</strong> Technical Background Report<br />
5.6-9
Chapter 5 Environmental Resources<br />
Table 5.6-1<br />
Summary <strong>of</strong> Ambient Air Quality Data<br />
Year<br />
Air Pollutants 2003 2004 2005<br />
Sulfur Dioxide (SO2)<br />
Maximum 24-hour concentration<br />
measured<br />
Number <strong>of</strong> days exceeding state<br />
0.04 ppm 24-hour standard<br />
Particulate Matter (PM10)<br />
Maximum 24-hour concentration<br />
measured<br />
Number <strong>of</strong> days exceeding national<br />
150 µg/m 3 24-hour standard<br />
Number <strong>of</strong> days exceeding state 50<br />
µg/m 3 24-hour standard<br />
0.006 ppm 0.007 ppm 0.011 ppm<br />
0 0 0<br />
58 µg/m 3 c 52 µg/m 3 N/A d<br />
0 0 N/A<br />
3 2 N/A<br />
Particulate Matter (PM2.5)<br />
Maximum 24-hour concentration<br />
measured<br />
55 µg/m 3 56 µg/m 3 N/A<br />
Number <strong>of</strong> days exceeding national<br />
65 µg/m 3 24-hour standard<br />
0 0 N/A<br />
SOURCE: South Coast Air Quality Management District, 2006<br />
a ppm = parts by volume per million <strong>of</strong> air<br />
b Neither the California Air Resources Board nor the South Coast Air Quality Management District collect carbon<br />
monoxide data for the one-hour period.<br />
c µg/m 3 = micrograms per cubic meter<br />
d N/A = not available<br />
The ARB also collects emissions data and compiles them into inventories by county.<br />
These annual emission inventories show which sources are the biggest emission<br />
contributors and assist in air quality planning activities. A summary <strong>of</strong> the most recent<br />
annual emission inventory for Los Angeles County is shown in Table 5.6-2. Mobile<br />
sources account for the majority <strong>of</strong> criteria pollutant emissions in the County with the<br />
exception <strong>of</strong> PM 10 . In the <strong>City</strong> <strong>of</strong> <strong>Inglewood</strong>, emissions <strong>of</strong> criteria pollutants would follow<br />
the same general pattern as the rest <strong>of</strong> Los Angeles County with the emission inventory<br />
being dominated by area and mobile sources. Emissions generated within the jurisdiction<br />
<strong>of</strong> <strong>City</strong> <strong>of</strong> <strong>Inglewood</strong> would be only a small portion <strong>of</strong> the County’s overall emission<br />
inventory.<br />
Table 5.6-2<br />
2004 Estimated Annual Emissions Summary for Los Angeles<br />
County (tons/day)<br />
Source Category VOC CO NOX PM10 SOX<br />
Stationary Sources 95 69 49 15 24<br />
Area-Wide Sources 107 84 20 139
5.6 Air Quality<br />
The most congested roadway segments in the <strong>City</strong> <strong>of</strong> <strong>Inglewood</strong>—those that experience<br />
very high traffic volumes and low levels <strong>of</strong> service during peak hours—could potentially<br />
create CO “hotspots” where the ambient air quality standards for CO are temporarily<br />
exceeded. Any hotspots would have the potential to adversely affect nearby sensitive uses.<br />
CO concentrations were estimated at various roadway segments throughout the <strong>City</strong> that<br />
currently contain high traffic volumes. CO concentration estimates were based on<br />
existing Year 2005 traffic volumes. The protocol recommended by the California<br />
Department <strong>of</strong> Transportation (Caltrans) and published in the Transportation Project-Level<br />
Carbon Monoxide Protocol (1997) were used when estimating CO concentrations. It is also<br />
consistent with procedures identified through the SCAQMD’s CO modeling protocol in<br />
the CEQA Air Quality Handbook. Traffic CO contributions were estimated using the<br />
Caltrans CALINE4 dispersion model.<br />
Existing CO concentrations at the analyzed roadway segments are shown in Table 5.6-3.<br />
Presently, none <strong>of</strong> the roadway segments analyzed exceed the State one-hour and eighthour<br />
CO standards <strong>of</strong> 20.0 ppm and 9.0 ppm, respectively. The State one-hour and eighthour<br />
CO standards are more stringent than the National one-hour and eight-hour CO<br />
standards.<br />
In addition to surface streets, existing CO concentrations generated by traffic traveling on<br />
Interstate 405 and Interstate 105 were estimated at residences nearest to the respective<br />
freeway. Traffic volumes were obtained from the California Department <strong>of</strong><br />
Transportation. 88 As shown in Table 5.6-3, one-hour and eight-hour CO concentrations<br />
along Interstate 405 are approximately 11.6 and 8.2, respectively. One-hour and eighthour<br />
CO concentrations along Interstate 105 are approximately 10.9 and 7.7, respectively.<br />
CO levels generated by traffic traveling Interstate 405 and Interstate 105 do not exceed<br />
the State one-hour and eight-hour CO standards <strong>of</strong> 20.0 ppm and 9.0 ppm, respectively,<br />
at the nearest sensitive receptor.<br />
Existing Toxic Air Contaminants<br />
Toxic air contaminants are airborne substances that are capable <strong>of</strong> causing chronic and<br />
acute adverse effects on human health. They include both organic and inorganic chemical<br />
substances that may be emitted from a variety <strong>of</strong> common sources, including gasoline<br />
stations, motor vehicles, dry cleaners, industrial operations, painting operations, and<br />
research and teaching facilities. TACs are different than the “criteria pollutants“<br />
previously discussed in that ambient air quality standards have not been established for<br />
them; this is primarily due to the large number <strong>of</strong> air toxics and the localized nature <strong>of</strong> the<br />
adverse health impacts caused by TAC emissions. TACs are typically <strong>of</strong> greatest concern<br />
near facilities that store or use toxic compounds. Mostly, sources such as those described<br />
above are generated from manufacturing and industrial uses.<br />
88 The most recent freeway counts from the California Department <strong>of</strong> Transportation were for Year 2004.<br />
A three percent growth rate was added to the freeway traffic volumes to obtain Year 2005 traffic volumes.<br />
<strong>City</strong> <strong>of</strong> <strong>Inglewood</strong> <strong>General</strong> <strong>Plan</strong> <strong>Update</strong> Technical Background Report<br />
5.6-11
Chapter 5 Environmental Resources<br />
Table 5.6-3<br />
Existing Carbon Monoxide Concentrations<br />
Parts Per Million<br />
Roadway Segment One-hour Eight-hour<br />
La Cienega Blvd between Slauson Ave and Fairview Blvd 10.8 6.8<br />
La Cienega Blvd between Centinela Avenue and Interstate 405 Ramps 10.9 6.7<br />
La Cienega Blvd between Interstate 405 Ramps and Florence Ave 7.6 5.4<br />
La Cienega Blvd between Arbor Vitae St and Century Blvd 8.8 5.8<br />
Prairie Ave between Florence Ave and Regent St 9.6 6.1<br />
Prairie Ave between Regent St Manchester Blvd 9.9 6.2<br />
Prairie Ave between Manchester Blvd and 90 th St 9.1 6.1<br />
Prairie Ave between 90 th St and Arbor Vitae St 9.2 6.1<br />
Prairie Ave between Arbor Vitae Street and Century Blvd 9.1 6.0<br />
Prairie Ave between Century Blvd and 108 th St 9.7 6.2<br />
Prairie Ave between 108 th St and Imperial Hwy 9.7 6.2<br />
Crenshaw Blvd between Crenshaw Dr and 8 th Ave 9.7 6.3<br />
Crenshaw Blvd between Manchester Blvd and 90 th St 9.5 6.1<br />
Crenshaw Blvd between 90 th St and Arbor Vitae St 10.0 6.3<br />
Crenshaw Blvd between Arbor Vitae St and Century Blvd 9.7 6.2<br />
Crenshaw Blvd between Century Blvd and 108 th St 10.4 6.4<br />
Centinela Ave between La Cienega Blvd and Beach Ave 9.5 6.1<br />
Centinela Ave between Beach Ave and La Brea Ave 9.4 6.1<br />
Centinela Ave between La Brea Ave and Hyde Park Blvd 9.6 6.1<br />
Centinela Ave between Hyde Park Blvd and Florence Ave 9.1 5.9<br />
Florence Ave between La Cienega Blvd and Eucalyptus Ave 9.4 6.0<br />
Florence Ave between La Brea Ave and Prairie Ave 9.3 6.0<br />
Manchester Blvd between La Cienega Blvd and <strong>Inglewood</strong> Ave 9.5 6.2<br />
Manchester Blvd between La Brea Avenue and Prairie Ave 9.4 6.1<br />
Manchester Blvd between Prairie Ave and Crenshaw Dr 9.5 6.1<br />
Manchester Blvd between Crenshaw Dr and Crenshaw Blvd 9.6 6.1<br />
Century Blvd between La Cienega Blvd and <strong>Inglewood</strong> Ave 9.6 6.1<br />
Century Blvd between Hawthorne Blvd and Prairie Ave 9.1 6.0<br />
Century Blvd between Crenshaw Blvd and Van Ness Ave 9.1 6.0<br />
Imperial Hwy between Prairie Ave and Yukon Ave 9.5 6.1<br />
Imperial Hwy between Yukon Ave and Crenshaw Blvd 9.4 6.1<br />
Imperial Hwy between Crenshaw Blvd and Van Ness Ave 9.2 6.0<br />
Interstate 405 from Manchester Blvd to Century Blvd 11.6 8.2<br />
Interstate 105, west <strong>of</strong> Crenshaw Blvd 10.9 7.7<br />
State Standard 20 9.0<br />
SOURCE: TAHA, 2006<br />
a All concentrations include one- and eight-hour ambient concentrations <strong>of</strong> 7.0 and 5.0, respectively.<br />
Sources <strong>of</strong> TACs that may create an unacceptable cancer risk must prepare a health risk<br />
assessment (HRA) and mitigate their TAC emissions. The most recent list <strong>of</strong> sources<br />
subject to the HRA requirement published by SCAQMD shows that one source within<br />
5.6-12<br />
<strong>City</strong> <strong>of</strong> <strong>Inglewood</strong> <strong>General</strong> <strong>Plan</strong> <strong>Update</strong> Technical Background Report
5.6 Air Quality<br />
the <strong>City</strong> <strong>of</strong> <strong>Inglewood</strong> (Plains Exploration and Production Company) had to prepare an<br />
HRA. 89<br />
The ARB also has identified diesel particulate matter as a TAC. Diesel particulate matter<br />
is generated from the burning <strong>of</strong> diesel fuel. Consequently, sources, such as truck-stops,<br />
rail yards, loading docks or other places, where large numbers <strong>of</strong> diesel vehicles may<br />
congregate may present a health hazard.<br />
Lifetime cancer risk is defined as the increased chance <strong>of</strong> contracting cancer over a<br />
70-year period as a result <strong>of</strong> exposure to a toxic substance or substances. It is the product<br />
<strong>of</strong> the estimated daily exposure <strong>of</strong> each suspected carcinogen by its respective cancer unit<br />
risk. The end result represents a worst-case estimate <strong>of</strong> cancer risk. ARB has produced a<br />
series <strong>of</strong> estimated inhalation cancer risk maps based on modeled levels <strong>of</strong> outdoor<br />
airborne toxic pollutant levels. The most recent map, generated for 2001, indicates that<br />
cancer risk in the <strong>City</strong> <strong>of</strong> <strong>Inglewood</strong> ranges from 500 persons per million to 750 persons<br />
per million. The largest contributor to this inhalation cancer risk is the emission from<br />
diesel engines. This cancer risk is lower than the average cancer risk over the entire Basin<br />
(1,400 in one million), as presented in the SCAQMD Multiple Air Toxics Exposure Study<br />
(MATES-II).<br />
MATES-II<br />
The SCAQMD MATES-II study, which was published in 2000, investigated region-wide<br />
cancer risk. In particular, this study served to quantify the current magnitude <strong>of</strong><br />
population exposure risk from existing sources <strong>of</strong> selected TACs. The MATES-II study<br />
estimates the current average lifetime carcinogenic risk to be 1,400 in one million in the<br />
Basin. Mobile sources (e.g., cars, trucks, trains, ships, aircraft, etc.) represent the greatest<br />
contributor. According to the MATES-II study, about 70 percent <strong>of</strong> all risk is attributed<br />
to diesel exhaust particulate emissions; about 20 percent to other toxics associated with<br />
mobile sources (including benzene, butadiene, and formaldehyde); and about ten percent<br />
<strong>of</strong> all risk is attributed to stationary sources (which include industries and certain other<br />
businesses such as dry cleaners and chrome plating operations). In addition, the<br />
differences in carcinogenic risk from one site to another within the Basin are much more<br />
driven by the influence from mobile sources than from stationary sources. The levels <strong>of</strong><br />
TACs associated with mobile sources are also subject to strong seasonal variations, with<br />
elemental carbon (a surrogate for diesel particulates), benzene, and butadiene having<br />
seasonal peaks in the late fall and winter months, while the lowest levels <strong>of</strong> these TACs<br />
are observed during the spring and summer months.<br />
Stationary sources that potentially emit TACs are regulated through performance<br />
standards and emission limitations in federal and SCAQMD regulations. Past efforts for<br />
regulating mobile sources <strong>of</strong> toxic air contaminants have provided substantial control <strong>of</strong><br />
lead emissions. Diesel exhaust particulates have more recently been identified as a TAC.<br />
89<br />
SCAQMD, Annual Report on AB 2588 Air Toxics “Hot Spots” Program, March 2005.<br />
<strong>City</strong> <strong>of</strong> <strong>Inglewood</strong> <strong>General</strong> <strong>Plan</strong> <strong>Update</strong> Technical Background Report<br />
5.6-13
Chapter 5 Environmental Resources<br />
Improvement <strong>of</strong> fuel efficiency and reformulation <strong>of</strong> fuels have in the past provided<br />
indirect control for TACs from mobile sources. Strategies adopted by ARB in 2000<br />
provide a framework for future control <strong>of</strong> diesel exhaust particulates from stationary and<br />
mobile sources (ARB, 2000).<br />
Sensitive Receptors<br />
Sensitive receptors are certain members <strong>of</strong> the population that are more susceptible to the<br />
effects <strong>of</strong> air pollution than the general population. While the ambient air quality<br />
standards are designed to protect public health and are generally regarded as conservative<br />
for healthy adults, there is greater concern to protect adults who are ill or have long-term<br />
respiratory problems and young children whose lungs are not fully developed. According<br />
to ARB, sensitive receptors include children less than 14 years <strong>of</strong> age, the elderly over 65<br />
years <strong>of</strong> age, athletes, and people with cardiovascular and chronic respiratory diseases.<br />
The SCAQMD CEQA Air Quality Handbook identifies the following as locations that may<br />
contain a high concentration <strong>of</strong> sensitive receptors: long-term health care facilities,<br />
rehabilitation centers, convalescent centers, retirement homes, residences, schools,<br />
playgrounds, child care centers, and athletic facilities.<br />
The <strong>City</strong> <strong>of</strong> <strong>Inglewood</strong> contains a number <strong>of</strong> each <strong>of</strong> these different land uses, including<br />
hospitals, libraries, retirement homes, parks and recreational facilities, public and private<br />
schools, religious institutions, and childcare facilities.<br />
Land Use <strong>Plan</strong>ning and Air Quality<br />
The land use pattern and density <strong>of</strong> development affects the amount <strong>of</strong> air pollutants that<br />
are generated in communities. Land uses that are segregated throughout a community<br />
increase the number <strong>of</strong> motor vehicle trips and associated air pollutant emissions since<br />
opportunities to walk, ride bicycles, and use public transportation between such uses as<br />
homes and work/shopping are reduced. High-density communities <strong>of</strong>ten mix residential<br />
uses with, or very near, commercial, business, and employment uses, thus reducing<br />
people’s reliance on motor vehicle use or reducing the distance <strong>of</strong> necessary vehicle trips.<br />
High-density uses also produce less air emissions on a per unit basis from the use <strong>of</strong><br />
natural gas for space and water heating. The <strong>City</strong> <strong>of</strong> <strong>Inglewood</strong> is a fully built-out<br />
urbanized community. The northwestern portion <strong>of</strong> the <strong>City</strong> near the intersection <strong>of</strong><br />
Florence Avenue and La Brea Avenue contains a mixture <strong>of</strong> land uses (i.e., commercial,<br />
residential, and <strong>of</strong>fice) that are located in close proximity to each other. Other <strong>City</strong> areas,<br />
especially the southern and eastern portions, are primarily residential. As such, the<br />
majority <strong>of</strong> residences located within the <strong>City</strong> are likely to drive to reach their places <strong>of</strong><br />
employment and to run daily errands.<br />
• Regulatory Setting<br />
The federal Clean Air Act (CAA) governs air quality in the United States. In addition to<br />
being subject to the requirements <strong>of</strong> CAA, air quality in California is also governed by<br />
more stringent regulations under the California Clean Air Act (CCAA). At the federal<br />
5.6-14<br />
<strong>City</strong> <strong>of</strong> <strong>Inglewood</strong> <strong>General</strong> <strong>Plan</strong> <strong>Update</strong> Technical Background Report
5.6 Air Quality<br />
level, CAA is administered by USEPA. In California, the CAA and CCAA is administered<br />
by ARB at the state level and by the Air Quality Management Districts at the regional<br />
level. At the local level, cities work with Air Quality Management Districts to facilitate the<br />
implementation <strong>of</strong> control measures that were developed by the Air Quality Management<br />
Districts. These agencies work jointly, as well as individually, to improve air quality<br />
through legislation, regulations, planning, policy-making, education, and a variety <strong>of</strong><br />
programs. The agencies responsible for improving air quality within the Basin are<br />
discussed below.<br />
Federal<br />
U.S. Environmental Protection Agency<br />
The USEPA is responsible for setting and enforcing the National Ambient Air Quality<br />
Standards for atmospheric pollutants. It regulates emission sources that are under the<br />
exclusive authority <strong>of</strong> the federal government, such as aircraft, ships, and certain<br />
locomotives.<br />
As part <strong>of</strong> its enforcement responsibilities, USEPA requires each state with federal<br />
nonattainment areas to prepare and submit a State Implementation <strong>Plan</strong> (SIP) that<br />
demonstrates how the federal standards will be met. The SIP must integrate federal, state,<br />
and local plan components and regulations to identify specific measures to reduce<br />
pollution, using a combination <strong>of</strong> performance standards and market-based programs<br />
within the timeframe identified in the SIP.<br />
State<br />
California Air Resources Board<br />
The ARB, a part <strong>of</strong> the California Environmental Protection Agency, is responsible for<br />
the coordination and administration <strong>of</strong> both federal and state air pollution control<br />
programs within California. In this capacity, ARB conducts research, sets California<br />
Ambient Air Quality Standards, compiles emission inventories, develops suggested<br />
control measures, provides oversight <strong>of</strong> local programs, and prepares the SIP. ARB<br />
establishes emissions standards for motor vehicles sold in California, consumer products<br />
(e.g., hair spray, aerosol paints, and charcoal lighter fluid), and various types <strong>of</strong><br />
commercial equipment. It also sets fuel specifications to reduce vehicular emissions.<br />
Regional<br />
South Coast Air Quality Management District<br />
The SCAQMD is the agency principally responsible for comprehensive air pollution<br />
control in the Basin. To that end, SCAQMD, a regional agency, works directly with the<br />
Southern California Association <strong>of</strong> Governments (SCAG), county transportation<br />
commissions, and local governments and cooperates actively with all federal and state<br />
government agencies. SCAQMD develops rules and regulations, establishes permitting<br />
<strong>City</strong> <strong>of</strong> <strong>Inglewood</strong> <strong>General</strong> <strong>Plan</strong> <strong>Update</strong> Technical Background Report<br />
5.6-15
Chapter 5 Environmental Resources<br />
requirements for stationary sources, inspects emission sources, and enforces such<br />
measures through educational programs or fines, when necessary.<br />
The SCAQMD is directly responsible for reducing emissions from stationary (area and<br />
point), mobile, and indirect sources. It has responded to this requirement by preparing a<br />
sequence <strong>of</strong> AQMPs. The most recent <strong>of</strong> these was adopted by the Governing Board <strong>of</strong><br />
the SCAQMD on August 1, 2003, which updates and revises the previous 1997 AQMP.<br />
This AQMP, referred to as the 2003 AQMP, was prepared to comply with the CAA,<br />
CCAA, and its amendments, to accommodate growth, to reduce the high pollutant levels<br />
in the Basin, to meet federal and state ambient air quality standards, and to minimize the<br />
fiscal impact that pollution control measures have on the local economy. The purpose <strong>of</strong><br />
the 2003 AQMP for the Basin is to set forth a comprehensive program that will lead this<br />
area into compliance with all federal and state air quality planning requirements.<br />
Compared with the 1997 AQMP, the 2003 AQMP utilizes revised emissions inventory<br />
projections that use 1997 as the base year, the ARB on-road motor vehicle emissions<br />
model EMFAC2002, and SCAG 2001 Regional Transportation <strong>Plan</strong> (RTP) forecast<br />
assumptions; updates the attainment demonstration for the federal standards for O 3 and<br />
PM 10 ; replaces the 1997 attainment demonstration for the federal CO standard and<br />
provides a basis for a maintenance plan for CO for the future; and updates the<br />
maintenance plan for the federal NO 2 standard that the Basin has met since 1992. In<br />
terms <strong>of</strong> working towards ozone attainment, the 2003 AQMP builds upon the 1997<br />
AQMP and 1999 Amendments to the Ozone SIP. In terms <strong>of</strong> PM 10 attainment, the PM 10<br />
control strategy in the 1997 AQMP has been augmented by a number <strong>of</strong> additional PM 10<br />
control measures.<br />
The 2003 AQMP also addresses several federal and state planning requirements and<br />
incorporates significant new scientific data, primarily in the form <strong>of</strong> updated emissions<br />
inventories, ambient measurements, new meteorological episodes, and new air quality<br />
modeling tools. Specifically, the 2003 AQMP is designed to satisfy the CCAA tri-annual<br />
update requirements and fulfill the District’s commitment to update transportation<br />
emission budgets based on the latest approved motor vehicle emissions model and<br />
planning assumptions.<br />
The 2003 AQMP control measures consist <strong>of</strong> (1) the SCAQMD’s stationary and mobile<br />
source control measures, (2) state control measures proposed by the ARB, and<br />
(3) transportation control measures provided by SCAG. Overall, 28 stationary and<br />
21 mobile source measures are defined under the 2003 AQMP. These measures primarily<br />
rely on the traditional command-and-control approach facilitated by market incentive<br />
programs, as well as advanced technologies expected to be implemented by 2010. The<br />
proposed control measures in the 2003 AQMP are based on implementation <strong>of</strong> all<br />
feasible control measures through the application <strong>of</strong> available technologies and<br />
management practices as well as advanced technologies and control methods.<br />
The basic principles used in designing the District’s control strategy were to (1) meet at<br />
least the same overall remaining emissions target committed to in the 1997/1999 SIP;<br />
5.6-16<br />
<strong>City</strong> <strong>of</strong> <strong>Inglewood</strong> <strong>General</strong> <strong>Plan</strong> <strong>Update</strong> Technical Background Report
5.6 Air Quality<br />
(2) replace long-term measures with more specific near-term measures, where feasible,<br />
and (3) develop new short-term control measures and long-term strategies to achieve the<br />
needed reductions for attainment demonstration. Principle control measures <strong>of</strong> the 2003<br />
AQMP focus on adoption <strong>of</strong> new regulations or enhancement <strong>of</strong> existing 1997 AQMP<br />
regulations for stationary sources and implementation/facilitation <strong>of</strong> advanced<br />
transportation technologies (i.e., zero emission and alternative-fueled vehicles and<br />
infrastructure, fuel cell vehicles, heavy-duty electric and hybrid-electric vehicles, and both<br />
capital and non-capital transportation improvements). Capital improvements consist <strong>of</strong><br />
high occupancy vehicle lanes; transit improvements; traffic flow improvements; park-andride<br />
and intermodal facilities; and urban freeway, bicycle, and pedestrian facilities. Noncapital<br />
improvements consist <strong>of</strong> rideshare matching and transportation demand<br />
management activities derived from the congestion management program.<br />
Southern California Association <strong>of</strong> Governments<br />
The SCAG is a council <strong>of</strong> governments for Imperial, Los Angeles, Orange, Riverside, San<br />
Bernardino, and Ventura Counties. SCAG is a regional planning agency that serves as a<br />
forum for regional issues relating to transportation, the economy and community<br />
development, and the environment. SCAG is responsible for developing transportation,<br />
land use, and energy conservation policies for its members. These policies <strong>of</strong>ten affect air<br />
quality emissions within the Basin. The organization promotes carpools, buses, trains, and<br />
other alternative forms <strong>of</strong> transportation throughout the region.<br />
SCAG’s Regional Comprehensive <strong>Plan</strong> and Guide (RCPG) provides growth forecasts<br />
that are used in the development <strong>of</strong> air quality-related land use and transportation control<br />
strategies by SCAQMD. The RCPG is a framework for decision-making for local<br />
governments, assisting them in meeting federal and state mandates for growth<br />
management, mobility, and environmental standards, while maintaining consistency with<br />
regional goals regarding growth and changes for the future.<br />
Local<br />
<strong>City</strong> <strong>of</strong> <strong>Inglewood</strong><br />
Local jurisdictions, such as the <strong>City</strong> <strong>of</strong> <strong>Inglewood</strong>, have the shared responsibility to<br />
implement or facilitate some <strong>of</strong> the control measures <strong>of</strong> the AQMP. Transportationrelated<br />
strategies for congestion management, low emission vehicle infrastructure, and<br />
transit accessibility and nontransportation-related strategies for energy conservation can<br />
be encouraged by local policies. A summary <strong>of</strong> the AQMP measures that are partially<br />
within the jurisdiction <strong>of</strong> local governments to implement is provided in Table 5.6-4.<br />
<strong>City</strong> <strong>of</strong> <strong>Inglewood</strong> <strong>General</strong> <strong>Plan</strong> <strong>Update</strong> Technical Background Report<br />
5.6-17
Chapter 5 Environmental Resources<br />
Table 5.6-4<br />
AQMP Control Strategies for Local Governments<br />
AQMP Strategy Name<br />
Miscellaneous Sources<br />
Promotion <strong>of</strong> Lighter Colored Ro<strong>of</strong>ing and Road<br />
MSC-01<br />
Materials and Tree <strong>Plan</strong>ting Programs<br />
Effect<br />
Energy Conservation<br />
Transportation Strategies<br />
TCM-A High Occupancy Vehicle (HOV) Improvements Trip Reduction<br />
TCM-B Transit & Systems Management Trip Reduction<br />
TCM-C Information Based Measures Trip Reduction<br />
SOURCE: South Coast Air Quality Management District, 2003 Air Quality Management <strong>Plan</strong>, 2003<br />
• Issues<br />
• The <strong>City</strong> lacks planning programs that reduce the length and or number <strong>of</strong> vehicle<br />
trips and encourage residents to work locally, rideshare, telecommute, or use<br />
alternative forms <strong>of</strong> transportation.<br />
• The <strong>City</strong> lacks policies that discourage sensitive receptors near Interstates 405 and<br />
105.<br />
• References<br />
California Air Resources Board (ARB). 2000. Risk Reduction <strong>Plan</strong> to Reduce Particulate<br />
Matter Emissions from Diesel-Fueled Engines and Vehicles, October.<br />
———. 2004. Air Quality Maps: Estimated Cancer Risk from Air Toxics—2001 Map<br />
Information. ARB Website: http://www.arb.ca.gov/toxics/cti/hlthrisk/cncrinhl/<br />
rskmapvwtrend.htm, accessed February 2006.<br />
California Department <strong>of</strong> Transportation. 2006. Traffic and Vehicle Data Systems Unit.<br />
California Department <strong>of</strong> Transportation Website: http://www.dot.ca.gov/<br />
hq/traffops/saferesr/trafdata/, accessed May 2006.<br />
South Coast Air Quality Management District (SCAQMD). 1993. CEQA Air Quality<br />
Handbook.<br />
———. 2000. Multiple Air Toxics Exposure Study in the South Coast Air Basin<br />
(MATES-II).<br />
———. 2003. 2003 Air Quality Management <strong>Plan</strong>.<br />
———. 2005. Annual Report on AB 2588 Air Toxics “Hot Spots” Program, March.<br />
———. 2006. Historical Air Quality Data. SCAQMD Website: http://www.aqmd.<br />
gov/smog/historicaldata.htm, accessed April 2006.<br />
———. 2006. Meteorological Data for Lennox. SCAQMD Website:http://www.<br />
aqmd.gov/smog/metdata/MeteorologicalData.html, accessed April 2006.<br />
Western Regional Climate Center. 2006. Historical Climate Data. Western Regional<br />
Climate Center Website: http://www.wrcc.dri.edu, accessed April 2006.<br />
5.6-18<br />
<strong>City</strong> <strong>of</strong> <strong>Inglewood</strong> <strong>General</strong> <strong>Plan</strong> <strong>Update</strong> Technical Background Report
CHAPTER 6<br />
Community Safety and Hazards<br />
This Chapter describes the existing conditions pertaining to the health and safety <strong>of</strong><br />
<strong>Inglewood</strong>. This Chapter includes the following sections:<br />
• Geology, Soils, and Mineral Resources<br />
• Seismic Hazards<br />
• Flood Hazards<br />
• Fire Hazards<br />
• Hazardous Materials<br />
• Police Services<br />
• Fire Protection<br />
• Emergency Preparedness<br />
• Noise<br />
6.1 GEOLOGY, SOILS, AND MINERAL RESOURCES<br />
This section describes the geologic characteristics and mineral resources <strong>of</strong> the <strong>City</strong> <strong>of</strong><br />
<strong>Inglewood</strong>. In particular it describes conditions pertaining to local geology within the<br />
<strong>City</strong>. The existing regulatory framework relevant to geologic resources is also presented.<br />
This section is based on information from documents provided by the <strong>City</strong> <strong>of</strong> <strong>Inglewood</strong>,<br />
including the 1995 Safety Element and 1997 Conservation Element <strong>of</strong> the <strong>City</strong>’s <strong>General</strong><br />
<strong>Plan</strong>, and the 2003 Renaissance Final Environmental Impact Report. Seismic hazards<br />
including a discussion <strong>of</strong> regional and local faults are presented in Section 6.2 (Seismic<br />
Hazards).<br />
• Existing Conditions<br />
Geology<br />
Prehistory<br />
During the Miocene and Pliocene periods (5 to 25 million years ago) the Los Angeles<br />
Basin and the surrounding mountains were submerged beneath the Pacific Ocean.<br />
However, movement and collision <strong>of</strong> tectonic plates during the Pleistocene (2 million<br />
years ago) elevated much <strong>of</strong> this area above sea level. This seismic activity eventually<br />
created the land forms that exist today.<br />
Local Geology<br />
The <strong>City</strong> <strong>of</strong> <strong>Inglewood</strong> is located within the Los Angeles basin area, in the southwestern<br />
portion <strong>of</strong> the Transverse Ranges geomorphic province and the northern limits <strong>of</strong> the<br />
Peninsular Range geomorphic province. The Transverse Ranges are an east/westtrending<br />
series <strong>of</strong> steep mountain ranges including the Santa Ynez, Santa Monica, San<br />
Gabriel, and San Bernardino from north to south, respectively. Due to intense<br />
north/south compression, the Transverse Range in this region is one <strong>of</strong> the most rapidly<br />
rising areas on earth. The Peninsular Ranges is characterized by northwest and southwest<br />
<strong>City</strong> <strong>of</strong> <strong>Inglewood</strong> <strong>General</strong> <strong>Plan</strong> <strong>Update</strong> Technical Background Report<br />
6.1-1
Chapter 6 Community Safety and Hazards<br />
ranges including the Santa Anna, San Jacinto, and Laguna Mountains in Southern<br />
California. The Santa Monica and Hollywood faults are considered the boundary between<br />
these two geomorphic provinces.<br />
The <strong>City</strong> is underlain by a thick (10,000 to 12,000 feet) section <strong>of</strong> Tertiary and Quaternary<br />
marine and continental sedimentary rocks deposited on an igneous-metamorphic<br />
basement complex within the Los Angeles sedimentary basin. The Tertiary rocks,<br />
consisting primarily <strong>of</strong> sandstone, silt-stone, and shale, are almost entirely <strong>of</strong> marine<br />
origin and range in age from Eocene and Pliocene. The Quaternary rocks consist <strong>of</strong><br />
shallow marine sandstone and siltstone and continental siltstone, mudstone, and gravels.<br />
Mineral Resources<br />
Oil and Gas Production<br />
Within the <strong>City</strong>, oil is the only extractable resource known to exist with the possible<br />
associated presence <strong>of</strong> natural gas. The <strong>City</strong> straddles a line <strong>of</strong> oil deposits that generally<br />
runs southeast to northwest from the Rosecrans Hills to the Baldwin Hills, paralleling the<br />
Newport-<strong>Inglewood</strong> Fault Zone. Oil production, in terms <strong>of</strong> the number <strong>of</strong> wells, was<br />
greater in previous decades although substantial oil extraction still occurs in the Baldwin<br />
Hills. Within the <strong>City</strong>, there is only one remaining active oil well site, the seven-acre Brea<br />
Oil Company site at Eucalyptus Avenue and Hyde Park Boulevard. Previously, a small<br />
site operated in what is now the north parking lot at Hollywood Park. It was closed in<br />
1997.<br />
The oil deposits in this oil field have been reduced after nearly a century <strong>of</strong> oil extraction<br />
but there may be sufficient remaining oil and possibly untapped deposits, for continued<br />
extraction and even new exploratory drilling. Furthermore, oil extraction technology may<br />
make technical advances to permit additional production from previously depleted areas.<br />
Techniques such as the use slant-drilling could allow multiple wells to be consolidated<br />
within smaller, enclosed spaces that do not need to be located directly over the deposits.<br />
• Regulatory Setting<br />
There are no applicable regulations related to geology and soils.<br />
Local<br />
<strong>Inglewood</strong> Municipal Code<br />
The <strong>City</strong> <strong>of</strong> <strong>Inglewood</strong> has a permit-issuance procedure (Special Use Permit) to evaluate<br />
any future oil drilling sites based on their locality, accessibility, and potential impact on<br />
adjacent land uses. Appropriate impact-mitigating conditions <strong>of</strong> development and<br />
operation can be imposed to enable the safe extraction <strong>of</strong> oil within certain areas in the<br />
<strong>City</strong>. Additionally, an Oil Well Permit is issued by the <strong>City</strong> Council for each well within an<br />
approved drilling site. This permit allows the <strong>Inglewood</strong> Fire Department to regulate and<br />
enforce safe operating conditions at each well site.<br />
6.1-2<br />
<strong>City</strong> <strong>of</strong> <strong>Inglewood</strong> <strong>General</strong> <strong>Plan</strong> <strong>Update</strong> Technical Background Report
6.1 Geology, Soils, and Mineral Resources<br />
• Issues<br />
• No issues have been identified related to geologic or mineral resources.<br />
• Glossary<br />
• Alluvial—Pertaining to or composed <strong>of</strong> alluvium, or deposited by a stream or<br />
running water.<br />
• Alluvium—A general term for clay, silt, sand, gravel, or similar unconsolidated<br />
detrital material deposited during comparatively recent geologic time by a stream or<br />
other body <strong>of</strong> running water as a sort or semi-sorted sediment in the bed <strong>of</strong> the<br />
stream or on its flood plain or delta, or as a cone or fan at the base <strong>of</strong> the<br />
mountain.<br />
• Consolidated material—Soil or rocks that have become firm as a result <strong>of</strong><br />
compaction.<br />
• Cretaceous—The period <strong>of</strong> geologic time from 145 to 65 million years ago.<br />
• Eocene—The period <strong>of</strong> geologic time from 58 to 40 million years ago.<br />
• Holocene—a period <strong>of</strong> geologic time since the last ice age in North America,<br />
approximately 11,000 years.<br />
• Miocene—A period <strong>of</strong> geologic time from 24 to 5 million years before the<br />
present.<br />
• Paleocene—A period <strong>of</strong> geologic time from 64 to 58 million years ago.<br />
• Pleistocene—A geologic period which began about 2.0 million years ago and<br />
ended with the melting <strong>of</strong> the large continental glaciers about 11,000 years ago.<br />
• Pliocene—A period <strong>of</strong> geologic time from 5 to 2 million years ago.<br />
• Quaternary—a period <strong>of</strong> geologic time from 2.0 million years to the present.<br />
• References<br />
<strong>Inglewood</strong>, <strong>City</strong> <strong>of</strong>. 1995. Safety Element <strong>of</strong> the <strong>General</strong> <strong>Plan</strong>. July.<br />
<strong>Inglewood</strong>, <strong>City</strong> <strong>of</strong>. 1997. Conservation Element <strong>of</strong> the <strong>General</strong> <strong>Plan</strong>. July.<br />
<strong>Inglewood</strong>, <strong>City</strong> <strong>of</strong>. 2003 The Renaissance Final EIR. November 26.<br />
<strong>City</strong> <strong>of</strong> <strong>Inglewood</strong> <strong>General</strong> <strong>Plan</strong> <strong>Update</strong> Technical Background Report<br />
6.1-3
6.2 Seismic Hazards<br />
6.2 SEISMIC HAZARDS<br />
The <strong>City</strong> <strong>of</strong> <strong>Inglewood</strong> is in a seismically active region <strong>of</strong> Southern California. This<br />
section describes regional faulting, historical seismic activity in the surrounding area,<br />
groundshaking, and other seismic and geologic hazards that could affect the <strong>City</strong>.<br />
Information obtained in this section is based on the <strong>General</strong> <strong>Plan</strong> Safety Element, the<br />
Hazard Mitigation <strong>Plan</strong>, and previous environmental documentation prepared for the<br />
<strong>City</strong>. Full bibliographic references are provided at the end <strong>of</strong> this section.<br />
• Existing Conditions<br />
Regional Geology<br />
The <strong>City</strong> <strong>of</strong> <strong>Inglewood</strong> is located within the Los Angeles basin area, at the southern edge<br />
<strong>of</strong> the Transverse Ranges geomorphic province, and near the northern boundary <strong>of</strong> the<br />
Peninsular Ranges geomorphic province (Yerkes et al. 1965). Most <strong>of</strong> the Transverse<br />
Ranges province is mountainous, including the San Gabriel and San Bernardino<br />
mountains to the east, and the Santa Monica Mountains to the north. The Peninsular<br />
Ranges geomorphic province is characterized by a series <strong>of</strong> northwest/southwesttrending<br />
mountains, including the San Jacinto and Santa Rosa mountains, and faults<br />
including the Newport-<strong>Inglewood</strong> Fault and the Whittier-Elsinore Fault. The San<br />
Andreas Fault is located approximately 45 miles northeast <strong>of</strong> <strong>Inglewood</strong>.<br />
Most <strong>of</strong> the <strong>City</strong> is underlain by a thick (10,000 to 12,000 foot) section <strong>of</strong> Tertiary and<br />
Quaternary marine and continental sedimentary rocks deposited on an igneousmetamorphic<br />
basement complex. The Tertiary rocks, consisting primarily <strong>of</strong> sandstone,<br />
silt-stone, and shale, are almost entirely <strong>of</strong> maring origin and range in age from Eocene to<br />
Pliocene. The Quaternary rocks consist <strong>of</strong> shallow marine sandstone and siltstone as well<br />
as continental siltstone, mudstone, and gravel.<br />
Faulting<br />
Earthquake magnitude is a quantitative measure <strong>of</strong> the strength <strong>of</strong> an earthquake or the<br />
strain energy released by it, as determined by the seismographic or geologic observations.<br />
It does not vary with distance or the underlying earth material. This differs from<br />
earthquake intensity, which is a qualitative measure <strong>of</strong> the effects a given earthquake has<br />
on people, structures, loose objects, and the ground at a specific location. Intensity<br />
generally increases with increasing magnitude and in areas underlain by unconsolidated<br />
materials, and decreases with distance from the epicenter.<br />
Several magnitude scales have been developed with the most commonly used scale called<br />
the moment magnitude (Mw) scale. Moment magnitude is related to the physical size <strong>of</strong><br />
fault rupture and the movement or displacement across the fault, and as such is more<br />
uniform measure <strong>of</strong> the strength <strong>of</strong> an earthquake. Another measure <strong>of</strong> earthquake size is<br />
seismic moment. The seismic moment determines the energy that can be radiated by an<br />
<strong>City</strong> <strong>of</strong> <strong>Inglewood</strong> <strong>General</strong> <strong>Plan</strong> <strong>Update</strong> Technical Background Report<br />
6.2-1
Chapter 6 Community Safety and Hazards<br />
earthquake. The moment magnitude <strong>of</strong> an earthquake is defined relative to the seismic<br />
moment for that event.<br />
Earthquake intensity in a given locality is typically measured using the Modified Mercalli<br />
Intensity Scale with values <strong>of</strong> this scale ranging from I to XII. The most commonly used<br />
adaptation covers the range <strong>of</strong> intensities from the conditions <strong>of</strong> a value <strong>of</strong> I that is<br />
defined as not felt except by very few, favorably situated, to XII that is defined as damage<br />
total, lines <strong>of</strong> sight disturbed, and objects thrown into the air. While an earthquake has<br />
only one magnitude, it can have many intensities, which typically decreases with distance<br />
from the epicenter. See Table 6.2-1 for more information on the Modified Mercalli<br />
Intensity Scale.<br />
Faults<br />
The Southern California region is seismically active and commonly experiences strong<br />
groundshaking resulting from earthquakes along both known and previously unknown<br />
active faults. Active faults are defined as faults that have caused soil and strata<br />
displacement within the Holocene period (the last 10,000 years). Potentially active faults<br />
are faults that have experienced movement in the Quaternary period (last two million<br />
years), but not during the Holocene. Faults that have not experienced movement in the<br />
last two million years are generally considered inactive.<br />
The <strong>City</strong> <strong>of</strong> <strong>Inglewood</strong> contains both active and potentially active faults. Figure 6.2-1<br />
illustrates the locations <strong>of</strong> regional faults and fault zones within the <strong>City</strong> and surrounding<br />
areas.<br />
The Newport-<strong>Inglewood</strong> Fault Zone (NIFZ), sometimes referred to as the Newport<br />
<strong>Inglewood</strong> Zone <strong>of</strong> Deformation, is a zone <strong>of</strong> discontinuous folds and faults which<br />
stretch across the Los Angeles basin in a northwest-southeast direction from Beverly<br />
Hills to Newport Beach. The deformation along NIFZ has been caused by displacement<br />
in the basement rocks and the overlying 10,000 to 12,000 feet <strong>of</strong> s<strong>of</strong>ter Tertiary and<br />
Quaternary sediments. The marine and continental sedimentary rocks have been warped<br />
and faulted forming such hills as the Baldwin, Rosecrans, and Dominguez. Thus, the hills<br />
are judged to be very young. This structural zone is exemplified by the young age <strong>of</strong><br />
sedimentary rocks involved in the deformation, the observed regional and local changes<br />
in surface elevation along and across the zone, and the abundance <strong>of</strong> earthquake<br />
epicenters over the last 60 years closely associated with this zone. This deformation is<br />
considered presently and potentially active.<br />
In addition to the NIFZ, several additional active or potentially active faults are located in<br />
or nearby the <strong>City</strong>. The Newport-<strong>Inglewood</strong> fault extends through the <strong>City</strong> and runs<br />
parallel to the San Andreas system and lies partly under the Pacific Ocean. Several<br />
moderate earthquakes and numerous smaller shocks have been recorded in proximity to<br />
the Newport-<strong>Inglewood</strong> zone and have originated on the deeper faults within the zone.<br />
The <strong>Inglewood</strong> Fault, one component <strong>of</strong> the Newport-<strong>Inglewood</strong> fault, has been mapped<br />
6.2-2<br />
<strong>City</strong> <strong>of</strong> <strong>Inglewood</strong> <strong>General</strong> <strong>Plan</strong> <strong>Update</strong> Technical Background Report
CITY <strong>of</strong> INGLEWOOD<br />
<strong>General</strong> <strong>Plan</strong><br />
GEOLOGY AND FAULT LINES<br />
Legend<br />
Alluvial Deposit<br />
Intermediate Alluvium<br />
Young Alluvial Fan Deposit<br />
Quarternary Intrusive<br />
San Pedro Sand Stone<br />
Fault Line<br />
<strong>City</strong> Boundary<br />
Source: <strong>City</strong> <strong>of</strong> <strong>Inglewood</strong>, February 2006.<br />
Date: April 27, 2006<br />
Miles<br />
A Division <strong>of</strong> 0 0.25 0.5<br />
Figure 6.2-1
6.2 Seismic Hazards<br />
Table 6.2-1<br />
Relationship between Greatest Measure Intensity and<br />
Magnitude<br />
Richter Modified Mercalli<br />
Magnitude (M) Intensity Scale<br />
Description<br />
I Detected by only sensitive instruments<br />
II Felt by a few people at rest<br />
3<br />
Felt noticeably indoors, but not always recognized as a quake;<br />
III<br />
vibration like a passing truck<br />
IV Felt indoors by many and outdoors by few<br />
4<br />
V Felt by most people. Some breakage <strong>of</strong> windows, dishes, and plaster<br />
5<br />
VIII Walls, monuments, chimneys fall; panel walls thrown out <strong>of</strong> frames<br />
6<br />
Buildings shift <strong>of</strong>f foundations; foundations crack; ground cracks;<br />
IX<br />
underground pipes break<br />
Most masonry and frame structures destroyed; ground cracks;<br />
7 X<br />
landslides<br />
8<br />
SOURCE: California Department <strong>of</strong> Mines and Geology 1998<br />
VI<br />
XI<br />
Felt by all; falling plaster and chimneys; damage small<br />
Ground fissures; pipes break; landslides; rails bent; new structures<br />
remain standing<br />
VII<br />
XII<br />
Damage to buildings varies; depends on quality <strong>of</strong> construction<br />
Damage total; waves seen on ground surface; objects thrown into the<br />
air<br />
through the <strong>Inglewood</strong> Civic Center, south <strong>of</strong> Centinela Creek, and is shown to similarly<br />
extend to the south <strong>of</strong> the Alquist-Priolo Zone map for the <strong>Inglewood</strong> Quadrangle.<br />
Another local component <strong>of</strong> the Newport-<strong>Inglewood</strong> Fault is the Townsite Fault which<br />
extends from its intersection with the Centinela Fault in the Centinela Creek, towards the<br />
southeast across the Hollywood Park racetrack, and extents approximately to Century<br />
Boulevard. The Portero Fault is a major local component <strong>of</strong> the Newport-<strong>Inglewood</strong><br />
Fault and traverses the eastern portion <strong>of</strong> the <strong>City</strong>, in a northwest-southeast direction.<br />
The Charnock and Overland Faults trends northwest-southeast and lies just west <strong>of</strong> the<br />
<strong>City</strong> boundary. Finally, the Transverse Faults consist <strong>of</strong> five northeast-southwest trending<br />
faults that cut or intersect the major northwest-southeast trending faults within the <strong>City</strong><br />
limits. These faults are known from the north to the south as the Fairview, Centinela,<br />
Cemetery, Manchester, and Century Faults. Little geologic data is available on these faults,<br />
but they are believed to be secondary faults to the major northwest-southeast trending set<br />
which are parallel to the NIFZ.<br />
Seismic Activity<br />
The <strong>City</strong> <strong>of</strong> <strong>Inglewood</strong> is located in a seismically active region <strong>of</strong> Southern California.<br />
Five moderate earthquakes greater than M 5.5 have occurred within the greater Los<br />
Angeles Basin in the last 80 years. These include the 1933 Long Beach earthquake, the<br />
1971 San Fernando earthquake, the 1987 Whittier narrows earthquake, the 1991 Sierra<br />
Madre earthquake, and the 1994 Northridge earthquake.<br />
<strong>City</strong> <strong>of</strong> <strong>Inglewood</strong> <strong>General</strong> <strong>Plan</strong> <strong>Update</strong> Technical Background Report<br />
6.2-5
Chapter 6 Community Safety and Hazards<br />
On March 11, 1933, the Long Beach earthquake <strong>of</strong> M 6.4 occurred on the Newport-<br />
<strong>Inglewood</strong> fault zone. The Long Beach earthquake produced extensive damage to<br />
unreinforced masonry structures in the Long Beach area while less extensive damage was<br />
reported in other parts <strong>of</strong> the Los Angeles basin. This event produced numerous ground<br />
failures in the form <strong>of</strong> liquefaction, seismic settlement, and lateral spreading from<br />
Newport Beach to Long Beach and as far inland as Garden Grove. Recent analysis <strong>of</strong> the<br />
Long Beach earthquake shows that the earthquake had a subsurface rupture length <strong>of</strong><br />
approximately 13-16 kilometers (km). The earthquake was centered in Huntington Beach<br />
at a 13 km depth and had a strike-slip focal mechanism consistent with the Newport-<br />
<strong>Inglewood</strong> fault zone.<br />
The M 6.7 San Fernando earthquake occurred on February 9, 1971. The epicenter was<br />
approximately 30 miles north <strong>of</strong> the <strong>City</strong> and surface rupture was experienced on various<br />
strands <strong>of</strong> the San Fernando fault zone, including the Tujunga and Sylmar faults, as a<br />
result <strong>of</strong> this earthquake. Damage caused by the 1971 quake led to the modification <strong>of</strong> the<br />
state building code and seismic safety standards to reduce structural damage and bodily<br />
injury during maximum credible earthquakes.<br />
The M 5.9 Whittier Narrows earthquake, related to the Elysian Park Fold and Thrust<br />
Belt, occurred on October 1, 1987 on a previously unrecognized fault. The earthquake<br />
epicenter was located approximately 20 miles north <strong>of</strong> the <strong>City</strong>. New studies have shown<br />
that this event occurred on the Puente Hills blind trust fault.<br />
The Sierra Madre earthquake occurred on June 28, 1991 along the Clamshell-Sawpit fault<br />
<strong>of</strong> the Sierra Madre fault zone. This M 5.8 earthquake was located in the San Gabriel<br />
Mountains, approximately 30 miles northeast <strong>of</strong> the <strong>City</strong>.<br />
The most recent earthquake <strong>of</strong> significance in Southern California affecting the <strong>City</strong> was<br />
the 1994 Northridge Earthquake, a magnitude 6.7 earthquake that occurred in the San<br />
Fernando Valley. Approximately 15,000 structures experienced moderate to severe<br />
damage and several bridges and overpasses collapsed. The epicenter for this earthquake<br />
was the San Andreas Fault, which is located approximately 45 miles from the <strong>City</strong>.<br />
Soils<br />
The soil types within the <strong>City</strong> consist <strong>of</strong> alluvium. <strong>General</strong>ly, these soils <strong>of</strong>fer poor<br />
resistance to ground shaking and can amplify some surface motion. According to the<br />
USGS, mean subsurface shear-wave velocities through <strong>Inglewood</strong> soils are calculated to<br />
be 350 to 375 meters per second which is relatively low (loose wet sand is 230 m/second<br />
while solid bedrock is over 1,600 m/sec). Lower subsurface shear-wave velocities signify<br />
a propensity for greater amplification <strong>of</strong> ground motion.<br />
Geologic Hazards<br />
The amount <strong>of</strong> damage to a building does not depend solely on how hard it is shaken. In<br />
general, smaller buildings such as houses are damaged more by higher frequencies, so<br />
6.2-6<br />
<strong>City</strong> <strong>of</strong> <strong>Inglewood</strong> <strong>General</strong> <strong>Plan</strong> <strong>Update</strong> Technical Background Report
6.2 Seismic Hazards<br />
usually a house must be relatively close to the epicenter to be severely damaged. Larger<br />
structures such as high-rises are damaged more by lower frequencies and will be more<br />
noticeably affected by the largest earthquakes, even at considerable distances.<br />
In addition to regional aspects <strong>of</strong> the earthquake hazard, there are location-specific<br />
hazards that can cause additional damage as described below.<br />
Expansive Soils<br />
Soils that volumetrically increase, or expand when exposed to water are considered<br />
expansive soils. These soils are typically very fine grained (i.e., clays) and can expand from<br />
small fractions to multiples <strong>of</strong> their volume, depending on their clay mineralogy. Such<br />
expansion can cause structural damage to foundations and roads without proper<br />
structural engineering.<br />
Subsidence<br />
Subsidence is the ground settlement that results over time from the extraction <strong>of</strong><br />
groundwater or oil. This is a phenomenon that usually extends over a large area and<br />
occurs on a gradual basis so the settlement effects on a single site, relative to its<br />
immediate neighbors, may be negligible as the neighboring properties are also subsiding.<br />
There is no historic evidence <strong>of</strong> subsidence problems in <strong>Inglewood</strong> although an area <strong>of</strong><br />
the Baldwin Hills, one to two miles northwest <strong>of</strong> the <strong>City</strong>, has experienced subsidence as<br />
severe as one-quarter inch per year due to decades <strong>of</strong> oil extraction.<br />
Loading Settlement<br />
Loading settlement is associated with weak, clay soils near the ground surface and is<br />
generally induced by the weight <strong>of</strong> buildings. The only area in the <strong>City</strong> known to have the<br />
potential for such settlement is along the course <strong>of</strong> the former Centinela Creek, which is<br />
partly due to the soil and partly due to poorly compacted fill placed along the creek bed in<br />
the early decades <strong>of</strong> the century. Structures built in this area either require construction<br />
on pilings or require soil compaction to depths <strong>of</strong> twenty or thirty feet as determined by<br />
individual site soil testing.<br />
Seismically Induced Settlement<br />
Seismically-induced settlement results form the consolidation or compaction <strong>of</strong> loose<br />
sandy soils during earthquake shaking. Except for the course <strong>of</strong> the former Centinela<br />
Creek described above, soil conditions in the <strong>City</strong> should not generally have the potential<br />
for such settlement. The area <strong>of</strong> relatively loose surface soil in the southern portion <strong>of</strong> the<br />
<strong>City</strong> is quite shallow, overlying well consolidated alluvium. However, soils testing on<br />
individual sites is the only effective manner to specifically identify the potential for such<br />
settlement.<br />
<strong>City</strong> <strong>of</strong> <strong>Inglewood</strong> <strong>General</strong> <strong>Plan</strong> <strong>Update</strong> Technical Background Report<br />
6.2-7
Chapter 6 Community Safety and Hazards<br />
Surface Rupture<br />
Surface rupture or displacement occurs as a fault breaks the ground surface during a<br />
seismic event. <strong>General</strong>ly, this hazard is anticipated to occur along pre-existing faults.<br />
Surface rupture cannot be prevented; thus, faults are identified with the purpose <strong>of</strong><br />
delineating zones over the surface tract <strong>of</strong> potentially hazardous faults where construction<br />
should be avoided. Greatest damage is generally associated with sudden, large<br />
displacements <strong>of</strong> earth materials.<br />
Groundshaking<br />
A major cause <strong>of</strong> structural damage from earthquakes is groundshaking. The amount <strong>of</strong><br />
motion expected at a building site can vary from none to forceful depending upon the<br />
distance to the fault, the magnitude <strong>of</strong> the earthquake, and the local geology. Greater<br />
movement can be expected at sites located on poorly consolidated material such as<br />
alluvium located near the source <strong>of</strong> the earthquake epicenter or in response to an<br />
earthquake <strong>of</strong> great magnitude. Strong ground shaking can damage large freeway<br />
overpasses and unreinforced masonry buildings. It can also trigger a variety <strong>of</strong> secondary<br />
hazards such as liquefaction, landslides, fire, and dam failure.<br />
Liquefaction<br />
Liquefaction refers to a phenomenon where the surface soils, generally alluvial soils,<br />
become saturated with water. Groundshaking packs the sand grains closer together so<br />
that there is less pore space available for the water. This increases the water pressure<br />
between the sand grains within the alluvium. These soils therefore, become very wet and<br />
mobile causing foundations <strong>of</strong> structures to move, leading to varying degrees <strong>of</strong> structural<br />
damage. <strong>General</strong>ly, liquefaction occurs only below the water table; however, after<br />
liquefaction has developed, it can move upward. Liquefaction susceptibility decreases<br />
with depth <strong>of</strong> the water table, and the age cementation, and compactness <strong>of</strong> the<br />
sediments.<br />
Possible liquefaction <strong>of</strong> the soils in the <strong>City</strong> has been significantly reduced due to water<br />
wells lowering the area’s water table. The <strong>City</strong> has been classified as having either very<br />
low susceptibility or—in the southernmost part <strong>of</strong> the <strong>City</strong>—low susceptibility to<br />
liquefaction. The one exception to these classifications is the former water course <strong>of</strong> the<br />
Centinela Creek which has a very high susceptibility rating. However, concrete culverts to<br />
capture water run<strong>of</strong>f along this course and the lowered water table may have lessened this<br />
susceptibility.<br />
Landslides and Slope<br />
Landslides are <strong>of</strong>ten associated with earthquakes, but there are other factors that can<br />
influence the occurrence <strong>of</strong> landslides. These factors include the slope, the moisture<br />
content <strong>of</strong> the soil and the composition <strong>of</strong> the subsurface geology. For example, heavy<br />
rains or improper grading may trigger a landslide.<br />
6.2-8<br />
<strong>City</strong> <strong>of</strong> <strong>Inglewood</strong> <strong>General</strong> <strong>Plan</strong> <strong>Update</strong> Technical Background Report
6.2 Seismic Hazards<br />
The hillside areas <strong>of</strong> the <strong>City</strong> are subject to landslide potential. Surface movements in the<br />
hillside area could be triggered by rain, a breach in a reservoir, damage to potable water<br />
reservoirs or pumping facilities, or earthquake. Hillside development has placed additional<br />
loads on the subsurface bedrock. Erosion and the loss <strong>of</strong> vegetation during periods <strong>of</strong><br />
drought tend to increase the potential for localized landslides in the hillside areas <strong>of</strong> the<br />
<strong>City</strong>.<br />
• Regulatory Setting<br />
Federal<br />
Uniform Building Code<br />
The Uniform Building Code (UBC) defines different regions <strong>of</strong> the United States and<br />
ranks them according to their seismic hazard potential. There are four types <strong>of</strong> these<br />
regions, which include Seismic Zones 1 through 4, with Zone 1 having the least seismic<br />
potential and Zone 4 having the highest seismic potential.<br />
State<br />
Alquist-Priolo Earthquake Fault Zoning Act<br />
The purpose <strong>of</strong> the Alquist-Priolo Earthquake Fault Zoning Act <strong>of</strong> 1972 is “to regulate<br />
development near active faults so as to mitigate the hazard <strong>of</strong> surface fault rupture.” The<br />
State Geologist (chief <strong>of</strong> the Division <strong>of</strong> Mines and Geology) is required to delineate<br />
Earthquake Fault Zones (formerly known as “Special Studies Zones” prior to January 1,<br />
1994) along known active faults. Cities and counties affected by the zones must regulate<br />
certain development within the zones. They must withhold development permits for sites<br />
within the zones until geologic investigations demonstrate that the sites are not<br />
threatened by surface displacement from future faulting. Typically, structures for human<br />
occupancy are not allowed within 50 feet <strong>of</strong> the trace <strong>of</strong> an active fault.<br />
Occupational Safety and Health Act<br />
Site safety requirements are generally based on specifications <strong>of</strong> the Occupational Safety<br />
and Health Administration (OSHA), in accordance with the Occupational Safety and<br />
Health Act (1970, amended through 1998). OSHA standards relevant to geologic<br />
resources are focused on worker safety during excavation (see CFR Section 29 Part 1926).<br />
California Building Code<br />
The state <strong>of</strong> California provides a minimum standard for building design through the<br />
California Building Code (CBC). The CBC is based on the UBC, with amendments for<br />
California conditions.<br />
Chapter 23 <strong>of</strong> the CBC contains specific requirements for seismic safety. Chapter 29 <strong>of</strong><br />
the CBC regulates excavation, foundations, and retaining walls. Chapter 33 <strong>of</strong> the CBC<br />
<strong>City</strong> <strong>of</strong> <strong>Inglewood</strong> <strong>General</strong> <strong>Plan</strong> <strong>Update</strong> Technical Background Report<br />
6.2-9
Chapter 6 Community Safety and Hazards<br />
contains specific requirements pertaining to site demolition, excavation, and construction<br />
to protect people and property from hazards associated with excavation cave-ins and<br />
falling debris or construction materials. Chapter 70 <strong>of</strong> the CBC regulates grading<br />
activities, including drainage and erosion control. Construction activities are subject to<br />
occupational safety standards for excavation, shoring, and trenching as specified in Cal-<br />
OSHA regulations (Title 8 <strong>of</strong> the California Code <strong>of</strong> Regulations [CCR]) and in<br />
Section A33 <strong>of</strong> the CBC.<br />
Chapter 16A, Division IV <strong>of</strong> the California Building Code (CBC), entitled “Earthquake<br />
Design,” states that the “purpose <strong>of</strong> the earthquake provisions herein is primarily to<br />
safeguard against major structural failures or loss <strong>of</strong> life.” The CBC and Uniform Building<br />
Code (UBC) regulates the design and construction <strong>of</strong> excavations, foundations, building<br />
frames, retaining walls, and other building elements to mitigate the effects <strong>of</strong> seismic<br />
shaking and adverse soil conditions. The procedures and limitations for the design <strong>of</strong><br />
structures are based on site characteristics, occupancy type, configuration, structural<br />
system, height, and seismic zoning. Seismic zones are mapped areas (Figure 16A-2 <strong>of</strong> the<br />
CBC and Figure 16-2 <strong>of</strong> the UBC) that are based on proximity to known active faults and<br />
the potential for future earthquakes and intensity <strong>of</strong> seismic shaking. Seismic zones range<br />
from 0 to 4, with areas mapped as Zone 4 being potentially subject to the highest<br />
accelerations due to seismic shaking and the shortest recurrence intervals.<br />
Regional<br />
Southern California Association <strong>of</strong> Governments<br />
Regional, multi-agency planning efforts are summarized by the Southern California<br />
Association <strong>of</strong> Governments (SCAG 1996). Among policies aimed at managing regional<br />
growth, and relevant to geologic resources, is the following:<br />
• Policy 3.22—Discourage development, or encourage the use <strong>of</strong> special design<br />
requirements, in areas with steep slopes, high fire, flood and seismic hazards.<br />
Seismic Hazards Mapping Act<br />
CDMG also provides guidance with regard to seismic hazards. Under CDMG’s Seismic<br />
Hazards Mapping Act, seismic hazard zones are to be identified and mapped to assist<br />
local governments in land use planning. The intent <strong>of</strong> this publication is to protect the<br />
public from the effects <strong>of</strong> strong ground shaking, liquefaction, landslides, ground failure,<br />
or other hazards caused by earthquakes. In addition, CDMG’s Special Publications 117,<br />
“Guidelines for Evaluating and Mitigating Seismic Hazards in California,” provides<br />
guidance for the evaluation and mitigation <strong>of</strong> earthquake-related hazards for projects<br />
within designated zones <strong>of</strong> required investigations.<br />
6.2-10<br />
<strong>City</strong> <strong>of</strong> <strong>Inglewood</strong> <strong>General</strong> <strong>Plan</strong> <strong>Update</strong> Technical Background Report
6.2 Seismic Hazards<br />
Local<br />
Building Code <strong>of</strong> the <strong>City</strong> <strong>of</strong> <strong>Inglewood</strong><br />
Implementation <strong>of</strong> earthquake mitigation policy most <strong>of</strong>ten takes place at the local<br />
government level. The <strong>City</strong> <strong>of</strong> <strong>Inglewood</strong> Department <strong>of</strong> Building and Safety enforces<br />
building codes pertaining to earthquake hazards. The <strong>Inglewood</strong> Municipal Code<br />
incorporates the Uniform Building Code provisions in Chapter 11. These ordinances<br />
reference applicable standards and documentation requirements found in the California<br />
Building Code that address seismic safety.<br />
The <strong>City</strong> <strong>of</strong> <strong>Inglewood</strong> <strong>Plan</strong>ning Department enforces the zoning and land use<br />
regulations relating to earthquake hazards in accordance with the Safety Element <strong>of</strong> the<br />
<strong>General</strong> <strong>Plan</strong>. The <strong>Inglewood</strong> Municipal Code incorporates in Chapter 12 reference to<br />
suitability <strong>of</strong> open space designation for land susceptible to seismic hazards.<br />
<strong>General</strong>ly, these codes seek to discourage development in areas that could be prone to<br />
flooding, landslide, wildfire and/or seismic hazards; and where development is permitted,<br />
that the applicable construction standards are met. Developers in hazard-prone areas are<br />
required to retain a qualified pr<strong>of</strong>essional engineer to evaluate level <strong>of</strong> risk on the site and<br />
recommend appropriate mitigation measures.<br />
Coordination among Building Officials<br />
The <strong>City</strong> <strong>of</strong> <strong>Inglewood</strong> Building Code sets the minimum design and construction<br />
standards for new buildings. In June 2003, the <strong>City</strong> <strong>of</strong> <strong>Inglewood</strong> adopted the most<br />
recent seismic standards (CBC 2001) in its building code, which requires that new<br />
buildings be built at a higher seismic standard. Since 1988 the <strong>City</strong> <strong>of</strong> <strong>Inglewood</strong> also<br />
requires that site-specific seismic hazard investigations be performed for new essential<br />
facilities, major structures, hazardous facilities, and special occupancy structures such as<br />
schools, hospitals, and emergency response facilities.<br />
Municipal Code Section 11-130. Earthquake Hazard Reduction in Existing Buildings<br />
This section <strong>of</strong> the <strong>City</strong>’s Municipal Code promotes public safety and welfare by reducing<br />
the risk <strong>of</strong> death or injury that may result from the effects <strong>of</strong> earthquakes on unreinforced<br />
masonry-bearing-wall buildings constructed prior to 1934 or any unreinforced masonry<br />
building located in the <strong>City</strong> <strong>of</strong> <strong>Inglewood</strong>. Such buildings have been widely recognized for<br />
sustaining life-hazardous damage, including partial or complete collapse during moderate<br />
to strong earthquakes. The section sets forth the minimum standards for structural<br />
seismic resistance established primarily to reduce the risk <strong>of</strong> life loss or injury.<br />
Compliance with these standards will not necessarily prevent loss <strong>of</strong> life or injury or<br />
prevent earthquake damage to rehabilitated buildings. This section provides systematic<br />
procedures and standards or identification and classification <strong>of</strong> unreinforced masonrybearing-<br />
wall buildings based on their present use. Priorities, time periods and standards<br />
are also established under which these buildings are required to be structurally analyzed<br />
<strong>City</strong> <strong>of</strong> <strong>Inglewood</strong> <strong>General</strong> <strong>Plan</strong> <strong>Update</strong> Technical Background Report<br />
6.2-11
Chapter 6 Community Safety and Hazards<br />
and anchored. Where the analysis finds deficiencies, the building must be strengthened or<br />
demolished.<br />
• Issues<br />
• The <strong>City</strong> <strong>of</strong> <strong>Inglewood</strong> is located within a seismically active region. Therefore,<br />
existing and future developments within the <strong>City</strong> are likely to be subject to potential<br />
seismic hazards, including subsidence, landsliding, and liquefaction depending on<br />
their location.<br />
• Many public and private buildings, including the Civic Center, <strong>Inglewood</strong> Police<br />
Headquarters, County Superior Court Buildings and <strong>of</strong>fice, commercial and<br />
recreational structures were designed or built prior to 1973 and lack seismic<br />
retr<strong>of</strong>itting.<br />
• Glossary<br />
• Active fault—As defined by the California Division <strong>of</strong> Mines and Geology, a fault<br />
that has shown displace within Holocene time (last 11,000 years). For planning<br />
purposes, such faults can be expected to move within the next hundred years.<br />
• Blind thrust fault—A thrust fault that does not rupture all the way up to the<br />
surface so there is no evidence <strong>of</strong> it on the ground. It is "buried" under the<br />
uppermost layers <strong>of</strong> rock in the crust.<br />
• Earthquake—Perceptible trembling to violent shaking <strong>of</strong> the ground, produced by<br />
sudden displacement <strong>of</strong> rock below and at the earth’s surface.<br />
• Epicenter—An area <strong>of</strong> the surface <strong>of</strong> the earth directly above the focus (true<br />
center <strong>of</strong> an earthquake, within which the strain energy is first converted to elastic<br />
wave energy <strong>of</strong> an earthquake.<br />
• Erosion—Movement <strong>of</strong> material (such as soil) from one place to another on the<br />
earth’s surface. Agents <strong>of</strong> movement include water, ice, wind, and gravity.<br />
• Expansive soils—Expansive soils are those that greatly increase in volume when<br />
they absorb water and shrink when they dry out.<br />
• Fault—A fracture in the earth’s crust accompanied by a displacement <strong>of</strong> one side<br />
with respect to the other and in a direction parallel to the fracture.<br />
• Fault system—Two or more interconnecting fault sets.<br />
• Fault trace—The intersection <strong>of</strong> a fault with the earth’s surface.<br />
• Fault zone—A zone in which surface disruption or rock fracture has occurred due<br />
to movement along a fault. A fault zone may be expressed as an area with<br />
numerous small fractures, breccia (essentially, fractured rock) as a fault gouge. A<br />
fault zone may be anywhere from a few meters or yards) to two or more kilometers<br />
(1 mile or more) wide.<br />
• Ground failure—Mudslide, landslide, liquefaction, <strong>of</strong> the seismic compaction <strong>of</strong><br />
soils.<br />
• Ground shaking—When movement occurs along a fault, the energy generated is<br />
released as waves, which cause groundshaking. Groundshaking intensity varies with<br />
the magnitude <strong>of</strong> the earthquake, the distance from the epicenter, and the type <strong>of</strong><br />
rock or sediment through which the seismic waves move. The strongest ground<br />
motion, or groundshaking, typically occurs near the epicenter <strong>of</strong> the earthquake and<br />
attenuates (diminishes) as the seismic waves move away from the epicenter. In<br />
general, loose or s<strong>of</strong>t saturated sediments amplify groundshaking more than dense<br />
or stiff soils or bedrock materials.<br />
6.2-12<br />
<strong>City</strong> <strong>of</strong> <strong>Inglewood</strong> <strong>General</strong> <strong>Plan</strong> <strong>Update</strong> Technical Background Report
6.2 Seismic Hazards<br />
• Inactive fault—A fault which shows no evidence <strong>of</strong> movement in recent geologic<br />
time and no potential for movement in the relatively near future.<br />
• Intensity (<strong>of</strong> an earthquake)—A measure <strong>of</strong> the effects <strong>of</strong> earthquake waves on<br />
people, structures, and earth’s surface at a particular place. The intensity at a<br />
specific point depends not only upon the strength <strong>of</strong> the earthquake, or the<br />
earthquake magnitude, but also upon the distance from the point to the epicenter<br />
and the local geology. Intensity may be contrasted with magnitude, which is a<br />
measure <strong>of</strong> the total energy released by an earthquake.<br />
• Landslide—A general term for relatively rapid mass movement, such as slump,<br />
rock slide, debris slide, mudflow, and earthflow.<br />
• Liquefaction—A process whereby soil is temporarily transformed to a fluid form<br />
during intense and prolonged ground shaking or because <strong>of</strong> a sudden shock or<br />
strain.<br />
• Magnitude (earthquake)—A measure <strong>of</strong> the strength <strong>of</strong> an earthquake or the<br />
strain energy released by it, as determined by seismographic observations and<br />
mathematical calculations.<br />
• Potentially active fault—As defined by the California Division <strong>of</strong> Mines and<br />
Geology, a fault that has shown displacement during Quaternary time (last 2.0<br />
million years), but not during the Holocene.<br />
• Seismic—Pertaining to earthquake or earth vibration, including those that are<br />
artificially induced.<br />
• Subsidence—Gradual settling or sinking <strong>of</strong> the earth=s surface with little or no<br />
horizontal motion, usually as the result <strong>of</strong> the withdrawal <strong>of</strong> oil, natural gas, or<br />
groundwater, or hydrocompaction.<br />
• Surface Rupture—An observable break in the ground surface and associated<br />
deformation resulting from movement along a fault.<br />
• References<br />
<strong>Inglewood</strong>, <strong>City</strong> <strong>of</strong>. 1995. <strong>City</strong> <strong>of</strong> <strong>Inglewood</strong> <strong>General</strong> <strong>Plan</strong>, Safety Element. July.<br />
<strong>Inglewood</strong>, <strong>City</strong> <strong>of</strong>. 2004. Natural Hazard Mitigation <strong>Plan</strong>, Earthquake Hazards in Southern<br />
California. September 24.<br />
<strong>Inglewood</strong>, <strong>City</strong> <strong>of</strong>. 2003. The Renaissance Final Environmental Impact Report, SCH<br />
2003031041. November.<br />
<strong>City</strong> <strong>of</strong> <strong>Inglewood</strong> <strong>General</strong> <strong>Plan</strong> <strong>Update</strong> Technical Background Report<br />
6.2-13
6.3 Flood Hazards<br />
6.3 FLOOD HAZARDS<br />
This section describes the existing flood hazards within <strong>Inglewood</strong>, as well as the flood<br />
protection measures provided by federal, state, and local programs. In addition, federal,<br />
state, and local regulations pertaining to flood hazards are presented. Flood hazards are<br />
an important consideration to the <strong>General</strong> <strong>Plan</strong> <strong>Update</strong> because protective measures and<br />
planning can provide a reliable and safe environment for <strong>City</strong>’s economic health and<br />
future development. The information for this section comes from a variety <strong>of</strong> documents,<br />
including correspondence with the <strong>City</strong>’s Department <strong>of</strong> Public Works, the <strong>City</strong>’s 2004<br />
Hazard Mitigation Action <strong>Plan</strong> and the County <strong>of</strong> Los Angeles Department <strong>of</strong> Public<br />
Works Watershed Management Program.<br />
• Existing Conditions<br />
Surface Water Drainage<br />
The <strong>City</strong> <strong>of</strong> <strong>Inglewood</strong> is located within the upper boundaries <strong>of</strong> both the Ballona Creek<br />
Watershed and the Dominguez Watersheds, as shown in Figure 5.2-1 (Watersheds) <strong>of</strong><br />
Section 5.2 <strong>of</strong> this TBR. The majority <strong>of</strong> the <strong>City</strong> is located within the Dominguez<br />
Watershed and drains southward into the Dominguez Channel and ultimately into the<br />
Los Angeles Harbor. However, most <strong>of</strong> the northern areas <strong>of</strong> the <strong>City</strong> (generally the area<br />
north <strong>of</strong> Manchester Boulevard 90 ) drain westward into Centinela Creek that then flows<br />
west into the Ballona Creek. Additionally, the northern part <strong>of</strong> the Morningside Park<br />
neighborhood drains northward into Ballona Creek and ultimately into the Santa Monica<br />
Bay. Section 5.2 (Hydrology and Water Quality) contains additional information on the<br />
<strong>City</strong>’s hydrologic setting.<br />
The Dominguez Watershed is comprised <strong>of</strong> approximately 110 square miles <strong>of</strong> land in<br />
the southern portion <strong>of</strong> Los Angeles County. 96 percent <strong>of</strong> its total area is developed and<br />
the overall watershed land use is predominantly residential. Rather than being defined by<br />
the natural topography <strong>of</strong> its drainage area, the Dominguez watershed boundary is<br />
defined by a complex network <strong>of</strong> storm drains and smaller flood control channels. The<br />
Dominguez Channel extends from the Los Angeles International Airport to the Los<br />
Angeles Harbor and drains large if not all portions <strong>of</strong> the cities <strong>of</strong> <strong>Inglewood</strong>,<br />
Hawthorne, El Segundo, Gardena, Lawndale, Redondo Beach, Torrance, Carson and Los<br />
Angeles. 91<br />
The Ballona Creek Watershed is approximately 130 square miles; the major tributaries to<br />
Ballona Creek include Centinela Creek, Sepulveda Canyon Channel, Benedict Canyon<br />
Channel, and numerous storm drains. Due to the extensive modifications <strong>of</strong> Ballona<br />
90 County <strong>of</strong> Los Angeles, Department <strong>of</strong> Public Works, Ballona Creek Watershed Master <strong>Plan</strong>, 2006, Website:<br />
http://www.ladpw.org/wmd/watershed/bc/bcmp/masterplan.cfm, accessed March 16, 2006<br />
91 County <strong>of</strong> Los Angeles, Department <strong>of</strong> Public Works, Dominguez Watershed Current Conditions, 2006.<br />
Website: http://www.ladpw.org/wmd/watershed/DC/current_cond.cfm, accessed March 16, 2006.<br />
<strong>City</strong> <strong>of</strong> <strong>Inglewood</strong> <strong>General</strong> <strong>Plan</strong> <strong>Update</strong> Technical Background Report<br />
6.3-1
Chapter 6 Community Safety and Hazards<br />
Creek and its tributaries, natural hydrologic functions have been significantly reduced<br />
within the Watershed. Approximately 40 percent <strong>of</strong> the Watershed is covered by<br />
impervious surfaces 92 .<br />
Rainfall<br />
The climate <strong>of</strong> the area is generally mild, as is typical <strong>of</strong> Mediterranean climate regions.<br />
Rainfall events normally occur during the wet winter months, between November and<br />
April. However, the region is subject to wide variations in annual rainfall, exemplified by<br />
the drought conditions <strong>of</strong> the late 1980’ and the extreme wet years <strong>of</strong> the late 1990’s. In<br />
1989 and 1990, the <strong>City</strong> received less than 5.5 inches <strong>of</strong> rainfall, while in the El Nino year<br />
<strong>of</strong> 1998, the <strong>City</strong> received twice its annual average with 27.06 inches <strong>of</strong> rain. The annual<br />
average for the past 88 years has been 13.38 inches. 93<br />
Drainage Facilities<br />
The <strong>City</strong> <strong>of</strong> <strong>Inglewood</strong> has approximately 54 miles <strong>of</strong> reinforced concrete pipe storm<br />
drains and 1157 catch basins to convey storm water. 94 This system collects all run<strong>of</strong>f and<br />
carries from the <strong>City</strong> and eventually to the Pacific Ocean. The <strong>City</strong> is currently<br />
undergoing a comprehensive Storm Drain Master Study <strong>Plan</strong> to assess existing facilities<br />
and address future needs. The Master <strong>Plan</strong> is scheduled for completion by the end <strong>of</strong><br />
2006. 95 Section 3.3 (Storm Drains) contains additional information on the <strong>City</strong>’s drainage<br />
facilities.<br />
Flooding<br />
The Federal Emergency Management Agency (FEMA), as part <strong>of</strong> its responsibilities to<br />
carry out the National Flood Insurance Program, has mapped most <strong>of</strong> the flood risk areas<br />
within the United States. These maps, called Flood Insurance Rate Maps, depicting flood<br />
hazards across the United States. The maps show “special flood hazard areas” for those<br />
areas that are affected by a flood having a one-percent chance <strong>of</strong> occurrence in a given<br />
year. The special flood hazard areas are shown on the Flood Insurance Rate Maps with<br />
flood zone designations that begin with the letter A or V. By law, federally regulated<br />
lending institutions must require the purchase <strong>of</strong> flood insurance for mortgages on<br />
buildings shown in the special flood hazard areas on these maps. Outside <strong>of</strong> the special<br />
flood hazard areas, flood zone designations B, C, and X identify areas <strong>of</strong> moderate or<br />
minimal hazard from the principal source <strong>of</strong> flooding. FEMA has designated the city <strong>of</strong><br />
<strong>Inglewood</strong> under Flood Zone “C,” which does not require mandatory flood mitigation<br />
92 County <strong>of</strong> Los Angeles, Department <strong>of</strong> Public Works, Dominguez Watershed Current Conditions, 2006.<br />
Website: http://www.ladpw.org/wmd/watershed/DC/current_cond.cfm, accessed March 16, 2006.<br />
93 <strong>Inglewood</strong>, <strong>City</strong> <strong>of</strong>. 2005 Urban Water Management <strong>Plan</strong>. December.<br />
94 http://www.city<strong>of</strong>inglewood.org/depts/pw/divisions/water_works/storm_water/storm_h2o.asp.<br />
Accessed March 16, 2006.<br />
95 Conversation with Eugene Parker, <strong>Inglewood</strong> Department <strong>of</strong> Public Works, March 20, 2006.<br />
6.3-2<br />
<strong>City</strong> <strong>of</strong> <strong>Inglewood</strong> <strong>General</strong> <strong>Plan</strong> <strong>Update</strong> Technical Background Report
6.3 Flood Hazards<br />
enforcement as there is a less then one percent chance <strong>of</strong> a flood occurring within the<br />
<strong>City</strong> in any given year. 96<br />
As previously stated, the <strong>City</strong> is situated mostly in the upper reaches <strong>of</strong> two local<br />
watersheds and is not located in any identified 50-year, 100-year or 500-year flood plain.<br />
Therefore, the risks associated with flooding in the <strong>City</strong> tend to be localized and would<br />
most likely occur when the amount <strong>of</strong> water generated from rainfall and run<strong>of</strong>f exceeds<br />
the capacity <strong>of</strong> the storm drain system. In order to reduce the likelihood <strong>of</strong> localized<br />
flooding, the Storm Drain Maintenance Staff regularly clears the catch basins and drains<br />
<strong>of</strong> foliage, garbage, and other obstructions to allow the free flow <strong>of</strong> run<strong>of</strong>f to prepare for<br />
and prevent flooding. 97<br />
Two specific intersections have been identified as being subject to flooding during<br />
heavier than average rain event. The intersection <strong>of</strong> West Century Boulevard and South<br />
<strong>Inglewood</strong> Avenue and the intersection <strong>of</strong> West Beach Avenue and Evergreen Street<br />
flood on a regular basis. The <strong>City</strong> is presently analyzing this issue and it will be addressed<br />
in the Storm Drain Master Study <strong>Plan</strong> 98 .<br />
Dams and Reservoir Inundation<br />
Dam and reservoir failures can result from a number <strong>of</strong> causes, both manmade and<br />
natural. An earthquake, erosion <strong>of</strong> the foundation, improper siting, structural or design<br />
flaws and rising floodwaters, individually or in a combination, can result in the release <strong>of</strong><br />
large amounts <strong>of</strong> water.<br />
The <strong>City</strong> has two reservoirs that act as storage for the booster pump stations: the North<br />
<strong>Inglewood</strong> and Morningside Reservoirs. Each reservoir is about 18 feet to 20 feet deep,<br />
but the reservoir levels are maintained below 3.5 feet to ensure circulation and maintain<br />
adequate disinfectant residuals in the system. The North <strong>Inglewood</strong> Reservoir was<br />
constructed in 1974, and is a covered underground reservoir totaling approximately 144<br />
feet wide and 221 feet long. While its total capacity is approximately 4.6 million gallons,<br />
the reservoir level is currently operated between 1.0 and 3.5 feet. The Morningside<br />
Reservoir was constructed in 1954, and has a total capacity <strong>of</strong> 16 million gallons. The<br />
reservoir level is currently operated between 0.5 and 2.5 feet. As both reservoirs are<br />
below-ground storage facilities, there is no risk <strong>of</strong> flooding or inundation due to reservoir<br />
failure. 99<br />
96 http://www.city<strong>of</strong>inglewood.org/faqs/categoryqna.asp?id=13 Accessed March 16, 2006.<br />
97 http://www.city<strong>of</strong>inglewood.org/depts/pw/divisions/water_works/storm_water/storm_h2o.asp.<br />
Accessed March 16, 2006.<br />
98 Conversation with Eugene Parker, <strong>Inglewood</strong> Department <strong>of</strong> Public Works, March 20, 2006<br />
99 Conversation with Eugene Parker, <strong>Inglewood</strong> Department <strong>of</strong> Public Works, March 20, 2006<br />
<strong>City</strong> <strong>of</strong> <strong>Inglewood</strong> <strong>General</strong> <strong>Plan</strong> <strong>Update</strong> Technical Background Report<br />
6.3-3
Chapter 6 Community Safety and Hazards<br />
• Regulatory Setting<br />
State<br />
California Water Code<br />
California law makes local governmental agencies responsible for flood control.<br />
Section 8401, paragraph (c), <strong>of</strong> the California Water Code states, “The primary<br />
responsibility for planning, adoption, and enforcement <strong>of</strong> land use regulations to<br />
accomplish flood plain management rests with local levels <strong>of</strong> government.” Locally,<br />
<strong>Inglewood</strong> falls under the jurisdiction <strong>of</strong> the Los Angeles County Flood Control District,<br />
which regulates and plans flood control activity in Los Angeles County.<br />
• Issues<br />
Based upon research and conversations with Department <strong>of</strong> Public Works staff, the<br />
following is a list <strong>of</strong> issues that the <strong>City</strong> faces regarding Flood Hazards.<br />
• <strong>Inglewood</strong> is highly urbanized and the majority <strong>of</strong> the ground coverage consists <strong>of</strong><br />
impervious surfaces, which can lead to an increase in volume and velocity <strong>of</strong> run<strong>of</strong>f<br />
after a rainfall event, increasing the potential for flood hazards.<br />
• The <strong>City</strong> lacks a plan to address mitigation in areas <strong>of</strong> historical flooding during<br />
large storm events.<br />
• References<br />
ESRI Hazard Information and Awareness. 2006. Website:<br />
http://www.esri.com/hazards/index.html, accessed March 16.<br />
<strong>Inglewood</strong>, <strong>City</strong> <strong>of</strong>. 2005 Urban Water Management <strong>Plan</strong>. December.<br />
—— <strong>City</strong> <strong>of</strong> <strong>Inglewood</strong>, 2004. Hazard Mitigation <strong>Plan</strong>.<br />
—— Public Works Department. 2006. Storm H2O. Website:<br />
http://www.city<strong>of</strong>inglewood.org/depts/pw/divisions/water_works/storm_water/st<br />
orm_h2o.asp Accessed March 16.<br />
—— Frequently Asked Questions. 2006. Website:<br />
http://www.city<strong>of</strong>inglewood.org/faqs/categoryqna.asp?id=13 Accessed March 16.<br />
Parker, Eugene. 2006. Conversation with <strong>Inglewood</strong> Department <strong>of</strong> Public Works,<br />
Stormwater Run<strong>of</strong>f Investigation Inspector Unit. March 20.<br />
6.3-4<br />
<strong>City</strong> <strong>of</strong> <strong>Inglewood</strong> <strong>General</strong> <strong>Plan</strong> <strong>Update</strong> Technical Background Report
6.4 Fire Hazards<br />
6.4 FIRE HAZARDS<br />
This section provides a general description <strong>of</strong> the fire hazards that exist within<br />
<strong>Inglewood</strong>. Fire and emergency services for urban fire prevention are discussed in<br />
Section 6.7 (Fire Services) <strong>of</strong> this Technical Background Report. Information for this<br />
section was obtained from the <strong>City</strong>’s 2004 Hazard Mitigation <strong>Plan</strong>.<br />
• Existing Conditions<br />
Background<br />
Major fires are generally classified as two types: wildland fire and urban fire. Wildfire<br />
hazard areas are commonly identified in regions <strong>of</strong> the wildland/urban interface.<br />
However, the <strong>City</strong> <strong>of</strong> <strong>Inglewood</strong> is an entirely built-out urban community that is<br />
characterized by a mix <strong>of</strong> residential, commercial, and industrial areas. Because no<br />
wildland areas exist within the <strong>City</strong> boundaries, this section focuses on the potential for<br />
urban fire hazards.<br />
Urban Fire Hazard<br />
Communities that don’t have an urban/wildland interface, such as the <strong>City</strong> <strong>of</strong> <strong>Inglewood</strong>,<br />
are much less likely to experience a catastrophic fire. However, the potential still exists for<br />
large urban fires to occur, particularly after a major disaster such as an earthquake.<br />
Elements that would hamper fire-fighting capabilities in urban areas include the<br />
following: density <strong>of</strong> wooden structures, limited personnel and equipment to address<br />
multiple fires, debris blocking the access <strong>of</strong> fire-fighting equipment, and a limited water<br />
supply. 100<br />
The Los Angeles County Fire Department (LACFD) has stated that there are no specific<br />
areas in the <strong>City</strong> <strong>of</strong> <strong>Inglewood</strong> that are more vulnerable to fire than others. High-rise,<br />
multi-story buildings could present more challenges for fighting fires because they have a<br />
potential for logistical difficulties due to their increased demand for more personnel and<br />
manpower; however, there are no reoccurring areas in <strong>Inglewood</strong> with fire problems. All<br />
areas are equally accessible in the <strong>City</strong>. 101<br />
Additionally, the LACFD is not aware <strong>of</strong> any specific buildings that are at risk for fire<br />
hazards within the <strong>City</strong>. Fortunately, most large structures in the <strong>City</strong> were constructed in<br />
recent decades and have standard fire prevention features such as: fire stairwells and exits;<br />
adequate exterior clearances and accessibility for fire fighting equipment; and interior fire<br />
sprinkler systems. In addition, residential structures throughout the <strong>City</strong> have set-backs<br />
from property lines, which separate adjacent structures and minimize the potential for fire<br />
100 http://www.eqe.com/publications/revf93/firefoll.htm<br />
101<br />
LACFD, 2006. Verbal communication with Mark Bennett, Active Division Fire Chief,<br />
March 2006.<br />
<strong>City</strong> <strong>of</strong> <strong>Inglewood</strong> <strong>General</strong> <strong>Plan</strong> <strong>Update</strong> Technical Background Report<br />
6.4-1
Chapter 6 Community Safety and Hazards<br />
spread. The <strong>City</strong>’s extensive grid pattern <strong>of</strong> streets provides a natural system <strong>of</strong><br />
“firebreaks” in both commercial and residential areas in addition to accessibility for fire<br />
fighting equipment.<br />
As discussed in more detail in Section 2.3 (Housing) <strong>of</strong> this TBR, the <strong>City</strong> <strong>of</strong> <strong>Inglewood</strong><br />
has a relatively old housing stock, with approximately 26.8 percent <strong>of</strong> units built prior to<br />
1950. This relatively old housing stock is likely to have a significant number <strong>of</strong> units in<br />
need <strong>of</strong> major repairs; approximately 4,000 housing units were identified as substandard<br />
and in deteriorating or unsound conditions. While not identified by the LACFD, it is<br />
possible that the older housing stock within the <strong>City</strong> could pose a fire hazard threat, as<br />
some homes may not have fire alarms or other typical fire prevention devices that are<br />
commonly installed on newer homes.<br />
Further, while significant fire damage occurs infrequently, it is most likely to occur where<br />
industrial chemicals and fuels are used, stored, or transported. Industrial uses are generally<br />
in the northwestern portion <strong>of</strong> the <strong>City</strong>, clustered around West Florence Avenue. Such<br />
dangers, however, are minimized by the stringent enforcement <strong>of</strong> State requirements and<br />
<strong>of</strong> the <strong>City</strong>’s Fire Code, Building Code, and Zoning Code.<br />
• Regulatory Setting<br />
Federal<br />
Uniform Fire Code<br />
The Uniform Fire Code contains regulations relating to construction and maintenance <strong>of</strong><br />
buildings and the use <strong>of</strong> premises. Topics addressed in the Code include fire department<br />
access, fire hydrants, automatic sprinkler systems, fire alarm systems, fire and explosion<br />
hazards safety, hazardous materials storage and use, provisions intended to protect and<br />
assist fire responders, industrial processes, and many other general and specialized firesafety<br />
requirements for new and existing buildings and premises. The Code contains<br />
specialized technical regulations related to fire and life safety.<br />
State<br />
California Fire Code (Title 24, Part 9, California Code <strong>of</strong> Regulations)<br />
The California Fire Code is Part 9 <strong>of</strong> the California Code <strong>of</strong> Regulations, Title 24, also<br />
referred to as the California Building Standards Code. The California Fire Code<br />
incorporates the Uniform Fire Code with necessary California amendments. This Code<br />
prescribes regulations consistent with nationally recognized good practice for the<br />
safeguarding to a reasonable degree <strong>of</strong> life and property from the hazards <strong>of</strong> fire<br />
explosion, and dangerous conditions arising from the storage, handling and use <strong>of</strong><br />
hazardous materials and devices, and from conditions hazardous to life or property in the<br />
use or occupancy <strong>of</strong> buildings or premises and provisions to assist emergency response<br />
personnel.<br />
6.4-2<br />
<strong>City</strong> <strong>of</strong> <strong>Inglewood</strong> <strong>General</strong> <strong>Plan</strong> <strong>Update</strong> Technical Background Report
6.4 Fire Hazards<br />
California Health and Safety Code<br />
State fire regulations set forth in Section 13000 et seq. <strong>of</strong> the California Health and Safety<br />
Code, include regulations for building standards (as also set forth in the California<br />
Building Code), fire protection and notification systems, fire protection devices such as<br />
extinguishers and smoke alarms, high-rise building and childcare facility standards, and<br />
fire suppression training.<br />
Local<br />
<strong>City</strong> <strong>of</strong> <strong>Inglewood</strong> Municipal Code<br />
Chapter 6 (Fire Prevention)<br />
In 2000, the <strong>City</strong> adopted the Los Angeles Fire Code within the <strong>Inglewood</strong> Municipal<br />
Code Chapter 6. Article 1 <strong>of</strong> this Chapter identifies the adopted Los Angeles County Fire<br />
Code and associated amendments, while Article 2 <strong>of</strong> Chapter 6 pertains to the Hazardous<br />
Materials Inventory and Emergency <strong>Plan</strong>.<br />
• Issues<br />
• The older housing stock <strong>of</strong> the <strong>City</strong> could pose a fire hazard if upgraded fire<br />
prevention devices have not been installed.<br />
• References<br />
California Department <strong>of</strong> Forestry and Fire Protection (CDF), 2006. CDF 2005 Wildland<br />
Fire Summary, March.<br />
California Department <strong>of</strong> Forestry and Fire Protection (CDF), 2006. 20 Largest<br />
California Wildland Fires (By Structures Destroyed and By Acreage Burned), 24<br />
February.<br />
<strong>City</strong> <strong>of</strong> <strong>Inglewood</strong>, 2004. Hazard Mitigation <strong>Plan</strong>.<br />
<strong>City</strong> <strong>of</strong> <strong>Inglewood</strong> <strong>General</strong> <strong>Plan</strong> <strong>Update</strong> Technical Background Report<br />
6.4-3
6.5 Hazardous Materials<br />
6.5 HAZARDOUS MATERIALS<br />
This section provides information on hazardous materials and waste management<br />
associated with existing land uses within the <strong>City</strong> <strong>of</strong> <strong>Inglewood</strong>. Information for this<br />
section was obtained from the Los Angeles County Fire Department (LACFD), <strong>City</strong> <strong>of</strong><br />
<strong>Inglewood</strong> Municipal Code, and the Department <strong>of</strong> Toxic Substances Control (DTSC).<br />
• Existing Conditions<br />
Hazardous materials in the <strong>City</strong> are routinely used, stored, and transported in<br />
commercial/retail businesses as well as in educational facilities, hospitals, and households.<br />
A hazardous material is defined as any material that due to its quantity, concentration,<br />
physical or chemical characteristics, poses a significant present or potential hazard to<br />
human health and safety or to the environment if released. Hazardous materials include,<br />
but are not limited to, hazardous substances, hazardous wastes, and any material that a<br />
business or the local implementing agency has a reasonable basis for believing would be<br />
injurious to the health and safety <strong>of</strong> persons or harmful to the environment if released.<br />
Hazardous materials use and waste generators in the <strong>City</strong> include businesses, public and<br />
private institutions, and households. Federal, state, and local agency databases maintain<br />
comprehensive information on the locations <strong>of</strong> facilities using large quantities <strong>of</strong><br />
hazardous materials, as well as facilities generating hazardous waste. Some <strong>of</strong> these<br />
facilities use certain classes <strong>of</strong> hazardous materials that require accidental release scenario<br />
modeling and risk management plans to protect surrounding land uses.<br />
Transportation <strong>of</strong> Hazardous Materials<br />
The transport <strong>of</strong> hazardous materials through the <strong>City</strong> <strong>of</strong> <strong>Inglewood</strong> is regulated by the<br />
state Department <strong>of</strong> Transportation (Caltrans) and California Highway Patrol (CHP). The<br />
Santa Monica (405) Freeway traverses through and provides direct access to the western<br />
portion <strong>of</strong> the <strong>City</strong> (in a north-south direction), and the Century (105) Freeway traverses<br />
through the southern portion <strong>of</strong> the <strong>City</strong> (in an east-west direction). Both <strong>of</strong> these<br />
freeways can be considered major routes where hazardous materials can be routinely<br />
transported. Additionally, the Cities busiest intersections on the west side <strong>of</strong> the <strong>City</strong> 102<br />
(e.g. Florence-La Cienega and Century-La Cienega) are major truck routes in the <strong>City</strong><br />
where hazardous materials are routinely transported by trucks.<br />
In general, with the exception <strong>of</strong> high-level radioactive materials and certain poisons and<br />
explosives, all classes <strong>of</strong> hazardous materials can be transported on roadways in the <strong>City</strong>.<br />
However, because Section 31303 <strong>of</strong> the California Vehicle Code and U.S. Department <strong>of</strong><br />
Transportation regulations require that hazardous materials be transported by routes with<br />
the least overall travel time, many <strong>of</strong> the local streets in the <strong>City</strong> are not used for the<br />
transport <strong>of</strong> hazardous materials. Although the <strong>City</strong> has little or no industry that uses<br />
102 <strong>Inglewood</strong>, <strong>City</strong> <strong>of</strong>. 1999, SEMS Multihazard Functional <strong>Plan</strong>, February.<br />
<strong>City</strong> <strong>of</strong> <strong>Inglewood</strong> <strong>General</strong> <strong>Plan</strong> <strong>Update</strong> Technical Background Report<br />
6.5-1
Chapter 6 Community Safety and Hazards<br />
significant amounts <strong>of</strong> hazardous materials, materials are in transit through the <strong>City</strong> from<br />
other locations outside the <strong>City</strong>, and traverse the <strong>City</strong> en route to other destinations<br />
outside the <strong>City</strong>.<br />
Existing Hazardous Material Sites<br />
Comprehensive Environmental Response, Compensation, and Liability<br />
Information System (CERCLIS)<br />
The Comprehensive Environmental Response, Compensation, and Liability Act <strong>of</strong> 1980 (CERCLA)<br />
was developed to protect the water, air, and land resources from the risks created by past<br />
chemical disposal practices. Under CERCLA, the United States Environmental<br />
Protection Agency (EPA) maintains a list, known as CERCLIS, <strong>of</strong> all contaminated sites<br />
in the nation that have in the past or are currently undergoing clean-up activities.<br />
CERCLIS contains information on current hazardous waste sites, potential hazardous<br />
waste sites, and remedial activities. This includes sites that are on the National Priorities<br />
List (NPL) or being considered for the NPL (“Superfund”). No sites within the <strong>City</strong> are<br />
currently listed in the CERCLIS database. 103<br />
Cortese List<br />
The Hazardous Waste and Substances Sites (Cortese) List is a tool used by the state and<br />
local agencies and developers to comply with the California Environmental Quality Act<br />
(CEQA) requirements in providing information about the location <strong>of</strong> hazardous materials<br />
release sites. Government Code Section 65962.5 requires the California EPA to develop<br />
an updated Cortese List at least annually. Two sites within the <strong>City</strong> are currently listed<br />
under the Cortese List, and are further described below. 104<br />
Southern California Gas Company - <strong>Inglewood</strong> Manufactured Gas <strong>Plan</strong>t<br />
Located at 700 Warren Lane, a 1.4 acre portion <strong>of</strong> the 55 acre Edward Vincent Park was<br />
used by the Gas Co. for the production <strong>of</strong> "manufactured gas" in the early 1900s.<br />
Currently the site is used as a city-owned recreational park. Manufactured gas was made at<br />
the site from coal and oil, and the byproducts from this operation included tars, oils,<br />
sludges, lampblack etc. Some byproduct residues such as, polycyclic aromatic<br />
hydrocarbons (PAH), could pose a hazardous material threat. In 1992 the California<br />
Department <strong>of</strong> Toxic Substances (DTSC) conducted a Preliminary Endangerment Report<br />
(PEA) and recommended remediation. The remediation was accomplished by the<br />
excavation <strong>of</strong> 5,824 tons <strong>of</strong> soil contaminated from former manufactured gas operations.<br />
Sampling verified the achievement <strong>of</strong> cleanup goals. Clean soil was imported, backfilled,<br />
compacted and resodded.<br />
103 U.S. EPA, Superfund Information Systems, CERCLIS Database, website:<br />
http://www.epa.gov/superfund/sites/cursites/, accessed March 7, 2006.<br />
104 State <strong>of</strong> California, Environmental Protection Agency, Department <strong>of</strong> Toxic Substances Control,<br />
Hazardous Waste and Substances Site List (Cortese List),<br />
http://www.dtsc.ca.gov/database/Calsites/Cortese_List.cfm?county=19, accessed March 7, 2006.<br />
6.5-2<br />
<strong>City</strong> <strong>of</strong> <strong>Inglewood</strong> <strong>General</strong> <strong>Plan</strong> <strong>Update</strong> Technical Background Report
6.5 Hazardous Materials<br />
Caprice Cleaners<br />
Located at 11236 Crenshaw Boulevard, the site is located in a strip mall and has operated<br />
as a dry cleaning facility for approximately 20 years. Phase I and II investigations<br />
confirmed soil contaminated by Perchloroethylene (PCE). The (DTSC) reviewed the<br />
Preliminary Endangerment Assessment report and concurs with the recommendation<br />
that "No Further Action" is warranted at the site on February 14, 1995 and the site is part<br />
<strong>of</strong> the Voluntary Cleanup Program (VCP).<br />
DTSC Site Mitigation and Brownsfield Reuse Program (“CalSites”) Database<br />
The Site Mitigation and Brownsfield Reuse Program serves to cleanup and redevelop<br />
Brownfield sites for future use. Brownfields are properties that are contaminated, or<br />
thought to be contaminated, and are underutilized due to remediation costs and liability<br />
concerns. Often the remediation cost associated with a contaminated site serves as a<br />
major deterrent to any planned reuse <strong>of</strong> that site.<br />
The DTSC introduced the VCP to protect human health, cleanup the environment, and<br />
get property back to productive use. Participants in the VCP are able to restore properties<br />
quickly and efficiently, and eliminate competition for DTSC funding. Sites eligible for<br />
VCP are generally low-priority hazardous waste sites. The two Cortese sites identified<br />
above are also in the Site Mitigation and Brownsfield Reuse Program database as VCP<br />
Properties.<br />
Regional Water Quality Control Board (RWQCB) Spills, Leaks, Investigations,<br />
and Cleanup (SLIC) List<br />
The SLIC Program was established by the State Water Resources Control Board<br />
(SWRCB) to allow each <strong>of</strong> its nine Regional Boards to oversee the cleanup <strong>of</strong> illegal<br />
discharges, contaminated properties, and other unregulated releases adversely impacting<br />
the state’s waters. Sites managed within the SLIC Program include sites polluted as a<br />
result <strong>of</strong> recent or historic spills, subsurface releases (e.g., pipelines, sumps), complaint<br />
investigations, and all other unauthorized discharges that pollute or threaten to pollute<br />
surface and/or ground waters.<br />
Nine sites within the <strong>City</strong> <strong>of</strong> <strong>Inglewood</strong> were identified in the SLIC List maintained by<br />
the Los Angeles Regional Water Quality Control Board (LARWQCB). The SLIC Section<br />
<strong>of</strong> the LARWQCB oversees activities at non-underground storage tank (UST) sites where<br />
soil or groundwater contamination have occurred due to former industrial facilities and<br />
dry cleaners, where chlorinated solvents were spilled, or have leaked into the soil or<br />
groundwater. Table 6.5-1 identifies SLIC facilities and the associated substances that were<br />
released.<br />
<strong>City</strong> <strong>of</strong> <strong>Inglewood</strong> <strong>General</strong> <strong>Plan</strong> <strong>Update</strong> Technical Background Report<br />
6.5-3
Chapter 6 Community Safety and Hazards<br />
Table 6.5-1<br />
Facilities on SLIC List for the <strong>City</strong> <strong>of</strong> <strong>Inglewood</strong><br />
Site Name Address Substance Status<br />
1 Bodycote Hinderliter 9121 Aviation Blvd.<br />
Volatile Organic<br />
Compounds (VOC)<br />
Open<br />
2 Chrysler-Prince 1030 W Manchester Blvd. NA Closed<br />
3 Collins Estate Site 9007–9121 Aviation Blvd. VOC Open<br />
4<br />
Faithful Central Baptist<br />
Church<br />
321 Eucalyptus<br />
Polyethylene<br />
terephthalate (PET)<br />
Open<br />
5 Glasgow Property 315 Glasgow Ave. PET Open<br />
6 Owen's Cleaner 6501 West Blvd. VOC Closed<br />
7 Princeland Properties 1237 W Arbor Vitae St. NA Open<br />
8 Texaco Cypress Fee<br />
3000 90th St & Darby<br />
Park<br />
PET<br />
Open<br />
9<br />
Trinity Building—East<br />
Parking Lot<br />
301 West Florence Ave. PET Open<br />
SOURCE: LARWQCB LUFT List (http://geotracker.swrcb.ca.gov/search/) Accessed March 7, 2006<br />
“Open” status indicates that the site is still under investigation and/or cleanup.<br />
“Closed” status indicates that no additional investigation or cleanup is required at the site at this time, but does<br />
not mean that the contamination has been remediated.<br />
VOC’s are any organic compound which evaporates readily to the atmosphere. VOCs contribute significantly to<br />
photochemical smog production and certain health problems.<br />
Polyethylene terephthalate (PET) is a plastic resin <strong>of</strong> the polyester family that is used to make beverage, food<br />
and other liquid containers, as well as for some other therm<strong>of</strong>orming applications.<br />
Leaking Underground Fuel Tanks (LUFTs)<br />
The LARWQCB also maintains an Underground Storage Tank Program (UST Program)<br />
that deals specifically with leaking fuel tanks. While there may be other constituents <strong>of</strong><br />
concern resulting from leaking fuel tanks, the primary substance <strong>of</strong> concern <strong>of</strong> this<br />
program is fuel. Most frequently, these fuel tank leaks are associated with common<br />
neighborhood gasoline service stations. According to the LARWQCB’s Leaking<br />
Underground Fuel Tank (LUFT) database, the <strong>City</strong> <strong>of</strong> <strong>Inglewood</strong> has 91 identified LUFT<br />
sites. These facilities on the LUFT List are shown in Table 6.5-2 in Appendix C.<br />
Figure 6.5-1 shows both SLIC and LUFT sites within the <strong>City</strong> <strong>of</strong> <strong>Inglewood</strong>.<br />
Oil Wells and Pipelines<br />
The <strong>City</strong> <strong>of</strong> <strong>Inglewood</strong> is located within the southern portion <strong>of</strong> a large oil field that<br />
includes Baldwin Hills to the Northwest. The oil deposits in this oil field have been<br />
reduced after nearly a century <strong>of</strong> oil extraction but there may be sufficient remaining oil<br />
and possibly untapped deposits, for continued extraction and even new exploratory<br />
drilling.<br />
6.5-4<br />
<strong>City</strong> <strong>of</strong> <strong>Inglewood</strong> <strong>General</strong> <strong>Plan</strong> <strong>Update</strong> Technical Background Report
CITY <strong>of</strong> INGLEWOOD<br />
<strong>General</strong> <strong>Plan</strong><br />
LOCATION OF LUFT SITES<br />
Legend<br />
LUFT Site<br />
Open Case<br />
Closed Case<br />
<strong>City</strong> Boundary<br />
Water Body<br />
Metro Rail<br />
Railroad<br />
Source: Ca. Depart. <strong>of</strong> Fish & Game, January 2006.<br />
Date: May15, 2006<br />
Miles<br />
A Division <strong>of</strong> 0 0.25 0.5<br />
Figure 6.5-1
6.5 Hazardous Materials<br />
Within the <strong>City</strong>, there is only one remaining active oil well site, the seven-acre Brea Oil<br />
Company site at Eucalyptus Avenue and Hyde Park Boulevard. This site has multiple oil<br />
wells; however, any oil or gas extracted are not stored onsite, but are piped directly to<br />
refineries outside <strong>of</strong> the <strong>City</strong>. Previously, a small site operated in what is now the north<br />
parking lot at Hollywood Park. It was closed in 1997.<br />
Two major crude oil pipelines pass through western <strong>Inglewood</strong>, one 12-inch pipe and<br />
one 16-inch pipe. These pipelines transport crude oil through the <strong>City</strong> to refineries<br />
located outside <strong>of</strong> <strong>Inglewood</strong>.<br />
The primary hazards associated with oil wells and pipelines are fire and oil spills.<br />
Secondary hazards include the release <strong>of</strong> fumes into the air and the possible leaking <strong>of</strong> oil<br />
into the <strong>City</strong>’s storm drain system that could lead to contamination <strong>of</strong> beaches and the<br />
ocean. Due to the age and depletion <strong>of</strong> the <strong>Inglewood</strong> oil field, it is unlikely that there is<br />
sufficient pressure for a well to blow out if one is damaged. Also, as stated above oil<br />
extracted from these sites is not stored onsite. For these reasons, risks associated with fire<br />
or leaks are minimal, and any such risk would most likely be contained onsite.<br />
Potentially Contaminated Sites<br />
Potentially contaminated sites within Los Angeles County, which includes the <strong>City</strong> <strong>of</strong><br />
<strong>Inglewood</strong>, may by caused by various types <strong>of</strong> land uses including landfills, manufacturing<br />
facilities, industrial facilities, and medical facilities. Although these facilities and<br />
operations generally use and store hazardous materials legally, incidents involving the<br />
accidental releases <strong>of</strong> these materials may occur due to their large concentration at these<br />
locations.<br />
Currently, the <strong>City</strong> <strong>of</strong> <strong>Inglewood</strong> does not operate any Class I landfills, which are used for<br />
the collection <strong>of</strong> hazardous wastes. The collection <strong>of</strong> household hazardous waste in the<br />
<strong>City</strong> is conducted by Los Angeles County, which conducts weekly household hazardous<br />
waste roundups throughout the County. Once or twice per year the household hazardous<br />
waste roundup is held in <strong>Inglewood</strong>, depending on the availability <strong>of</strong> a site. Household<br />
hazardous waste that are typically collected include: deodorizers, cleaners, bleach, floor<br />
wax, spot remover, drain cleaner, furniture polish, aerosol cans, latex paints, oil paints,<br />
weed killer, fertilizer, antifreeze, pesticides, pool chlorine, household and auto batteries,<br />
garden chemicals, motor oil, and propane tanks. Despite efforts by the County to collect<br />
these household hazardous wastes, there remains the risk <strong>of</strong> improper use or disposal <strong>of</strong><br />
these materials by residents. Adverse environmental impacts can occur when household<br />
hazardous materials are disposed <strong>of</strong> in unlined sanitary landfills that are not meant for<br />
hazardous materials. These hazardous materials may leach through the soil and<br />
contaminate groundwater.<br />
Although incidents involving the inadvertent release <strong>of</strong> hazardous materials can happen<br />
anywhere, areas within the <strong>City</strong> that are subject to a higher risk <strong>of</strong> these incidents include<br />
locations near roadways that are frequently used for transporting hazardous materials<br />
<strong>City</strong> <strong>of</strong> <strong>Inglewood</strong> <strong>General</strong> <strong>Plan</strong> <strong>Update</strong> Technical Background Report<br />
6.5-7
Chapter 6 Community Safety and Hazards<br />
such as the major arterials <strong>of</strong> La Cienega, Manchester and Century Boulevards, or along<br />
the 405 or 105 Freeways.<br />
• Regulatory Setting<br />
A number <strong>of</strong> federal, state, and local laws and regulations have been enacted to regulate<br />
the management <strong>of</strong> hazardous materials. Implementation <strong>of</strong> these laws and the<br />
management <strong>of</strong> hazardous materials are regulated through programs administered by<br />
various agencies at the federal, state, and local levels. An overview <strong>of</strong> the key hazardous<br />
materials laws and regulations that apply to the <strong>City</strong> are provided below.<br />
Federal<br />
Several federal agencies regulate hazardous materials. These include the U.S. EPA, the<br />
Occupational Safety and Health Administration (OSHA), and the Department <strong>of</strong><br />
Transportation (DOT). Applicable federal regulations are contained primarily in Titles 10,<br />
29, 40, and 49 <strong>of</strong> the Code <strong>of</strong> Federal Regulations (CFR).<br />
The U.S. DOT has developed regulations pertaining to the transport <strong>of</strong> hazardous<br />
materials and hazardous wastes by all modes <strong>of</strong> transportation. The U.S. Postal Service<br />
(USPS) has developed additional regulations for the transport <strong>of</strong> hazardous materials by<br />
mail. DOT regulations specify packaging requirements for different types <strong>of</strong> materials.<br />
EPA has also promulgated regulations for the transport <strong>of</strong> hazardous wastes. These more<br />
stringent requirements include tracking shipments with manifests to ensure that wastes<br />
are delivered to their intended destinations.<br />
State<br />
California Environmental Protection Agency<br />
The California Environmental Protection Agency (Cal/EPA) has broad jurisdiction over<br />
hazardous materials management in the state. Within Cal/EPA, the DTSC has primary<br />
regulatory responsibility for hazardous waste management and cleanup. Enforcement <strong>of</strong><br />
regulations has been delegated to local jurisdictions that enter into agreements with<br />
DTSC for the generation, transport, and disposal <strong>of</strong> hazardous materials under the<br />
authority <strong>of</strong> the Hazardous Waste Control Law.<br />
Along with the DTSC, the RWQCB is responsible for implementing regulations<br />
pertaining to management <strong>of</strong> soil and groundwater investigation and cleanup. RWQCB<br />
regulations are contained in Title 27 <strong>of</strong> the CCR. Additional state regulations applicable to<br />
hazardous materials are contained in Title 22 <strong>of</strong> the California Code <strong>of</strong> Regulations<br />
(CCR). Title 26 <strong>of</strong> the CCR is a compilation <strong>of</strong> those sections or titles <strong>of</strong> the CCR that are<br />
applicable to hazardous materials.<br />
6.5-8<br />
<strong>City</strong> <strong>of</strong> <strong>Inglewood</strong> <strong>General</strong> <strong>Plan</strong> <strong>Update</strong> Technical Background Report
6.5 Hazardous Materials<br />
Department <strong>of</strong> Toxic Substances Control<br />
The DTSC regulates hazardous waste in California primarily under the authority <strong>of</strong> the<br />
federal Resource Conservation and Recovery Act (RCRA) <strong>of</strong> 1976, and the California Health<br />
and Safety Code. Other laws that affect hazardous waste are specific to handling, storage,<br />
transportation, disposal, treatment, reduction, cleanup, and emergency planning. In<br />
addition, DTSC reviews and monitors legislation to ensure that the position reflects the<br />
DTSC’s goals. From these laws, DTSC’s major program areas develop regulations and<br />
consistent program policies and procedures. The regulations spell out what those who<br />
handle hazardous waste must do to comply with the laws. Under RCRA, DTSC has the<br />
authority to implement permitting, inspection, compliance, and corrective action<br />
programs to ensure that people who manage hazardous waste follow state and federal<br />
requirements. As such, the management <strong>of</strong> hazardous waste in the Policy Area would be<br />
under regulation by the DTSC to ensure that state and federal requirements pertaining to<br />
hazardous waste are complied with.<br />
California law provides the general framework for regulation <strong>of</strong> hazardous wastes by the<br />
Hazardous Waste Control Law (HWCL) passed in 1972. DTSC is the state’s lead agency<br />
in implementing the HWCL. The HWCL provides for state regulation <strong>of</strong> existing<br />
hazardous waste facilities, which include “any structure, other appurtenances, and<br />
improvements on the land, used for treatment, transfer, storage, resource recovery,<br />
disposal, or recycling <strong>of</strong> hazardous wastes,” and requires permits for, and inspections <strong>of</strong>,<br />
facilities involved in generation and/or treatment, storage and disposal <strong>of</strong> hazardous<br />
wastes.<br />
Although there are numerous state policies dealing with hazardous waste materials, the<br />
most comprehensive is the Tanner Act (AB 2948) that was adopted in 1986. The Tanner<br />
Act governs the preparation <strong>of</strong> hazardous waste management plans and the siting <strong>of</strong><br />
hazardous waste facilities in the state <strong>of</strong> California. The act also mandates that each<br />
county adopt a Hazardous Waste Management <strong>Plan</strong>. To be in compliance with the Tanner<br />
Act, local or regional hazardous waste management plans need to include provisions that<br />
define (1) the planning process for waste management, (2) the permit process for new<br />
and expanded facilities, and (3) the appeal process to the state available for certain local<br />
decision.<br />
Hazardous Materials Management <strong>Plan</strong>s<br />
In January 1996, Cal EPA adopted regulations implementing a “Unified Hazardous Waste<br />
and Hazardous Materials Management Regulatory Program” (Unified Program). The six<br />
program elements <strong>of</strong> the Unified Program are hazardous waste generators and hazardous<br />
waste on-site treatment, underground storage tanks, above-ground storage tanks,<br />
hazardous material release response plans and inventories, risk management and<br />
prevention program, and Uniform Fire Code hazardous materials management plans and<br />
inventories. The program is implemented at the local level by a local agency—the<br />
Certified Unified Program Agency (CUPA). The CUPA is responsible for consolidating<br />
the administration <strong>of</strong> the six program elements within its jurisdiction. There are currently<br />
<strong>City</strong> <strong>of</strong> <strong>Inglewood</strong> <strong>General</strong> <strong>Plan</strong> <strong>Update</strong> Technical Background Report<br />
6.5-9
Chapter 6 Community Safety and Hazards<br />
eight CUPAs that are certified to implement the Unified Program in Los Angeles County.<br />
The CUPA that has jurisdiction in the <strong>City</strong> <strong>of</strong> <strong>Inglewood</strong> is the LACFD.<br />
State and federal laws require detailed planning to ensure that hazardous materials are<br />
properly handled, used, stored, and disposed <strong>of</strong>, and, in the event that such materials are<br />
accidentally released, to prevent or to mitigate injury to health or the environment.<br />
California’s Hazardous Materials Release Response <strong>Plan</strong>s and Inventory Law, sometimes<br />
called the “Business <strong>Plan</strong> Act,” aims to minimize the potential for accidents involving<br />
hazardous materials and to facilitate an appropriate response to possible hazardous<br />
materials emergencies. The law requires businesses that use hazardous materials to<br />
provide inventories <strong>of</strong> those materials to designated emergency response agencies, to<br />
illustrate on a diagram where the materials are stored on site, to prepare an emergency<br />
response plan, and to train employees to use the materials safely.<br />
California Accidental Release Prevention Program (CalARP)<br />
The CalARP program (CCR Title 19, Division 2, Chapter 4.5) covers certain businesses<br />
that store or handle more than a certain volume <strong>of</strong> specific regulated substances at their<br />
facilities. The CalARP program regulations became effective on January 1, 1997, and<br />
include the provisions <strong>of</strong> the federal Accidental Release Prevention program (Title 40,<br />
CFR Part 68) with certain additions specific to the state pursuant to Article 2,<br />
Chapter 6.95, <strong>of</strong> the Health and Safety Code.<br />
The list <strong>of</strong> regulated substances is found in Article 8, Section 2770.5 <strong>of</strong> the CalARP<br />
program regulations. The businesses that use a regulated substance above the noted<br />
threshold quantity must implement an accidental release prevention program, and some<br />
may be required to complete a Risk Management <strong>Plan</strong> (RMP). An RMP is a detailed<br />
engineering analysis <strong>of</strong> the potential accident factors present at a business and the<br />
mitigation measures that can be implemented to reduce this accident potential. The<br />
purpose <strong>of</strong> a RMP is to decrease the risk <strong>of</strong> an <strong>of</strong>f-site release <strong>of</strong> a regulated substance<br />
that might harm the surrounding environment and community. An RMP includes the<br />
following components: safety information, hazard review, operating procedures, training,<br />
maintenance, compliance audits, and incident investigation. The RMP must consider the<br />
proximity to sensitive populations located in schools, residential areas, general acute care<br />
hospitals, long-term health care facilities, and child day-care facilities, and must also<br />
consider external events such as seismic activity.<br />
Worker and Workplace Hazardous Materials Safety<br />
Occupational safety standards exist in federal and state laws to minimize worker safety<br />
risks from both physical and chemical hazards in the workplace. The California Division<br />
<strong>of</strong> Occupational Safety and Health (Cal/OSHA) is responsible for developing and<br />
enforcing workplace safety standards and assuring worker safety in the handling and use<br />
<strong>of</strong> hazardous materials. Among other requirements, Cal/OSHA obligates many<br />
businesses to prepare Injury and Illness Prevention <strong>Plan</strong>s and Chemical Hygiene <strong>Plan</strong>s.<br />
The Hazard Communication Standard requires that workers be informed <strong>of</strong> the hazards<br />
6.5-10<br />
<strong>City</strong> <strong>of</strong> <strong>Inglewood</strong> <strong>General</strong> <strong>Plan</strong> <strong>Update</strong> Technical Background Report
6.5 Hazardous Materials<br />
associated with the materials they handle. For example, manufacturers are to<br />
appropriately label containers, Material Safety Data Sheets are to be available in the<br />
workplace, and employers are to properly train workers.<br />
Hazardous Materials Transportation<br />
The California Highway Patrol (CHP) and California Department <strong>of</strong> Transportation<br />
(Caltrans) are the enforcement agencies for hazardous materials transportation<br />
regulations. Transporters <strong>of</strong> hazardous materials and waste are responsible for complying<br />
with all applicable packaging, labeling, and shipping regulations. The Office <strong>of</strong><br />
Emergency Services (OES) also provides emergency response services involving<br />
hazardous materials incidents.<br />
Investigation and Cleanup <strong>of</strong> Contaminated Sites<br />
The oversight <strong>of</strong> hazardous materials release sites <strong>of</strong>ten involves several different agencies<br />
that may have overlapping authority and jurisdiction. The DTSC and RWQCB are the<br />
two primary state agencies responsible for issues pertaining to hazardous materials release<br />
sites. Air quality issues related to remediation and construction at contaminated sites are<br />
also subject to federal and state laws and regulations that are administered at the local<br />
level.<br />
Investigation and remediation activities that would involve potential disturbance or<br />
release <strong>of</strong> hazardous materials must comply with applicable federal, state, and local<br />
hazardous materials laws and regulations. DTSC has developed standards for the<br />
investigation <strong>of</strong> sites where hazardous materials contamination has been identified or<br />
could exist based on current or past uses. The standards identify approaches to determine<br />
if a release <strong>of</strong> hazardous wastes/substances exists at a site and delineates the general<br />
extent <strong>of</strong> contamination; estimates the potential threat to public health and/or the<br />
environment from the release and provides an indicator <strong>of</strong> relative risk; determines if an<br />
expedited response action is require to reduce an existing or potential threat; and<br />
completes preliminary project scoping activities to determine data gaps and identifies<br />
possible remedial action strategies to form the basis for development <strong>of</strong> a site strategy.<br />
Siting <strong>of</strong> Schools<br />
The California Education Code (Section 17210 et seq.) outlines the requirements <strong>of</strong> siting<br />
school facilities near or on known or suspected hazardous materials sites, or near facilities<br />
that emit hazardous air emissions, handle hazardous or acutely hazardous materials,<br />
substances, or waste. The code requires that, prior to commencing the acquisition <strong>of</strong><br />
property for a new school site, an environmental site investigation be completed to<br />
determine the health and safety risks (if any) associated with a site. Recent legislation and<br />
changes to the Education Code identify DTSC’s role in the assessment, investigation, and<br />
cleanup <strong>of</strong> proposed school sites. All proposed school sites that will receive state funding<br />
for acquisition and/or construction must go through a comprehensive investigation and<br />
cleanup process under DTSC oversight. DTSC is required to be involved in the<br />
<strong>City</strong> <strong>of</strong> <strong>Inglewood</strong> <strong>General</strong> <strong>Plan</strong> <strong>Update</strong> Technical Background Report<br />
6.5-11
Chapter 6 Community Safety and Hazards<br />
environmental review process to ensure that selected properties are free <strong>of</strong><br />
contamination, or if the property is contaminated, that it is cleaned up to a level that is<br />
protective <strong>of</strong> students and faculty who will occupy the new school. All proposed school<br />
sites must be suitable for residential land use, which is DTSC’s most protective standard<br />
for children.<br />
Local<br />
Los Angeles County Fire Department<br />
As the Los Angeles County CUPA, the LACFD has jurisdiction in all unincorporated and<br />
most incorporated areas in the county, including the <strong>City</strong> <strong>of</strong> <strong>Inglewood</strong>. Serving as the<br />
CUPA, LACFD’s Health Hazardous Material Division (HHMD) directly administers<br />
programs related to waste generation, hazardous materials inventories, and risk<br />
management. The HHMD’s mission is to protect the public health and the environment<br />
throughout Los Angeles County from accidental releases and improper handling, storage,<br />
transportation, and disposal <strong>of</strong> hazardous materials and wastes through coordinated<br />
efforts <strong>of</strong> inspections, emergency response, enforcement, and site mitigation oversight.<br />
The Los Angeles County Department <strong>of</strong> Public Works is a participating agency under the<br />
LACFD CUPA and implements the underground storage tank program.<br />
• Issues<br />
• With major freeways and truck routes that traverse the <strong>City</strong>, hazardous materials<br />
are routinely transported through the <strong>City</strong>.<br />
• References<br />
California Environmental Protection Agency, Department <strong>of</strong> Toxic Substances Control,<br />
Hazardous Waste and Substances Site List (Cortese List),<br />
http://www.dtsc.ca.gov/database/Calsites/Cortese_List.cfm?county=19, accessed<br />
March 7, 2006.<br />
<strong>Inglewood</strong>, <strong>City</strong> <strong>of</strong>. 1999, SEMS Multihazard Functional <strong>Plan</strong>, February.<br />
U.S. EPA, Superfund Information Systems, CERCLIS Database, website:<br />
http://www.epa.gov/superfund/sites/cursites/, accessed March 7, 2006.<br />
6.5-12<br />
<strong>City</strong> <strong>of</strong> <strong>Inglewood</strong> <strong>General</strong> <strong>Plan</strong> <strong>Update</strong> Technical Background Report
6.6 Police Services<br />
6.6 POLICE SERVICES<br />
This section identifies the police protection service providers in the <strong>City</strong>, and describes<br />
the staffing levels, equipment, staffing standards, number <strong>of</strong> and types <strong>of</strong> calls received,<br />
and crime prevention programs available. Information for this section is based on written<br />
information provided by the <strong>Inglewood</strong> Police Department and the <strong>City</strong>’s website.<br />
• Existing Conditions<br />
Law enforcement services in the <strong>City</strong> are provided by the <strong>Inglewood</strong> Police Department<br />
(IPD). The IPD operates one police station which houses most <strong>of</strong> the Department’s<br />
<strong>of</strong>fices, located adjacent to <strong>Inglewood</strong> <strong>City</strong> Hall at 1 Manchester Boulevard. The location<br />
<strong>of</strong> the IPD is shown in Figure 6.6-1. The Office <strong>of</strong> the Chief <strong>of</strong> Police, the Patrol Bureau,<br />
the Detective Bureau, the Records Division, the Custody Division, and the pistol range<br />
are all located at the police station. The Communications Division is located in the<br />
basement <strong>of</strong> the station known as the Emergency Operations Center (EOC). The <strong>of</strong>fices<br />
for the Traffic Division, the Training Section, and the Personnel Section are located on<br />
the 2 nd floor <strong>of</strong> the <strong>City</strong> Hall Building, also at 1 Manchester Boulevard.<br />
The IPD is currently authorized for a staff <strong>of</strong> 210 sworn <strong>of</strong>ficers and 67 non-sworn<br />
positions, not including part-time positions, as shown in Table 6.6-1 below. As <strong>of</strong> April,<br />
2006, the IPD had 197 actual sworn <strong>of</strong>ficers and approximately 61 civilian personnel,<br />
which means that they have 13 sworn and 6 civilian vacancies.<br />
With a 2005 population estimate at 118,164, the <strong>City</strong> currently has a ratio <strong>of</strong><br />
approximately 1 <strong>of</strong>ficer per 1,000 residents; however, the <strong>City</strong> does not utilize a standard<br />
personnel-to-population ratio to determine department needs. Additions to the Police<br />
Department are determined more based on the number <strong>of</strong> calls the Department handles<br />
per year, and at the recommendation <strong>of</strong> department heads on an as-needed basis. 105<br />
The Police Department is comprised <strong>of</strong> three major Bureaus: The Administrative Services<br />
Bureau, Detective Bureau, and Patrol Bureau. These bureaus are further discussed below.<br />
Administrative Services Bureau<br />
This Bureau is the support branch <strong>of</strong> the <strong>City</strong>’s Police Department and is tasked with<br />
hiring the Department’s staff and ensuring they are trained, accurately paid, properly<br />
equipped and supported. Divisions within this Bureau include Police Communications,<br />
Custody, Personnel/Training along with the Property Unit, Fiscal Management Unit, and<br />
the Grants Administration Unit.<br />
105 Gruen Associates, 2003. Final Environmental Impact Report. Renaissance. November 26.<br />
<strong>City</strong> <strong>of</strong> <strong>Inglewood</strong> <strong>General</strong> <strong>Plan</strong> <strong>Update</strong> Technical Background Report<br />
6.6-1
Chapter 6 Community Safety and Hazards<br />
Table 6.6-1 <strong>Inglewood</strong> Police Department, Staffing Levels, 2006<br />
Sworn Positions<br />
Chief <strong>of</strong> Police 1<br />
Captain 3<br />
Lieutenant 9<br />
Sergeant 31<br />
Detective 41<br />
Police Officer<br />
(125, 13 vacant)<br />
Total 210<br />
Non-Sworn Positions<br />
Account Clerk—Senior 1<br />
Administrative Aide 4<br />
Administrative Analyst 1<br />
Administrative Secretary 2<br />
Communications Manager 1<br />
Community Affairs Program Specialist<br />
(1 vacant)<br />
Community Affairs Program Specialist—Senior 1<br />
Crime Analyst—Senior 1<br />
Custody Officer 10<br />
Customer Service Representative 1<br />
Desk Officer 2<br />
Fiscal Services Coordinator 1<br />
Forensic Specialist 1<br />
Forensic Specialist—Senior 2<br />
Forensic Supervisor 1<br />
Jail Manager 1<br />
Jail Supervisor 2<br />
Property Officer 2<br />
Property Room Supervisor 1<br />
Public Safety Dispatcher<br />
(14, 2 vacant)<br />
Public Safety Dispatcher—Supervising 6<br />
Records Assistant<br />
(6, 3 vacant)<br />
Records Manager 1<br />
Records Supervisor 1<br />
Special Enforcement Officer 2<br />
Typist Clerk—Senior 1<br />
Total 67<br />
SOURCE: <strong>City</strong> <strong>of</strong> <strong>Inglewood</strong>, Police Department. 2006<br />
6.6-2<br />
<strong>City</strong> <strong>of</strong> <strong>Inglewood</strong> <strong>General</strong> <strong>Plan</strong> <strong>Update</strong> Technical Background Report
CITY <strong>of</strong> INGLEWOOD<br />
<strong>General</strong> <strong>Plan</strong><br />
POLICE SERVICES<br />
Source: <strong>City</strong> <strong>of</strong> <strong>Inglewood</strong>, February 2006.<br />
Date: April 10, 2006<br />
Miles<br />
A Division <strong>of</strong> 0 0.25 0.5<br />
Figure 6.6-1
6.6 Police Services<br />
The Communications, Records and Custody Divisions provide front line support.<br />
Working 24 hours a day, 7 days a week, these divisions assist the department, dispatching<br />
emergency calls, operating the Jail and managing all <strong>of</strong> the associated reports and records<br />
required to move cases, paperwork and people through the Criminal Justice System. The<br />
Police Department maintains a detention facility for adult arrestees. Prisoners are held<br />
until they go to court or until they are bailed out from this department.<br />
The Property Unit stores, catalogs and manages more than 50,000 evidence items<br />
collected by the Department’s <strong>of</strong>ficers and detectives annually. The unit manages seized<br />
evidence until such time that it is transferred to the court or ordered destroyed.<br />
The Fiscal Management Unit handles the Department’s Payroll, Purchasing and<br />
Accounts Payable Sections. This unit ensures that employees are paid biweekly, purchases<br />
all equipment and services, and pays the vendors that keep the department operating. It is<br />
also responsible for development <strong>of</strong> the annual budget.<br />
The Personnel/Training Division is divided into two functions. The Human Resources<br />
Unit is responsible for recruiting, pre-employment investigations and hiring <strong>of</strong> all police<br />
employee’s. The unit also manages the personnel files <strong>of</strong> all Police Department<br />
employees.<br />
The Training Unit is responsible for the coordination and management <strong>of</strong> training to<br />
the department’s entire staff from entry-level recruits to the executive level <strong>of</strong> the<br />
department. The unit ensures that the department meets or exceeds the level <strong>of</strong> training<br />
mandated the California’s Commission on Police Standards and Training (P.O.S.T.).<br />
Detective Bureau<br />
This Bureau is traditionally responsible for the investigation and filing <strong>of</strong> criminal<br />
complaints. Normally, a crime or arrest report is taken by patrol <strong>of</strong>ficers and, depending<br />
on the nature <strong>of</strong> the crime and whether there are any leads, the report is assigned to a<br />
case investigator. The investigator conducts additional follow-up inquiries and determines<br />
if the crime is prosecutable. The ultimate goal is to solve the crime by arresting the<br />
perpetrator and seeing that he or she is prosecuted. The Detective Bureau also handles<br />
missing persons, child abuse and neglect referrals, the monitoring <strong>of</strong> state-mandated sex<br />
crime registrants, gang and other criminal intelligence issues, and the special issues<br />
surrounding juvenile crime and status <strong>of</strong>fenses. 106<br />
Patrol Bureau<br />
This Bureau is comprised <strong>of</strong> the Department’s uniformed police divisions and is<br />
considered the foundation <strong>of</strong> the Department’s crime fighting and public safety efforts in<br />
106 <strong>City</strong> <strong>of</strong> <strong>Inglewood</strong> website. www.city<strong>of</strong>inglewood.org/depts/police/detective/default.asp. Accessed<br />
March 23, 2006.<br />
<strong>City</strong> <strong>of</strong> <strong>Inglewood</strong> <strong>General</strong> <strong>Plan</strong> <strong>Update</strong> Technical Background Report<br />
6.6-5
Chapter 6 Community Safety and Hazards<br />
the <strong>City</strong>. These divisions include Patrol, Traffic, K-9 unit, Anti-Crime Team, and the<br />
Transit Safety Team. The Special Weapons and Tactics (SWAT) and Crisis Negotiation<br />
Teams are also functions managed within the Patrol Bureau.<br />
The Patrol Division is primarily responsible for answering calls for service and<br />
conducting proactive enforcement, with an emphasis on community policing and<br />
problem-solving approaches. <strong>Inglewood</strong> has the same contemporary crime problems<br />
facing other large cities and congested urban areas. The <strong>City</strong>’s close proximity to the Los<br />
Angeles International Airport brings a significant number <strong>of</strong> visitors and travelers<br />
through the city each day. 107 Each patrol <strong>of</strong>ficer works four 10-hour shifts per week. Shift<br />
times overlap to ensure adequate patrol <strong>of</strong> the <strong>City</strong>. Shifts last from 7:00 A.M. to 5:00 P.M.,<br />
from 3:00 P.M. to 1:00 A.M. and from 10:00 P.M. to 8:00 A.M. 108<br />
The Traffic Division is primarily responsible for the safety <strong>of</strong> <strong>Inglewood</strong>’s streets and<br />
thoroughfares and for ensuring the smooth flow <strong>of</strong> traffic. In addition, the Traffic<br />
Division conducts regular checkpoints for violators <strong>of</strong> the state’s Driver License and<br />
Driving Under the Influence (DUI) laws. Since 2001, the <strong>Inglewood</strong> Police Department<br />
has received a grant from the California Office <strong>of</strong> Traffic Safety that has covered most <strong>of</strong><br />
the costs related to such checkpoints. Finally, the Traffic Division is responsible for<br />
coordinating the city’s red light camera enforcement program.<br />
The Department’s K-9 Unit consists <strong>of</strong> three K-9 handlers. The <strong>Inglewood</strong> Police<br />
Department uses German Shepherds for its K-9 program.<br />
The Anti-Crime Team (ACT) consists <strong>of</strong> one lieutenant, two sergeants, and 17 police<br />
<strong>of</strong>ficers. The unit is primarily responsible for street gang enforcement, street narcotics<br />
enforcement and prostitution enforcement. In order to carry out its mission effectively,<br />
the unit regularly conducts parole and probation searches, “John” Stings and reverse-buy<br />
narcotics operations, as well as conducting undercover surveillances <strong>of</strong> criminal targets.<br />
Many <strong>of</strong> the Department’s SWAT members are assigned to the ACT unit.<br />
The Patrol Bureau is also responsible for parking enforcement activities including special<br />
enforcement, traffic control, and the school crossing guard program.<br />
Response Times<br />
The IPD does not set a minimum service ratio. Additions to the Police Department are<br />
made at the recommendation <strong>of</strong> department heads on an as-needed basis. The average<br />
emergency response times, however, for the period <strong>of</strong> January 1, 2005 through<br />
December 1, 2005 are as follows: For morning watch, 6 minutes 28 seconds; day watch,<br />
7 minutes and 29 seconds; and evening watch, 6 minutes and 48 seconds. The average<br />
non-emergency response time is as follows: For morning watch, 8 minutes and<br />
107 <strong>City</strong> <strong>of</strong> <strong>Inglewood</strong> website. www.city<strong>of</strong>inglewood.org/depts/police/patrol/default.asp. Accessed March<br />
23, 2006.<br />
6.6-6<br />
<strong>City</strong> <strong>of</strong> <strong>Inglewood</strong> <strong>General</strong> <strong>Plan</strong> <strong>Update</strong> Technical Background Report
6.6 Police Services<br />
26 seconds; day watch, 10 minutes and 1 second; and evening watch, 9 minutes and<br />
58 seconds. These response times are considered acceptable for the Police Department. 109<br />
Mutual Aid Agreements<br />
The IPD participates in the California Law Enforcement Master Mutual Aid <strong>Plan</strong>. The<br />
<strong>City</strong> <strong>of</strong> <strong>Inglewood</strong> and its Police Department are in “Area G” <strong>of</strong> the State’s Region 1.<br />
Coordinated response to state and local emergency is accomplished through the Law<br />
Enforcement Incident Command System, the Master Mutual Aid <strong>Plan</strong>, and the<br />
Standardized Emergency Management System. 110<br />
Crime Statistics<br />
The IPD distributes a variety <strong>of</strong> crime information and statistics to residents in order to<br />
increase awareness and, ultimately, reduce crime in the city. Table 6.6-2 represents crime<br />
statistics in seven major <strong>of</strong>fense categories (FBI Part I) for the calendar years 1999-2005.<br />
Part I crimes include murder, rape, robbery, aggravated assault, burglary, theft, and auto<br />
theft.<br />
During the calendar year 2005, there were 4,258 reported crimes, a 14 percent increase in<br />
major crimes compared to the calendar year 2004, which reported 3,746 crimes. The most<br />
frequently reported crimes were property crimes, which include burglary, larceny, and<br />
auto theft. Incidents <strong>of</strong> homicide increased from 1999 to 2001 by 95 percent, but have<br />
continued to drop almost steadily to 2005, with the exception <strong>of</strong> a 10 percent increase in<br />
incidents between 2002 and 2003. Incidents <strong>of</strong> rape over the years have gone up and<br />
down, as have incidents <strong>of</strong> robbery, aggravated assault, burglary, and auto theft. Larceny<br />
saw a decline in incidents <strong>of</strong> 26 percent from 2001 to 2004, but increased again<br />
27 percent from 2004 to 2005.<br />
Table 6.6-2 <strong>City</strong> <strong>of</strong> <strong>Inglewood</strong>, Crime Summary, 1999–2005<br />
1999 2000 2001 2002 2003 2004 2005<br />
CHANGE<br />
2004-2005<br />
Homicide 20 24 39 29 32 27 25 -7%<br />
Rape 39 52 36 61 56 43 47 9%<br />
Robbery 600 575 639 504 581 459 556 21%<br />
Aggravated Assault 695 726 641 329 422 390 434 11%<br />
Burglary 691 803 839 690 801 760 821 8%<br />
Larceny (Theft) 1,411 1,544 1,550 1,522 1,240 1,147 1,452 27%<br />
Auto Theft 925 914 874 970 1,230 920 923 0%<br />
Total 4,378 4,638 4,618 4,103 4,362 3,746 4,258 14%<br />
SOURCE: <strong>City</strong> <strong>of</strong> <strong>Inglewood</strong>, Police Department, 2006<br />
108 Gruen Associates, 2003. Final Environmental Impact Report Renaissance. November 26.<br />
109 Lieutenant Mark Sissac, <strong>Inglewood</strong> Police Department, 2006. Personal communication. March 29.<br />
110 Gruen Associates, 2003. Final Environmental Impact Report Renaissance. November 26.<br />
<strong>City</strong> <strong>of</strong> <strong>Inglewood</strong> <strong>General</strong> <strong>Plan</strong> <strong>Update</strong> Technical Background Report<br />
6.6-7
Chapter 6 Community Safety and Hazards<br />
Crime Prevention Programs<br />
The following special programs have been established by the IPD in order to reduce the<br />
occurrence <strong>of</strong> crime and to increase the apprehension <strong>of</strong> criminals: 111<br />
• Canine Unit: <strong>Inglewood</strong>’s canine unit is comprised <strong>of</strong> three general K-9 Teams.<br />
Canines are used to locate and arrest violent <strong>of</strong>fenders, to search buildings and<br />
vehicles, and to detect narcotics.<br />
• Transit Safety Team: This 10-Office unit, supported by transit funds, is charged with<br />
law enforcement affecting public transportation and transportation corridors.<br />
• Anti-Crime Team (A.C.T.): This 20-Officer special enforcement field unit was<br />
established in 1989. This unit continues to be funded through a special assessment<br />
district, which was passed with 79 percent voter approval. The A.C.T. provides<br />
enhanced enforcement aimed at reducing drugs and gang violence. The A.C.T.<br />
includes a four-Officer bicycle team.<br />
• <strong>Inglewood</strong> Community Affairs Section: Established with one <strong>of</strong> the first recent federal<br />
grants to local law enforcement, this 5-person division identifies and develops<br />
strategies to deal with community problems. Each <strong>of</strong> the <strong>City</strong>’s four “beats” is<br />
assigned a Senior Lead Officer and an Assistant Lead Officer, who staff<br />
Neighborhood Public Safety Centers in each quadrant. These community centers<br />
are currently operating in three <strong>of</strong> the four police beats, identified in Figure 6.6-1.<br />
• Neighborhood Watch: Citizens in over 200 Neighborhood Watch Block Clubs<br />
throughout the <strong>City</strong> exist to join the police department in taking active steps<br />
toward crime prevention and apprehension <strong>of</strong> criminals.<br />
• Commercial Security Program: This business equivalent to the Neighborhood Watch<br />
concentrates on crime prevention in businesses.<br />
The <strong>City</strong> <strong>of</strong> <strong>Inglewood</strong> also participates in an international program designed to reduce<br />
the occurrence <strong>of</strong> crime. The CPTED (Crime Prevention through Environmental<br />
Design) promotes the development <strong>of</strong> design features that discourage crime, while<br />
encouraging legitimate use <strong>of</strong> the environment. The CPTED operates under the basic<br />
premise that the physical environment can be changed or managed to produce behavioral<br />
effects that can reduce the incidence and fear <strong>of</strong> crime, thereby improving the quality <strong>of</strong><br />
life, and enhancing the pr<strong>of</strong>itability for business. Examples <strong>of</strong> CPTED security<br />
techniques encouraged for by the <strong>City</strong> <strong>of</strong> <strong>Inglewood</strong> include: 112<br />
• Territoriality—the provision <strong>of</strong> physical features into new developments, including<br />
fences, lighting, signs, maintenance, and landscaping, which define the space and<br />
work to identify intruders.<br />
• Natural Surveillance—the placement <strong>of</strong> physical features, activities, lighting, and<br />
people in locations that maximize the opportunities for observations and<br />
surveillance.<br />
• Access Control—the placement <strong>of</strong> property location entrances, exits, fencing,<br />
landscaping, and lighting that direct both foot and vehicle traffic ways that<br />
discourage crime.<br />
111 Gruen Associates, 2003. Final Environmental Impact Report Renaissance. November 26.<br />
112 Gruen Associates, 2003. Final Environmental Impact Report Renaissance. November 26.<br />
6.6-8<br />
<strong>City</strong> <strong>of</strong> <strong>Inglewood</strong> <strong>General</strong> <strong>Plan</strong> <strong>Update</strong> Technical Background Report
6.6 Police Services<br />
Future Demands<br />
At present, no information regarding expanding the Police Station has been disclosed.<br />
However, with the constant change in technology, new equipment and additional staff<br />
will be needed to ensure that the Department is equipped to operate in the future. For<br />
example, the new State DNA law requires that <strong>of</strong>fenders are administered an oral swab<br />
(buccal specimen) to secure a DNA specimen. To administer oral swabs and process<br />
DNA specimens, the Department needs additional storage space and personnel.<br />
Projected future needs include updated computers, vehicles, video equipment, weapons,<br />
and additional sworn and civilian staff. 113 Currently the Department has 13 vacant<br />
positions to fill for police <strong>of</strong>ficer, which it plans on filling as qualified <strong>of</strong>ficers apply. The<br />
Department also plans on purchasing 11 new police cars, which are budgeted for next<br />
year, however many would be replacing aged vehicles. The Department has a number <strong>of</strong><br />
cars with over 100 thousand miles, which should have been replaced between 30 and 60<br />
thousand miles.<br />
• Issues<br />
• The existing Police Department is insufficient to accommodate the staffing and<br />
equipment that it currently has and needs. The Department has been using <strong>City</strong><br />
Hall to house some <strong>of</strong> its divisions.<br />
• The Department has a number <strong>of</strong> cars with over 100 thousand miles, which should<br />
have been replaced between 30 and 60 thousand miles. While the Department has<br />
plans to purchase 11 new police cars, many would be replacements <strong>of</strong> aged vehicles<br />
as opposed to increasing the supply <strong>of</strong> police cars.<br />
• The <strong>Inglewood</strong> Police Department does not set a minimum service ratio. As new<br />
development occurs and the <strong>City</strong>’s population increases, adequate <strong>of</strong>fice response<br />
times should be ensured in order to respond sufficiently to emergency calls.<br />
• The need for adequate and steady funding for new <strong>of</strong>ficers, facilities and equipment<br />
remains an ongoing issue.<br />
• References<br />
Gruen Associates, 2003. Final Environmental Impact Report Renaissance. November 26.<br />
<strong>Inglewood</strong>, <strong>City</strong> <strong>of</strong>. 2006. Website: www.city<strong>of</strong>inglewood, April.<br />
Sissac, Lieutenant Martin J., ASB Adjutant, <strong>Inglewood</strong> Police Department, 2006. Personal<br />
communication, March 29.<br />
113 Lieutenant Martin J. Sissac, <strong>Inglewood</strong> Police Department, 2006. Personal communication, March 29.<br />
<strong>City</strong> <strong>of</strong> <strong>Inglewood</strong> <strong>General</strong> <strong>Plan</strong> <strong>Update</strong> Technical Background Report<br />
6.6-9
6.7 Fire Services<br />
6.7 FIRE SERVICES<br />
This section provides information on existing fire and emergency services within the <strong>City</strong>.<br />
In addition, current staffing, equipment, response times, and standards <strong>of</strong> these services<br />
are described. It is important to note that and urban fire hazards are discussed in<br />
Section 6.4 (Fire Hazards) <strong>of</strong> this Technical Background Report. Information for this<br />
section was obtained from personal communication with the Los Angeles County Fire<br />
Department and information provided on the Los Angeles County Fire Department<br />
website.<br />
• Existing Conditions<br />
The <strong>City</strong> <strong>of</strong> <strong>Inglewood</strong> receives fire protection and paramedic services from the County<br />
<strong>of</strong> Los Angeles Consolidated Fire Protection District, also known as the Los Angeles<br />
County Fire Department (LACFD). The LACFD assumed fire protection and paramedic<br />
responsibility from the <strong>City</strong> <strong>of</strong> <strong>Inglewood</strong> Fire Department on November 1 st , 2000. The<br />
LACFD currently provides the same emergency services previously provided by the<br />
<strong>Inglewood</strong> Fire Department. 114 Services include fire suppression, hazardous materials<br />
protection, emergency medical treatment including basic and advanced life support<br />
transportation, earthquake and fire safety planning, fire inspections and building plan<br />
reviews. 115<br />
Fire Stations, Equipment, and Staffing<br />
The <strong>City</strong> <strong>of</strong> <strong>Inglewood</strong> belongs to Battalion 20 within Division 6 <strong>of</strong> the County <strong>of</strong> Los<br />
Angeles Consolidated Fire Protection District. Battalion 20 operates a total <strong>of</strong> six<br />
stations, five <strong>of</strong> these serve the <strong>City</strong> <strong>of</strong> <strong>Inglewood</strong>. Of these stations, four are located<br />
within the <strong>City</strong> <strong>of</strong> <strong>Inglewood</strong>, as shown in Table 6.7-1, and one is located within the<br />
unincorporated County territory <strong>of</strong> Lennox. The locations <strong>of</strong> each <strong>of</strong> the fire stations in<br />
the <strong>City</strong> are identified in Figure 6.7-1. Table 6.7-1 provides information on each fire<br />
station that serves the <strong>City</strong>, including location, amount and type <strong>of</strong> equipment, and<br />
staffing levels. 116<br />
As <strong>of</strong> March 2006, Battalion 20 employed approximately 75 full-time staff among the five<br />
different fire stations that serve the <strong>City</strong>. The five stations are manned in three rotating<br />
shifts (A, B, or C). A three-platoon schedule is based on 24-hour shifts that start at<br />
8:00 A.M. Rotation is every other day for three days, and then two days <strong>of</strong>f, and again<br />
every other day for three days with four days <strong>of</strong>f at the end. There are a total <strong>of</strong> ten shifts<br />
per month. 117<br />
114 Gruen Associates, 2003. Final Environmental Impact Report Renaissance. November 26.<br />
115 Gruen Associates, 2003. Final Environmental Impact Report Renaissance. November 26.<br />
116 Bennett, Mark J., Acting Assistant Fire Chief, 2006. Personal communication.March 14.<br />
117 Bennett, Mark J., Acting Assistant Fire Chief, 2006. Personal communication.March 14.<br />
<strong>City</strong> <strong>of</strong> <strong>Inglewood</strong> <strong>General</strong> <strong>Plan</strong> <strong>Update</strong> Technical Background Report<br />
6.7-1
Chapter 6 Community Safety and Hazards<br />
Table 6.7-1<br />
<strong>Inglewood</strong> Fire Stations<br />
Station No. Location Equipment Staffing<br />
Station<br />
170<br />
Station<br />
171<br />
Station<br />
172<br />
Station<br />
173<br />
Station<br />
18<br />
10701 S. Crenshaw<br />
Boulevard<br />
141 W. Regent<br />
Street<br />
810 Centinela<br />
Avenue<br />
9001 S. Crenshaw<br />
Boulevard<br />
4518 W. Lennox<br />
Boulevard<br />
(unincorporated<br />
territory)<br />
Assessment light force: 4-<br />
person truck company<br />
2-person engine responding as<br />
a unit<br />
3-person engine company<br />
2-person paramedic squad<br />
3-person engine company<br />
2-person paramedic squad<br />
3-person engine company<br />
2-person paramedic squad<br />
4-person paramedic engine<br />
company<br />
SOURCE: Mark J. Bennett, Acting Assistant Fire Chief, March 14, 2006.<br />
Truck: captain, firefighter<br />
specialist, two firefighters;<br />
engine: firefighter specialist,<br />
and one<br />
firefighter/paramedic<br />
Captain, firefighter specialist,<br />
firefighter, 2 paramedics,<br />
Battalion Chief, Deputy fire<br />
chief<br />
Captain, firefighter specialist,<br />
firefighter, 2 paramedics<br />
Captain, firefighter specialist,<br />
firefighter, 2 paramedics<br />
Captain, a firefighter<br />
specialist, 2<br />
firefighters/paramedics<br />
Standard company staffing is generally as follows: a minimum <strong>of</strong> 25 personnel per shift in<br />
suppression. An Assistant Deputy Chief oversees each <strong>of</strong> the three divisions. The <strong>of</strong>fice<br />
<strong>of</strong> the Assistant Deputy Chief that oversees Division 6 is located in Huntington Park. 118<br />
As depicted in Table 6.7-1 above, staffing on each unit is as follows:<br />
• A 3-person company consists <strong>of</strong> a captain, a firefighter specialist, and a firefighter.<br />
• A 4-person company is staffed with a captain, a firefighter specialist, and two<br />
firefighters. On a paramedic engine company, the two firefighters are also<br />
paramedics<br />
• A light force (defined as two apparatus assigned together under one captain)<br />
contains two units (a truck and an engine) that respond in tandem. The truck is<br />
staffed with a captain, a firefighter specialist and two firefighters, and the engine on<br />
the light force is staffed with a firefighter specialist and one firefighter. Since Light<br />
Force 170 is an assessment unit, one <strong>of</strong> the firefighters is also a paramedic.<br />
• A paramedic squad has 2 firefighter paramedics.<br />
118 Bennett, Mark J., Acting Assistant Fire Chief, 2006. Personal communication.March 14.<br />
6.7-2<br />
<strong>City</strong> <strong>of</strong> <strong>Inglewood</strong> <strong>General</strong> <strong>Plan</strong> <strong>Update</strong> Technical Background Report
CITY <strong>of</strong> INGLEWOOD<br />
<strong>General</strong> <strong>Plan</strong><br />
FIRE STATIONS<br />
Legend<br />
<strong>City</strong> Boundary<br />
Fire Station<br />
Water Body<br />
Metro Rail<br />
Railroad<br />
Source: <strong>City</strong> <strong>of</strong> <strong>Inglewood</strong>, February 2006.<br />
Date: April 3, 2006<br />
A Division <strong>of</strong><br />
Miles<br />
0 0.25 0.5<br />
Figure 6.7-1
6.7 Fire Services<br />
Fire and Medical Incidents<br />
In 2005, the five stations serving <strong>Inglewood</strong> responded to 10,505 emergency incidents, <strong>of</strong><br />
which 8,299 (79 percent) were medical emergency responses. Divided equally, this<br />
equates to approximately 1,660 responses per station, which is well within the number <strong>of</strong><br />
calls recommended by the Insurance Service Office (ISO) when rating a community for<br />
fire insurance rates. 119 The ISO provides rating and statistical information for the<br />
insurance industry in the United States. Specifically, the ISO recommends that a second<br />
company be put in service in a fire station if that station receives more than 2,500 calls<br />
per year. The purpose <strong>of</strong> the ISO’s recommendation is to assure reliability <strong>of</strong> response<br />
time to a structure fire.<br />
Due to the size <strong>of</strong> the LACFD, the Battalion that serves <strong>Inglewood</strong> can easily draw from<br />
the depth <strong>of</strong> resources available around the County, including within its own division that<br />
has additional stations in adjacent unincorporated areas and within the neighboring cities<br />
<strong>of</strong> Hawthorne and Gardena. According to the LACFD, Fire Station 18, which is within<br />
Battalion 20 but outside <strong>City</strong> limits, would be the closest unit available to service<br />
<strong>Inglewood</strong> if a need should arise. 120<br />
Fires in <strong>Inglewood</strong> represent a small portion <strong>of</strong> all calls in <strong>Inglewood</strong>. The Division<br />
reports that no particular area <strong>of</strong> the <strong>City</strong> experiences an unusual number <strong>of</strong> fires and no<br />
particular factor is responsible for causing the fires. High-rise developments, however,<br />
have the potential to cause more difficulty in fighting fire due to the need to provide<br />
more resources. Other calls to the Division include miscellaneous problems such as<br />
hazardous materials incident or a water rescue. 121<br />
Response Times and Protocol<br />
The existing service level in <strong>Inglewood</strong> is adequate for the existing conditions. The<br />
LACFD uses nationally-accepted guidelines for response times in urban areas: 5 minutes<br />
for a first-responding or basic life support unit (usually an engine company) and<br />
8 minutes for an advanced life support (paramedic) unit. <strong>Inglewood</strong> had 10,505<br />
emergency incidents in 2005, <strong>of</strong> which 79 percent were medical. The average emergency<br />
response time was 4 minutes 22 seconds. There were additionally 440 non-emergency<br />
incidents with an average response time <strong>of</strong> 6 minutes 21 seconds. 122<br />
Mutual Aid Agreements<br />
In addition to providing service within the <strong>City</strong> <strong>of</strong> <strong>Inglewood</strong>, the LACFD also<br />
participates in automatic and mutual aid services with neighboring jurisdictions. Units<br />
from stations located outside <strong>Inglewood</strong> respond to calls on a daily basis. Under the<br />
119 Bennett, Mark J., Acting Assistant Fire Chief, 2006. Personal communication.March 14.<br />
120 Bennett, Mark J., Acting Assistant Fire Chief, 2006. Personal communication.March 14.<br />
121 Bennett, Mark J., Acting Assistant Fire Chief, 2006. Personal communication.March 14.<br />
122 Bennett, Mark J., Acting Assistant Fire Chief, 2006. Personal communication.March 14.<br />
<strong>City</strong> <strong>of</strong> <strong>Inglewood</strong> <strong>General</strong> <strong>Plan</strong> <strong>Update</strong> Technical Background Report<br />
6.7-5
Chapter 6 Community Safety and Hazards<br />
LACFD service concept, emergency units are dispatched as needed to an incident<br />
anywhere in the LACFD’s service territory based on the distance and availability, without<br />
regard to municipal boundaries. The LACFD has ten fire stations within three miles <strong>of</strong><br />
the <strong>Inglewood</strong> city limits. These fire stations are located within the cities <strong>of</strong> Hawthorne,<br />
Gardena, and Lawndale and within the unincorporated communities <strong>of</strong> West Athens,<br />
Lennox and Baldwin Hills. 123<br />
Therefore, there are ample resources available to respond to a large incident or multiple<br />
simultaneous incidents in <strong>Inglewood</strong> without the need to request mutual aid from other<br />
fire protection agencies. 124 The ability to manage and control major fires or other<br />
emergencies is enhanced by the Standardized Emergency Management System (SEMS).<br />
Further information on SEMS is provided in Section 6.8 (Emergency Preparedness) <strong>of</strong><br />
this TBR.<br />
Projected Needs<br />
Currently, there are no plans to expand services in the city <strong>of</strong> <strong>Inglewood</strong>. The LACFD<br />
does not maintain population or growth projections. <strong>Inglewood</strong> contracts with the<br />
County <strong>of</strong> Los Angeles for fire protection services on a fee-for-service basis. As such, any<br />
changes in Fire Department staffing, equipment, or facilities would be implemented as a<br />
result <strong>of</strong> periodic contract negotiations between the <strong>City</strong> and the LACFD. 125<br />
• Regulatory Setting<br />
Several federal, state, and local ordinances and programs affect fire protection in<br />
<strong>Inglewood</strong>. These are listed under the Regulatory Context <strong>of</strong> Section 6.4 (Fire Hazards)<br />
<strong>of</strong> this Technical Background Report.<br />
• Issues<br />
• No issues have been identified related to fire services.<br />
• References<br />
Bennett, Mark J. Acting Assistant Fire Chief, Division VI, Los Angeles County Fire<br />
Department, 2006. Personal communication, March 16.<br />
Gruen Associates, 2003. Final Environmental Impact Report Renaissance. November 26.<br />
123 Bennett, Mark J., Acting Assistant Fire Chief, 2006. Personal communication.March 14.<br />
124 Bennett, Mark J., Acting Assistant Fire Chief, 2006. Personal communication.March 14.<br />
125 Bennett, Mark J., Acting Assistant Fire Chief, 2006. Personal communication.March 14.<br />
6.7-6<br />
<strong>City</strong> <strong>of</strong> <strong>Inglewood</strong> <strong>General</strong> <strong>Plan</strong> <strong>Update</strong> Technical Background Report
6.8 Emergency Preparedness<br />
6.8 EMERGENCY PREPAREDNESS<br />
This section provides information on the existing emergency response services in the <strong>City</strong><br />
<strong>of</strong> <strong>Inglewood</strong> that are provided by the Los Angeles County Fire Department.<br />
Information provided within this section was obtained from the <strong>City</strong>’s 1999 Multi-Hazard<br />
Function <strong>Plan</strong> (Emergency <strong>Plan</strong>) and the 2004 <strong>City</strong> <strong>of</strong> <strong>Inglewood</strong> Hazard Mitigation <strong>Plan</strong>.<br />
• Existing Conditions<br />
The Emergency <strong>Plan</strong> addresses the <strong>City</strong>’s planned response to extraordinary emergency<br />
situations associated with natural disasters, technological incidents, and nuclear defense<br />
operations. The operational concepts reflected in the Emergency <strong>Plan</strong> focus on potential<br />
large-scale disasters which can generate unique situations requiring unusual emergency<br />
responses. Such disasters pose major threats to life and property and can impact the wellbeing<br />
<strong>of</strong> large numbers <strong>of</strong> people. The Emergency <strong>Plan</strong> is considered a preparedness<br />
document, and is designed to include the <strong>City</strong> as a part <strong>of</strong> a statewide emergency response<br />
organization and also to conform to the California Standardized Emergency Management<br />
System (SEMS).<br />
The Hazard Mitigation <strong>Plan</strong> is intended to augment the <strong>City</strong>’s Emergency Operations<br />
<strong>Plan</strong> and Procedures, and is to be considered when updating or revising other <strong>City</strong> policy<br />
documents including, but not limited to, the <strong>General</strong> <strong>Plan</strong>, and all <strong>of</strong> its required<br />
Elements. The purpose <strong>of</strong> the Hazard Mitigation <strong>Plan</strong> is to provide direction and<br />
guidance to <strong>City</strong> departments and the public concerning mitigation measures to lessen the<br />
risk <strong>of</strong> various hazards that threaten the <strong>City</strong> <strong>of</strong> <strong>Inglewood</strong>.<br />
<strong>City</strong> <strong>of</strong> <strong>Inglewood</strong> Multi-Functional Hazard <strong>Plan</strong><br />
The Basic <strong>Plan</strong> (<strong>of</strong> the Emergency <strong>Plan</strong>) addresses the <strong>City</strong>’s planned response to<br />
emergencies associated with natural disasters and technological incidents—including both<br />
peacetime and wartime nuclear defense operations. It provides an overview <strong>of</strong> operational<br />
concepts, identifies components <strong>of</strong> the <strong>City</strong>’s emergency management organization within<br />
the SEMS, and describes the overall responsibilities <strong>of</strong> the federal, state, and county<br />
entities and the <strong>City</strong> for protecting life and property, and assuring the overall well-being<br />
<strong>of</strong> the population. The Hazard Identification and Analysis section <strong>of</strong> the Emergency <strong>Plan</strong><br />
identifies hazards that could occur within the <strong>City</strong> including: major earthquakes,<br />
hazardous materials, flooding, dam failure, transportation incidents, train derailment,<br />
trucking incident, and Metroline incidents.<br />
Operations during peacetime and national security emergencies involve a full spectrum <strong>of</strong><br />
activities from a minor incident, to a major earthquake, to a nuclear detonation. There are<br />
a number <strong>of</strong> similarities in operational concepts for peacetime and national security<br />
emergencies. Some emergencies will be preceded by a build-up or warning period,<br />
providing sufficient time to warn the population and implement mitigation measures<br />
designed to reduce loss <strong>of</strong> life and property damage. Other emergencies occur with little<br />
<strong>City</strong> <strong>of</strong> <strong>Inglewood</strong> <strong>General</strong> <strong>Plan</strong> <strong>Update</strong> Technical Background Report<br />
6.8-1
Chapter 6 Community Safety and Hazards<br />
or no advance warning, thus requiring immediate activation <strong>of</strong> the emergency operations<br />
plan and commitment <strong>of</strong> resources. All agencies must be prepared to respond promptly<br />
and effectively to any foreseeable emergency, including the provision and utilization <strong>of</strong><br />
mutual aid.<br />
Emergency management activities during peacetime and national security emergencies are<br />
<strong>of</strong>ten associated with the four emergency management phases identified below. However,<br />
not every disaster necessarily includes all indicated phases.<br />
Preparedness Phase<br />
The preparedness phase involves activities taken in advance <strong>of</strong> an emergency. These<br />
activities develop operational capabilities and effective responses to a disaster. These<br />
actions might include mitigation activities, emergency/disaster planning, training and<br />
exercises, and public education. Agencies that have either a primary or support mission<br />
relative to response and recovery should prepare Standard Operating Procedures<br />
(SOPs)/Emergency Operating Procedures (EOPs) and checklists detailing personnel<br />
assignments, policies, notification rosters, and resource lists. Increased readiness during<br />
this phase could include the following actions: review and update <strong>of</strong> emergency plans;<br />
dissemination <strong>of</strong> accurate and timely emergency public information; accelerated training;<br />
recruitment; mobilization <strong>of</strong> resources; and testing warning and communication systems.<br />
Response Phase<br />
The response phase is divided into two phases, as follows:<br />
Pre-Emergency<br />
When a disaster is inevitable, actions are precautionary and emphasize protection <strong>of</strong> life.<br />
Typical responses might include the following:<br />
• Evacuation <strong>of</strong> threatened populations to safe areas.<br />
• Advising threatened populations <strong>of</strong> the emergency and apprising them <strong>of</strong> safety<br />
measures to be implemented.<br />
• Advising the Los Angeles County Operational Area <strong>of</strong> the emergency.<br />
• Identifying the need for mutual aid and requesting such through the Los Angeles<br />
County Operational Area via the Lennox Sheriff’s Station.<br />
• Proclamation <strong>of</strong> a Local Emergency by local authorities.<br />
Emergency Response<br />
During the Emergency Response phase, emphasis is placed on saving lives and property,<br />
control <strong>of</strong> the situation and minimizing effects <strong>of</strong> the disaster. Immediate response is<br />
accomplished within the affected area by local government agencies and segments <strong>of</strong> the<br />
private sector.<br />
6.8-2<br />
<strong>City</strong> <strong>of</strong> <strong>Inglewood</strong> <strong>General</strong> <strong>Plan</strong> <strong>Update</strong> Technical Background Report
6.8 Emergency Preparedness<br />
When local resources are committed to the maximum and additional resources are<br />
required, requests for mutual aid will be initiated through the Los Angeles County<br />
Operational Area. Fire and law enforcement agencies will request or render mutual aid<br />
directly through established channels. If required, State Office <strong>of</strong> Emergency Services<br />
(OES) may coordinate the establishment <strong>of</strong> one or more Disaster Support Areas (DSAs)<br />
where resources and supplies can be received, stockpiled, allocated, and dispatched to<br />
support operations in the affected area(s).<br />
Depending on the severity <strong>of</strong> the emergency, a Local Emergency may be proclaimed, the<br />
local Emergency Operating Center (EOC) may be activated, and Los Angeles County<br />
Operational Area will be advised. The State OES Director may request a gubernatorial<br />
proclamation <strong>of</strong> a State <strong>of</strong> Emergency, where state agencies would then respond to<br />
requests for assistance.<br />
Recovery Phase<br />
As soon as possible, the State OES Director will bring together representatives <strong>of</strong> federal,<br />
state, county, and city agencies, as well as representatives <strong>of</strong> the American Red Cross, to<br />
coordinate the implementation <strong>of</strong> assistance programs and establishment <strong>of</strong> support<br />
priorities. Disaster Application Centers (DACs) may also be established, providing a<br />
“one-stop” service to initiate the process <strong>of</strong> receiving federal, state, and local recovery<br />
assistance. The recovery period has major objectives, which may overlap, including the<br />
following:<br />
• Reinstatement <strong>of</strong> family autonomy<br />
• Provision <strong>of</strong> essential public services<br />
• Permanent restoration <strong>of</strong> private and public property<br />
• Identification <strong>of</strong> residual hazards<br />
• <strong>Plan</strong>s to mitigate future hazards<br />
• Recovery <strong>of</strong> costs associated with response and recovery efforts<br />
Mitigation Phase<br />
Mitigation efforts occur both before and following disaster events. Post-disaster<br />
mitigation is part <strong>of</strong> the recovery process. Eliminating or reducing the impact <strong>of</strong> hazards<br />
which exist within the <strong>City</strong> and are a threat to life and property are part <strong>of</strong> the mitigation<br />
efforts. Mitigation tools include:<br />
• Local ordinances and statutes (zoning ordinance, building codes and enforcement,<br />
etc.)<br />
• Structural measures<br />
• Tax levee or abatements<br />
• Public information and community relations<br />
• Land use planning<br />
• Pr<strong>of</strong>essional training<br />
<strong>City</strong> <strong>of</strong> <strong>Inglewood</strong> <strong>General</strong> <strong>Plan</strong> <strong>Update</strong> Technical Background Report<br />
6.8-3
Chapter 6 Community Safety and Hazards<br />
Peacetime Emergencies<br />
The <strong>City</strong>’s partial or total response to natural disasters or technological incidents will be<br />
dictated by the type and magnitude <strong>of</strong> the emergency. <strong>General</strong>ly, response to a major<br />
peacetime emergency situation will progress from local, to county, to state, to federal<br />
involvement.<br />
For planning purposes, State OES has established three levels <strong>of</strong> emergency response to<br />
peacetime emergencies, which are based on the severity <strong>of</strong> the situation and the<br />
availability <strong>of</strong> local resources.<br />
Level One—Decentralized Coordination and Direction<br />
This phase includes a minor to moderate incident wherein local resources are adequate<br />
and available. A Local Emergency may or may not be proclaimed, and the <strong>City</strong> EOC may<br />
or may not be activated. Off-duty personnel may be recalled.<br />
Level Two—Centralized Coordination and Decentralized Direction<br />
This phase includes a moderate to severe emergency wherein local resources are not<br />
adequate and mutual aid may be required on a regional or even statewide basis. Key<br />
management level personnel from the principal involved agencies will co-locate in a<br />
central location to provide jurisdictional or multi-jurisdictional coordination. The EOC<br />
should be activated, and <strong>of</strong>f-duty personnel may be recalled. A Local Emergency will be<br />
proclaimed and a State <strong>of</strong> Emergency may be proclaimed.<br />
Level Three—Centralized Coordination and Direction<br />
This phase include a major local or regional disaster wherein resources in or near the<br />
impacted area are overwhelmed and extensive state and/or federal resources are required.<br />
A Local Emergency and a State <strong>of</strong> Emergency will be proclaimed and a Presidential<br />
Declaration <strong>of</strong> an Emergency or Major Disaster will be requested. All response and early<br />
recovery activities will be directed from the EOC, and all <strong>of</strong>f-duty personnel will be<br />
recalled.<br />
Standardized Emergency Management System<br />
The SEMS is a procedure for integrating emergency response functions. It sets forth a<br />
system and framework within which response agencies that utilize the SEMS can function<br />
in an integrated fashion, in effect becoming a single response entity. The SEMS outlines a<br />
chain <strong>of</strong> authority (command) for organization <strong>of</strong> all public emergency response<br />
functions within the State.<br />
The SEMS has been adopted by the <strong>City</strong> <strong>of</strong> <strong>Inglewood</strong> for managing response to multiagency<br />
and multi-jurisdiction emergencies and to facilitate communications and<br />
coordination between all levels <strong>of</strong> the system and among all responding agencies. When<br />
fully activated, the SEMS consists <strong>of</strong> five organizational levels, which are activated as<br />
6.8-4<br />
<strong>City</strong> <strong>of</strong> <strong>Inglewood</strong> <strong>General</strong> <strong>Plan</strong> <strong>Update</strong> Technical Background Report
6.8 Emergency Preparedness<br />
necessary: field response, local government, operational areas (countywide), OES Mutual<br />
Aid Regions, and State OES.<br />
As its name implies, the SEMS provides guidelines for standardization <strong>of</strong> procedures and<br />
approaches to emergency response; facilitation <strong>of</strong> the flow <strong>of</strong> information and resources<br />
between organizational levels (field, local government, operation area, regional and state);<br />
coordination between responding agencies; and rapid mobilization, deployment, use and<br />
tracking <strong>of</strong> resources. Cities and counties are encouraged to utilize the SEMS in order to<br />
qualify for State funds for emergency response activities.<br />
<strong>City</strong> <strong>of</strong> <strong>Inglewood</strong> Hazard Mitigation <strong>Plan</strong><br />
This section highlights the coordination <strong>of</strong> resources necessary to address potential<br />
emergency hazards in the <strong>City</strong>.<br />
Emergency Operations Organization<br />
In the late 1970s, the <strong>City</strong> established the <strong>Inglewood</strong> Civil Defense and Disaster Council,<br />
which has oversight <strong>of</strong> the <strong>City</strong> Emergency Operations Organization (EOO) through the<br />
Emergency Operations Board (EOB), as discussed in detail below. The EOO is<br />
responsible for oversight, approval, and implementation <strong>of</strong> the <strong>City</strong>’s Local Hazard<br />
Mitigation <strong>Plan</strong>.<br />
The EOO is comprised <strong>of</strong> all agencies <strong>of</strong> the <strong>City</strong> government. However, unlike<br />
traditional departments, the EOO is not located physically in any one place. Rather, it is a<br />
chain <strong>of</strong> command and protocols that integrate the <strong>City</strong>’s emergency operations into a<br />
single operation. It centralizes command and information coordination so as to enable<br />
the chain <strong>of</strong> command to operate efficiently and effectively in deploying resources.<br />
The EOB supervises the EOO emergency preparedness, response and recovery, and is<br />
comprised <strong>of</strong> the heads <strong>of</strong> the <strong>City</strong>’s critical emergency operations agencies (i.e., the<br />
Board <strong>of</strong> Public Works, Fire and Police departments, etc.). The Chief <strong>of</strong> Police acts as<br />
chair <strong>of</strong> the EOB, at the direction <strong>of</strong> the <strong>City</strong> Administrative Officer who is the vice chair<br />
and is responsible for coordinating non-emergency EOO activities. The <strong>City</strong> Attorney is<br />
the legal advisor to the EOB. The Mayor, in time <strong>of</strong> emergency, directs the operational<br />
divisions <strong>of</strong> the EOO.<br />
Each division is responsible for carrying out specific tasks for coordinating emergency<br />
actions which are essential in abating the impacts and limiting the scope <strong>of</strong> a catastrophe;<br />
responding to life threatening situations and safety needs <strong>of</strong> the population; maintaining<br />
and re-establishing essential services, transportation and communication networks; aiding<br />
dislocated people; and planning for recovery.<br />
Various <strong>City</strong> agencies are responsible for coordinating the activities <strong>of</strong> their assigned<br />
divisions. For example, the Traffic Division is responsible for developing plans for the<br />
maintenance <strong>of</strong> traffic control devices, emergency travel routes to be used in the event <strong>of</strong><br />
an emergency, placement <strong>of</strong> barricades as necessary or as directed by the chiefs <strong>of</strong> the<br />
<strong>City</strong> <strong>of</strong> <strong>Inglewood</strong> <strong>General</strong> <strong>Plan</strong> <strong>Update</strong> Technical Background Report<br />
6.8-5
Chapter 6 Community Safety and Hazards<br />
Police and Fire Suppression and Rescue Divisions, direction and control <strong>of</strong> traffic, and<br />
coordination with all other agencies supplying common carrier services.<br />
An Emergency Management Committee (EMC) provides staff to support the EOB. The<br />
EMC develops plans and programs and conducts training exercises to promote integrated<br />
disaster planning, response and mitigation efforts. An EOC <strong>of</strong> the EOO provides a<br />
centralized coordination facility for emergency response activities. The EOC is located<br />
underground and is equipped with vital communications and backup power, food, and<br />
other supplies necessary to provide for the needs <strong>of</strong> the EOO emergency response<br />
coordinating team. A mobile EOC unit is available in the event the primary center is<br />
inaccessible or to provide additional disaster response coordination capability. It is<br />
comprised <strong>of</strong> a van that contains portable <strong>of</strong>fices, communications, self-sustaining power,<br />
and other resources to enable the mobile EOC unit to operate at any location to which it<br />
is sent.<br />
In the event <strong>of</strong> a disaster or emergency, the Mayor assumes emergency powers, as defined<br />
by law. <strong>City</strong> agencies follow procedures contained in their emergency plans, under the<br />
direction <strong>of</strong> the Mayor and Chief <strong>of</strong> Police, pursuant to EOO protocols set forth in the<br />
EOO ordinance and plans.<br />
Interagency Coordination<br />
Multi-Jurisdictional <strong>Plan</strong>ning<br />
<strong>City</strong> staff coordinates with other jurisdictions and regional agencies through the Office <strong>of</strong><br />
Emergency Services Mutual Aid areas and planning efforts.<br />
Mutual Aid Agreements<br />
Both informal and formal mutual aid arrangements have been developed between<br />
agencies and jurisdictions in the Los Angeles area. Typically, these agreements enable the<br />
closest available unit to respond to an emergency incident, which assures public safety,<br />
protection, and other assistance services. Mutual aid agreements provide for voluntary<br />
cooperative efforts and for provision or receipt <strong>of</strong> services and aid to or from other<br />
agencies or jurisdictions when local capabilities are exceeded by an emergency event.<br />
Through mutual aid agreements, the EOO and individual <strong>City</strong> agencies coordinate<br />
emergency response planning with adjacent cities, the County <strong>of</strong> Los Angeles, the State,<br />
federal agencies and other public and private organizations, such as School Districts and<br />
the American Red Cross. In addition, they share information so as to improve hazard<br />
mitigation efforts and coordinate resources for disaster response and recovery. For<br />
example, in the event <strong>of</strong> a disaster, Los Angeles County is required by State law to<br />
provide the <strong>City</strong> with coroner, health, mental health, prosecutorial, court and children’s<br />
services.<br />
The Governor’s Office <strong>of</strong> Emergency Services (OES) is designated by law to provide<br />
coordination and State resources to regions or local areas that are declared disaster areas<br />
6.8-6<br />
<strong>City</strong> <strong>of</strong> <strong>Inglewood</strong> <strong>General</strong> <strong>Plan</strong> <strong>Update</strong> Technical Background Report
6.8 Emergency Preparedness<br />
by the Governor. The Los Angeles area, in which the <strong>City</strong> <strong>of</strong> <strong>Inglewood</strong> is situated, falls<br />
in the Southern Region <strong>of</strong> the State <strong>of</strong> California’s three regions as defined by the OES.<br />
Specifically, the <strong>City</strong> is in Area G <strong>of</strong> the Southern Region <strong>of</strong> the state Mutual Aid<br />
emergency management areas.<br />
The Federal Emergency Management Agency (FEMA) is designated by federal law to<br />
coordinate and provide Federal resources to state and local governments relative to<br />
disasters declared by the President. The Public Works Mutual Aid Agreement, conceived<br />
by Los Angeles County in the late 1980s, provides for sharing <strong>of</strong> personnel and public<br />
works equipment between signatory cities and counties within the State during times <strong>of</strong><br />
emergency.<br />
Private Organizations<br />
In addition to agreements between government entities, private organizations play a key<br />
role in disaster planning and response. In particular, the American Red Cross, Salvation<br />
Army, churches and other non-pr<strong>of</strong>it organizations provide food, shelter, clothing, health<br />
care, volunteer labor and other emergency services to disaster victims, in coordination<br />
with the governmental agencies. A variety <strong>of</strong> private sector organizations coordinate<br />
community emergency preparedness efforts, to heighten public awareness and<br />
understanding <strong>of</strong> the need for disaster preparedness and to encourage private disaster<br />
preparedness activities. <strong>City</strong> park facilities as well as Hollywood Park and <strong>Inglewood</strong><br />
Unified School District facilities are the designated assembly and coordination locations<br />
for emergency sheltering and assistance efforts coordinated by the Red Cross, the State<br />
and/or FEMA. In addition, the Red Cross provides interagency emergency response<br />
planning and training support.<br />
<strong>General</strong> Mandates and Guidelines<br />
Local <strong>of</strong>ficials have the authority to declare a local emergency and to invoke emergency<br />
regulations to facilitate response to the emergency. <strong>Plan</strong>ning and preparedness are critical<br />
in mitigating the extent <strong>of</strong> the impacts <strong>of</strong> a disaster, through pre-disaster abatement, predisaster<br />
response preparation, and post-disaster recovery plans. FEMA and the State<br />
identifies local multi-hazard mitigation plans as key tools to assisting local jurisdictions in<br />
prioritizing mitigation programs and projects to prevent or reduce the possible damage<br />
that can be inflicted on the <strong>City</strong> and its residents from the various disasters that threaten<br />
it.<br />
• Regulatory Setting<br />
Federal<br />
Disaster Mitigation Act <strong>of</strong> 2000<br />
In 2000, the Disaster Mitigation Act was signed into law to amend the Robert T. Stafford<br />
Disaster Relief Act <strong>of</strong> 1988. Among other things, this new legislation reinforces the<br />
importance <strong>of</strong> pre-disaster infrastructure mitigation planning to reduce disaster losses<br />
<strong>City</strong> <strong>of</strong> <strong>Inglewood</strong> <strong>General</strong> <strong>Plan</strong> <strong>Update</strong> Technical Background Report<br />
6.8-7
Chapter 6 Community Safety and Hazards<br />
nationwide, and is aimed primarily at the control and streamlining <strong>of</strong> the administration<br />
<strong>of</strong> federal disaster relief and programs to promote mitigation activities. Some <strong>of</strong> the major<br />
provisions <strong>of</strong> the Disaster Mitigation Act <strong>of</strong> 2000 include:<br />
• Funding for pre-disaster mitigation activities.<br />
• Developing experimental multi-hazard maps to better understand risk.<br />
• Establishing state and local government infrastructure mitigation planning<br />
requirements (in North Carolina the program known as AIM—Advance<br />
Infrastructure Mitigation).<br />
• Defining how states can assume more responsibility in managing the Hazard<br />
Mitigation Grant Program (HMGP).<br />
• Adjusting ways in which management costs for projects are funded.<br />
The mitigation planning provisions outlined in Section 322 <strong>of</strong> the Act establish<br />
performance-based standards for mitigation plans and requires states to have a public<br />
assistance program (Advance Infrastructure Mitigation—AIM) to develop county<br />
government plans. The consequence for counties <strong>of</strong> failure to develop an infrastructure<br />
mitigation plan is the chance <strong>of</strong> a reduced federal share <strong>of</strong> damage assistance from<br />
75 percent to 25 percent if the damaged facility has been damaged on more than one<br />
occasion in the preceding ten-year periods by the same type <strong>of</strong> event.<br />
State<br />
Office <strong>of</strong> Emergency Services<br />
The OES serves as the lead State agency for emergency management in California. OES<br />
coordinates the State response to major emergencies in support <strong>of</strong> local government. The<br />
primary responsibility for emergency management resides with local government. Local<br />
jurisdictions first use their own resources and, as they are exhausted, obtain more from<br />
neighboring cities and special districts, the county in which they are located, and other<br />
counties throughout the State through the Statewide Mutual Aid System. In California,<br />
SEMS provides the mechanism by which local government requests assistance. OES<br />
serves as the lead agency for mobilizing the State’s resources and obtaining federal<br />
resources; it also maintains oversight <strong>of</strong> the State’s mutual aid system.<br />
During an emergency, OES coordinates the State’s response efforts. It is also responsible<br />
for collecting, verifying, and evaluating information about the emergency, facilitating<br />
communication with local government and providing affected jurisdictions with<br />
additional resources when necessary. If necessary, OES may task state agencies to<br />
perform work outside their day-to-day and statutory responsibilities.<br />
California Code <strong>of</strong> Regulations, Title 19<br />
Title 19, chapters one through six, <strong>of</strong> the California Code <strong>of</strong> Regulations (CCR)<br />
establishes regulations related to emergency response and preparedness under the OES.<br />
6.8-8<br />
<strong>City</strong> <strong>of</strong> <strong>Inglewood</strong> <strong>General</strong> <strong>Plan</strong> <strong>Update</strong> Technical Background Report
6.8 Emergency Preparedness<br />
Local<br />
As discussed throughout this section, the <strong>City</strong>’s Emergency <strong>Plan</strong> and Hazard Mitigation<br />
<strong>Plan</strong> identify the <strong>City</strong>’s planned response to extraordinary emergency situations. They<br />
provide operational concepts related to various emergency situations, identify<br />
components <strong>of</strong> the local emergency management organization, and describe the <strong>City</strong>’s<br />
overall responsibilities for protecting life and property during an emergency.<br />
• Issues<br />
No issues have been identified related to emergency preparedness.<br />
• References<br />
<strong>City</strong> <strong>of</strong> <strong>Inglewood</strong>, 2004. Hazard Mitigation <strong>Plan</strong>.<br />
<strong>City</strong> <strong>of</strong> <strong>Inglewood</strong>, 1999. Multi-Hazard Functional <strong>Plan</strong>.<br />
<strong>City</strong> <strong>of</strong> <strong>Inglewood</strong> <strong>General</strong> <strong>Plan</strong> <strong>Update</strong> Technical Background Report<br />
6.8-9
6.9 Noise<br />
6.9 NOISE<br />
This Section describes the environmental noise conditions within the <strong>City</strong> <strong>of</strong> <strong>Inglewood</strong>.<br />
Data used in the preparation <strong>of</strong> this Section are based upon various federal and state<br />
sources and existing traffic data provided by Meyer, Mohaddes Associates. In addition,<br />
ambient noise levels in the <strong>City</strong> were quantified by measuring existing noise levels.<br />
• Fundamentals <strong>of</strong> Sound and Environmental Noise<br />
Sound is technically described in terms <strong>of</strong> amplitude (loudness) and frequency (pitch).<br />
The standard unit <strong>of</strong> sound amplitude measurement is the decibel (dB). The decibel scale<br />
is a logarithmic scale that describes the physical intensity <strong>of</strong> the pressure vibrations that<br />
make up any sound. The pitch <strong>of</strong> sound is related to the frequency <strong>of</strong> the pressure<br />
vibration. Since the human ear is not equally sensitive to a given sound level at all<br />
frequencies, a special frequency-dependent rating scale has been devised to relate noise to<br />
human sensitivity. The A-weighted decibel scale (dBA) provides this compensation by<br />
discriminating against frequencies in a manner approximating the sensitivity <strong>of</strong> the human<br />
ear.<br />
Noise is typically defined as unwanted sound. A typical noise environment consists <strong>of</strong> a<br />
base <strong>of</strong> steady “background” noise that is the sum <strong>of</strong> many distant and indistinguishable<br />
noise sources. Superimposed on this background noise is the sound from individual local<br />
sources. These can vary from an occasional aircraft or train passing by to virtually<br />
continuous noise from, for example, traffic on a major roadway. Table 6.9-1 lists<br />
representative noise levels for the environment.<br />
Several rating scales have been developed to analyze the effect <strong>of</strong> community noise on<br />
people. Since environmental noise fluctuates over time, these scales consider that the<br />
effect <strong>of</strong> noise on people is largely dependent upon the total acoustical energy content <strong>of</strong><br />
the noise, as well as the time <strong>of</strong> day when the noise occurs. Noise metrics applicable to<br />
this analysis include the following:<br />
• L eq , the equivalent energy noise level, is the average acoustic energy content <strong>of</strong><br />
noise for a stated period <strong>of</strong> time. Thus, the L eq <strong>of</strong> a time-varying noise and that <strong>of</strong> a<br />
steady noise are the same if they deliver the same acoustic energy to the ear during<br />
exposure. For evaluating community impacts, this rating scale does not vary,<br />
regardless <strong>of</strong> whether the noise occurs during the day or the night. The L eq is a<br />
measure <strong>of</strong> ambient noise levels.<br />
• L dn , the Day-Night Average Level, is a 24-hour average L eq with a 10 dBA<br />
“weighting” added to noise during the hours <strong>of</strong> 10:00 p.m. to 7:00 a.m. to account<br />
for noise sensitivity in the nighttime. The logarithmic effect <strong>of</strong> these additions is<br />
that a 60 dBA 24-hour L eq would result in a measurement <strong>of</strong> approximately<br />
66.4 dBA (L dn ). L dn is a measure <strong>of</strong> community noise levels.<br />
• CNEL, the Community Noise Equivalent Level, is a 24-hour average L eq with a 10<br />
dBA “weighting” added to noise during the hours <strong>of</strong> 10:00 p.m. to 7:00 a.m. and an<br />
additional 5 dBA weighting during the hours <strong>of</strong> 7:00 p.m. to 10:00 p.m. to account<br />
<strong>City</strong> <strong>of</strong> <strong>Inglewood</strong> <strong>General</strong> <strong>Plan</strong> <strong>Update</strong> Technical Background Report<br />
6.9-1
Chapter 6 Community Safety and Hazards<br />
for noise sensitivity in the night and evening, respectively. The logarithmic effect <strong>of</strong><br />
these additions is that a 60 dBA 24-hour L eq would result in a measurement <strong>of</strong><br />
approximately 66.7 dBA (CNEL). CNEL is a measure <strong>of</strong> community noise levels.<br />
• L min , the minimum instantaneous noise level experienced during a given period <strong>of</strong><br />
time.<br />
• L max , the maximum instantaneous noise level experienced during a given period <strong>of</strong><br />
time.<br />
Table 6.9-1 Representative Environmental Noise Levels<br />
Common Outdoor Activities<br />
Noise Level<br />
(dBA)<br />
Common Indoor Activities<br />
—110— Rock Band<br />
Jet Fly-over at 100 feet<br />
—100—<br />
Gas Lawnmower at 3 feet<br />
—90—<br />
Food Blender at 3 feet<br />
Diesel Truck going 50 mph at 50 feet —80— Garbage Disposal at 3 feet<br />
Noisy Urban Area during Daytime<br />
Gas Lawnmower at 100 feet —70— Vacuum Cleaner at 10 feet<br />
Commercial Area<br />
Normal Speech at 3 feet<br />
Heavy Traffic at 300 feet —60—<br />
Large Business Office<br />
Quiet Urban Area during Daytime —50— Dishwasher in Next Room<br />
Quiet Urban Area during Nighttime —40—<br />
Quiet Suburban Area during Nighttime<br />
Quiet Rural Area during Nighttime<br />
Theater, Large Conference Room<br />
(background)<br />
—30— Library<br />
Bedroom at Night, Concert Hall<br />
(background)<br />
—20—<br />
Broadcast/Recording Studio<br />
—10—<br />
Lowest Threshold <strong>of</strong> Human Hearing —0— Lowest Threshold <strong>of</strong> Human Hearing<br />
SOURCE: California Department <strong>of</strong> Transportation, 1998<br />
Noise environments and consequences <strong>of</strong> human activities are usually well represented by<br />
median noise levels during the day, night, or over a 24-hour period. Environmental noise<br />
levels are generally considered low when CNEL is below 60 dBA, moderate in the 60 to<br />
70 dBA range, and high above 70 dBA. Examples <strong>of</strong> low daytime noise levels are isolated<br />
natural settings that can provide noise levels as low as 20 dBA and quiet, suburban,<br />
residential streets that can provide noise levels around 40 dBA. Examples <strong>of</strong> moderatelevel<br />
noise environments are urban residential or semi-commercial areas (typically 55 to<br />
6.9-2<br />
<strong>City</strong> <strong>of</strong> <strong>Inglewood</strong> <strong>General</strong> <strong>Plan</strong> <strong>Update</strong> Technical Background Report
6.9 Noise<br />
60 dBA) and commercial locations (typically 60 dBA). Higher levels are usually associated<br />
with more noisy urban residential or residential-commercial areas (typically 60 to 75 dBA)<br />
or dense urban or industrial areas (typically 65 to 80 dBA).<br />
When evaluating changes in community noise levels, a difference <strong>of</strong> three dBA in noise<br />
levels is barely perceptible to most people. A five dBA change is readily noticeable, while<br />
a difference <strong>of</strong> 10 dBA would be perceived as a doubling <strong>of</strong> loudness.<br />
Noise levels from a particular source decline as distance to the receptor increases. Other<br />
factors, such as weather and reflecting or shielding, also help intensify or reduce the noise<br />
level at any given location. A commonly used rule <strong>of</strong> thumb for roadway noise is that for<br />
every doubling <strong>of</strong> distance from the source, the noise level is reduced by about three dBA<br />
at acoustically “hard” locations (i.e., the area between the noise source and the receptor is<br />
nearly complete asphalt, concrete, hard-packed soil, or other solid materials) and 4.5 dBA<br />
at acoustically “s<strong>of</strong>t” locations (i.e., the area between the source and receptor is normal<br />
earth or has vegetation, including grass). Noise from stationary or point sources is<br />
reduced by about 6 to 7.5 dBA for every doubling <strong>of</strong> distance at acoustically hard and s<strong>of</strong>t<br />
locations, respectively. Noise levels may also be reduced by intervening structures;<br />
generally, a single row <strong>of</strong> buildings between the receptor and the noise source reduces the<br />
noise levels by about five dBA, while a solid wall or berm reduces noise levels by five to<br />
ten dBA. The manner in which older homes in California were constructed generally<br />
provides a reduction <strong>of</strong> exterior-to-interior noise levels <strong>of</strong> about 20 to 25 dBA with<br />
closed windows. The exterior-to-interior reduction <strong>of</strong> newer residential units is generally<br />
30 dBA or more.<br />
• Existing Noise Environment<br />
Sources <strong>of</strong> Noise<br />
Land uses within the <strong>City</strong> <strong>of</strong> <strong>Inglewood</strong> include a range <strong>of</strong> residential, commercial,<br />
industrial, institutional, and recreational areas. The primary sources <strong>of</strong> noise within the<br />
<strong>City</strong> are related to transportation and include automobile traffic and aircraft. Noise within<br />
the <strong>City</strong> also occurs from various stationary sources, such as mechanical equipment<br />
associated with building structures, the operation <strong>of</strong> various types <strong>of</strong> commercial<br />
businesses, and sources produced at residential locations. The noise sources are further<br />
described below.<br />
Roadway Sources<br />
The most prevalent source <strong>of</strong> traffic noise within the <strong>City</strong> <strong>of</strong> <strong>Inglewood</strong> is generated on<br />
surface streets. Motor vehicle noise generated by automobiles, motorcycles, trucks, and<br />
buses commonly causes increased sustained noise levels and is <strong>of</strong>ten in close proximity to<br />
sensitive land uses, such as residences. In addition, Interstate 405 and Interstate 105 are<br />
located along portions <strong>of</strong> the western and southern edges <strong>of</strong> the <strong>City</strong>, respectively. These<br />
freeways expose a portion <strong>of</strong> <strong>City</strong> residents to the south and west to higher ambient noise<br />
levels than other residential areas in the <strong>City</strong>.<br />
<strong>City</strong> <strong>of</strong> <strong>Inglewood</strong> <strong>General</strong> <strong>Plan</strong> <strong>Update</strong> Technical Background Report<br />
6.9-3
Chapter 6 Community Safety and Hazards<br />
Major streets in the <strong>City</strong> <strong>of</strong> <strong>Inglewood</strong> include <strong>Inglewood</strong>, Centinela, Florence,<br />
Manchester, La Brea, and Prairie Avenues and Century and Crenshaw Boulevards.<br />
Residential uses near arterial roadways may experience attenuated noise levels from the<br />
presence <strong>of</strong> any large-scale commercial structures separating the residential area from<br />
those arterials, from yard walls or barriers, and from the distance between the roadway<br />
and the residential structures. The noise attenuation features <strong>of</strong> new residential uses are<br />
reviewed on a project-by-project basis as part <strong>of</strong> the <strong>City</strong>’s development review process.<br />
As new residential projects are proposed near major roadways or other potential noise<br />
sources, future noise levels can be evaluated and noise mitigation strategies required as<br />
appropriate to meet <strong>City</strong> noise standards.<br />
Aircraft Sources<br />
Land uses within the <strong>City</strong> <strong>of</strong> <strong>Inglewood</strong> are affected by aircraft approaches, and<br />
departures to a lesser extent, at the Los Angeles International Airport (LAX). In addition,<br />
aircraft activity at the Hawthorne Municipal Airport may occasionally affect residential<br />
uses located in the southern portion <strong>of</strong> the <strong>City</strong>. The California Division <strong>of</strong> Aeronautics<br />
has adopted the CNEL as their methodology for describing airport noise exposure and<br />
requires land uses within the 65 dBA CNEL contour around airports to be compatible<br />
with airport operations. Land uses considered incompatible within the 65 dBA CNEL<br />
airport noise contour are single-family and multi-family residences, trailer parks, schools,<br />
hospitals, and childcare facilities.<br />
Stationary Sources<br />
A wide variety <strong>of</strong> stationary sources that are typical <strong>of</strong> an urban setting are present in the<br />
<strong>City</strong> <strong>of</strong> <strong>Inglewood</strong>. The <strong>City</strong> contains many different uses (e.g., commercial, residential,<br />
institutions, public facilities, utilities, etc.), all <strong>of</strong> which can produce noise. Residential<br />
areas can generate noise through the use <strong>of</strong> heating and cooling equipment and through<br />
landscape maintenance equipment such as gasoline-powered lawnmowers. Commercial<br />
uses can generate noise through the operation <strong>of</strong> ro<strong>of</strong>top heating and cooling equipment,<br />
and other operational activities such as trash deposit and collection, noise emanating<br />
from within businesses, and deliveries. Outdoor sports facilities that attract large numbers<br />
<strong>of</strong> spectators, such as Hollywood Park, can produce noise that affects nearby receptors.<br />
Existing Noise Levels<br />
Monitored Locations<br />
Existing ambient daytime noise levels were measured at 11 locations within the <strong>City</strong> <strong>of</strong><br />
<strong>Inglewood</strong> on March 1, 2006. The selected locations are representative <strong>of</strong> typical land<br />
uses within the <strong>City</strong>. The purpose <strong>of</strong> the noise measurements was to both characterize<br />
typical ambient noise levels and to identify major noise sources in the <strong>City</strong>. Noise<br />
measurements were completed at residential neighborhoods, hospitals, a park, a high<br />
school, The Forum, Hollywood Park, and along heavily traveled roadways. The noise<br />
monitoring locations are shown in Figure 6.9-1.<br />
6.9-4<br />
<strong>City</strong> <strong>of</strong> <strong>Inglewood</strong> <strong>General</strong> <strong>Plan</strong> <strong>Update</strong> Technical Background Report
W 64TH ST<br />
D<br />
LA CIENEGA B VL<br />
S<br />
ASH AV<br />
S<br />
ST<br />
N MARKET<br />
ST<br />
MARKET<br />
S<br />
ST<br />
LOCUST<br />
S<br />
AV<br />
OSAGE<br />
S<br />
CULLEN WY<br />
CLUB DR<br />
CITY <strong>of</strong> INGLEWOOD<br />
<strong>General</strong> <strong>Plan</strong><br />
NOISE MONITORING LOCATIONS<br />
LO S A N G E L E S C O U N T Y<br />
W 64TH ST<br />
W 64TH PL<br />
E FAIRVIEW BLVD<br />
N LA BREA AV<br />
W FAIRVIEW BLVD<br />
W ELLIS AV<br />
W HILLSDALE ST<br />
CENTINELA AV<br />
E HARGRAVE ST<br />
E BRETT ST<br />
E HILLSDALE ST<br />
E BRETT ST<br />
E HYDE PARK BLVD<br />
E 65TH ST<br />
E 66TH ST<br />
WEST<br />
BLVD<br />
D<br />
AVIATION B VL<br />
W OLIVE ST<br />
S ISIS AV<br />
S HINDRY AV<br />
GLASGOW AV<br />
S<br />
l<br />
W HILL ST<br />
405<br />
W FLORENCE AV<br />
8<br />
W VICTOR AV<br />
W REGENT ST<br />
W QUEEN ST<br />
W OLIVE ST<br />
W KELSO ST<br />
W HILLCREST BLVD<br />
W ELM AV<br />
W PLYMOUTH ST<br />
W VENICE WY<br />
W NECTARINE ST<br />
W LIME ST<br />
W SPRUCE AV<br />
W MAGNOLIA AV<br />
W BUCKTHORN ST<br />
W ARBOR VITAE ST<br />
OAK ST<br />
S<br />
1<br />
W MANCHESTER BLVD<br />
HOLLY ST<br />
S<br />
W 96TH ST<br />
W 97TH ST<br />
W HYDE PARK BLVD<br />
2<br />
N OAK ST<br />
ROSEWOOD AV<br />
S<br />
AV<br />
EUCALYPTUS<br />
S<br />
TRURO AV<br />
S<br />
N FIR AV<br />
FIR AV<br />
S<br />
W IVY AV<br />
ST<br />
WALNUT<br />
S<br />
GREVILLEA AV<br />
S<br />
MAPLE AV<br />
S<br />
E STEPNEY ST<br />
LA BREA AV<br />
S<br />
HYDE PARK PL<br />
E HAZEL ST<br />
ORCHARD DR<br />
S<br />
E WARREN LN<br />
E SPRUCE AV<br />
LARCH ST<br />
S<br />
E TAMARACK AV<br />
MYRTLE AV<br />
S<br />
N PARK AV<br />
E FLORENCE AV<br />
E GRACE AV<br />
N PRAIRIE AV<br />
E REGENT ST<br />
E QUEEN ST<br />
E KELSO ST<br />
E LA BREA DR<br />
E BUCKTHORN ST<br />
E ARBOR VITAE ST<br />
FLOWER ST<br />
S<br />
E AERICK ST<br />
MANCHESTER TER<br />
9<br />
10<br />
AV<br />
OSAGE<br />
S<br />
3<br />
S PRAIRIE AV<br />
W MANCHESTER BLVD<br />
4<br />
E HARDY ST<br />
KAREEM CT<br />
REDONDO BLVD<br />
5<br />
Hollywood<br />
Park<br />
Lake<br />
BLVD<br />
WEST<br />
W 74TH ST<br />
VICTORIA AV<br />
PINCAY DR<br />
LUTHER LN<br />
POETS LN<br />
W 79TH ST<br />
W 81ST ST<br />
W 82ND ST<br />
W 82ND PL<br />
W 83RD ST<br />
W 84TH PL<br />
12TH AV<br />
S<br />
<strong>City</strong><br />
<strong>of</strong><br />
Los Angeles<br />
11TH AV<br />
11TH AV<br />
S<br />
10TH AV<br />
S<br />
10TH AV<br />
S<br />
8TH AV<br />
S<br />
CRENSHAW BLVD<br />
W 76TH ST<br />
W 77TH ST<br />
W 78TH ST<br />
W 78TH PL<br />
W 79TH ST<br />
W 80TH ST<br />
W 81ST ST<br />
W 82ND ST<br />
W 84TH ST<br />
W 84TH PL<br />
W 85TH ST<br />
W 88TH ST<br />
W 90TH ST<br />
8TH AV<br />
S<br />
6TH AV<br />
S<br />
5TH AV<br />
S<br />
5TH AV<br />
S<br />
11<br />
MAITLAND AV<br />
4TH AV<br />
S<br />
S BYRD AV<br />
3RD AV<br />
S<br />
2ND AV<br />
S<br />
AV<br />
VAN NESS<br />
S<br />
AV<br />
VAN NESS<br />
S<br />
Angeles<br />
Los<br />
<strong>City</strong> <strong>of</strong><br />
<strong>City</strong><br />
<strong>of</strong><br />
Los Angeles<br />
W 98TH ST<br />
W 99TH ST<br />
BURIN AV<br />
S<br />
HAWTHORNE BLVD<br />
S<br />
W 101ST ST<br />
W 103RD ST<br />
W CENTURY BLVD<br />
W 102ND ST<br />
W 104TH ST<br />
W 105TH ST<br />
W 106TH ST<br />
YUKON AV<br />
6<br />
W 101ST ST<br />
W 104TH ST<br />
Legend<br />
<strong>City</strong> Boundary<br />
Water Body<br />
Lennox<br />
LO S<br />
A N G E L E S<br />
C O U N T Y<br />
Metro Rail<br />
Railroad<br />
<strong>City</strong><br />
<strong>of</strong><br />
Hawthorne<br />
S PRAIRIE AV<br />
W 107TH ST<br />
W 108TH ST<br />
W 109TH ST<br />
W 110TH ST<br />
W 111TH ST<br />
W 111TH PL<br />
W 112TH ST<br />
W 113TH ST<br />
DOTY AV<br />
S<br />
W IMPERIAL HWY<br />
1. Multi-Family Residential Neighborhood<br />
2. Daniel Freeman Memorial Park<br />
3. Rogers Park<br />
10. Manchester Boulevard<br />
4. The Forum<br />
11. Single-Family Residential Neighborhood<br />
5. Hollywood Park<br />
6. Morningside High School<br />
7. Single-Family Residence Near I-105<br />
8. Single-Family Residence Near I-405<br />
9. Centinela Hospital Medical Center<br />
105<br />
W 116TH ST<br />
W 117TH ST<br />
W 118TH ST<br />
7<br />
W 118TH PL<br />
S CHERRY AV<br />
S DEHN AV<br />
AV<br />
LEMOLI<br />
S<br />
AV<br />
SIMMS<br />
S<br />
W 108TH ST<br />
ATKINSON AV<br />
ARDATH AV<br />
WILKIE AV<br />
THOREAU ST<br />
W 111TH ST<br />
W 112TH ST<br />
W IMPERIAL HWY<br />
S SPINNING AV<br />
W 115TH ST<br />
LO S<br />
A N G E L E S<br />
C O U N T Y<br />
Source: TAHA, April 2006.<br />
Date: April 5, 2006<br />
A Division <strong>of</strong><br />
Not to Scale<br />
Figure 6.9-1
6.9 Noise<br />
The noise levels were measured using a Quest Q-400 Noise Dosimeter, which satisfies<br />
the American National Standards Institute for general environmental noise measurement<br />
instrumentation. The average noise levels and sources <strong>of</strong> noise measured at each location<br />
are identified in Table 6.9-2. These daytime noise levels are characteristic <strong>of</strong> a typical<br />
urban area.<br />
Table 6.9-2<br />
Existing Daytime Noise Levels at Selected Locations a<br />
Location<br />
Primary Noise Sources<br />
15-Minute<br />
Leq (dBA)<br />
Lmin<br />
(dBA)<br />
Lmax<br />
(dBA)<br />
1<br />
Multi-family Residential<br />
Neighborhood<br />
Light traffic, car horn, birds,<br />
pedestrians<br />
57.2 46.2 71.3<br />
2 Rogers Park<br />
Medium traffic, gardening<br />
equipment, truck noise,<br />
birds<br />
56.4 55.3 57.1<br />
3<br />
Daniel Freeman Memorial<br />
Hospital<br />
Medium traffic, aircraft,<br />
sirens, music, birds<br />
58.5 56.5 60.8<br />
4 The Forum<br />
5 Hollywood Park<br />
6 Morningside High School<br />
Light traffic, aircraft,<br />
parking lot activity, birds,<br />
pedestrians<br />
Medium traffic, truck<br />
reverse alarm, car horn,<br />
siren<br />
Medium traffic, pedestrians,<br />
school activity, car door<br />
slam<br />
58.2 55.2 59.2<br />
69.2 64.1 75.6<br />
65.3 60.9 73.2<br />
7<br />
Single-family Residence<br />
Near Interstate 105<br />
Freeway noise, aircraft 69.8 59.3 83.6<br />
8<br />
Single-family Residence<br />
Near Interstate 405<br />
Freeway noise, aircraft,<br />
pedestrians, tree trim<br />
equipment<br />
62.5 50.6 76.6<br />
9<br />
Centinela Hospital<br />
Medical Center<br />
Medium traffic, car horn,<br />
car door slam, car music<br />
73.0 55 82.6<br />
10 Manchester Boulevard<br />
Heavy traffic, aircraft, car<br />
horn, pedestrians<br />
62.1 49.1 75.2<br />
11<br />
Single-family Residential<br />
Neighborhood<br />
Light traffic, pedestrians,<br />
siren, car horn, car music,<br />
birds<br />
55.7 54.7 56.4<br />
SOURCE: TAHA, 2006<br />
a Noise levels were monitored for 15 minutes at each location on March 1, 2006.<br />
Roadway Noise Levels<br />
Existing 24-hour noise levels have been calculated for various <strong>City</strong> roadways using the<br />
Federal Highway Administration Highway (FHWA) noise calculation formulas<br />
(RD-77-108). The model calculates the average noise level at specific locations based on<br />
<strong>City</strong> <strong>of</strong> <strong>Inglewood</strong> <strong>General</strong> <strong>Plan</strong> <strong>Update</strong> Technical Background Report<br />
6.9-7
Chapter 6 Community Safety and Hazards<br />
traffic volumes, average speeds, roadway geometry, and site environmental conditions.<br />
The average vehicle noise rates (energy rates) utilized in the FHWA noise calculation<br />
formulas have been modified to reflect average vehicle noise rates identified for<br />
California by the California Department <strong>of</strong> Transportation (Caltrans). The Caltrans data<br />
show that California automobile noise is 0.8 to 1.0 dBA higher than national levels and<br />
that medium and heavy truck noise is 0.3 to 3.0 dBA lower than national levels.<br />
Existing roadway noise contours are shown in Figure 6.9-2. Noise levels were modeled<br />
for the roadways with the highest traffic volumes in the <strong>City</strong>. The calculated roadway<br />
noise levels are presented in Table 6.9-3 along with the distances to various noise level<br />
contours. As shown, land uses located in proximity to Interstate 405 and Interstate 105<br />
and land uses that are located adjacent to major arterials are exposed to noise levels <strong>of</strong> 70<br />
dBA (CNEL) or more. Additionally, a majority <strong>of</strong> the <strong>City</strong> is exposed to noise levels <strong>of</strong> 60<br />
dBA (CNEL) or more.<br />
Table 6.9-3<br />
Roadway Segment<br />
Existing Roadway Noise Levels<br />
Reference Distance to Noise Contour (feet)<br />
CNEL at<br />
100 Feet a 70 CNEL 65 CNEL 60 CNEL<br />
North/South Streets<br />
Aviation Blvd from Manchester Blvd to Arbor Vitae St 70 98 310 980<br />
La Cienega Blvd, north <strong>of</strong> Centinela Ave 76 409 1294 4,093<br />
La Cienega Blvd from Centinela Ave to I-405 Ramps 75 350 1105 3,496<br />
La Cienega Blvd from I-405 Ramps to Florence Ave 71 138 437 1,383<br />
La Cienega Blvd from Florence Ave to Manchester Blvd 70 94 298 942<br />
La Cienega Blvd from Manchester Blvd to I-405 Ramps 70 104 330 1,043<br />
La Cienega Blvd from I-405 Ramps to Hillcrest Blvd 71 124 393 1,242<br />
La Cienega Blvd from Hillcrest Blvd to Arbor Vitae St 70 95 302 954<br />
La Cienega Blvd from Arbor Vitae St to I-405 Ramps 71 115 363 1,147<br />
La Cienega Blvd from I-405 Ramps to Century Blvd 72 145 458 1,447<br />
La Cienega Blvd, south <strong>of</strong> Century Blvd 72 168 530 1,675<br />
La Brea Ave, north <strong>of</strong> Centinela Ave 73 215 680 2,149<br />
La Brea Ave from Centinela Ave to Hyde Park Blvd 72 177 559 1,768<br />
La Brea Ave from Hyde Park Blvd to Florence Ave 73 180 569 1,798<br />
La Brea Ave from Florence Ave to Manchester Blvd 72 173 548 1,734<br />
La Brea Ave from Manchester Blvd to Hillcrest Blvd 71 117 371 1,172<br />
La Brea Ave from Hillcrest Blvd to Arbor Vitae St 72 162 511 1,615<br />
La Brea Ave from Arbor Vitae St to Century Blvd 72 164 519 1,642<br />
La Brea Ave, south <strong>of</strong> Century Blvd 73 188 595 1,883<br />
Prairie Ave from Florence Ave to Regent St 72 158 501 1,584<br />
Prairie Ave from Regent St to Manchester Blvd 73 179 567 1,793<br />
6.9-8<br />
<strong>City</strong> <strong>of</strong> <strong>Inglewood</strong> <strong>General</strong> <strong>Plan</strong> <strong>Update</strong> Technical Background Report
6.9 Noise<br />
Table 6.9-3<br />
Roadway Segment<br />
Existing Roadway Noise Levels<br />
Reference Distance to Noise Contour (feet)<br />
CNEL at<br />
100 Feet a 70 CNEL 65 CNEL 60 CNEL<br />
Prairie Ave from Manchester Blvd to Kelso St 73 179 567 1,794<br />
Prairie Ave from Kelso St to Arbor Vitae St 73 196 619 1,958<br />
Prairie Ave from Arbor Vitae St to Century Blvd 73 180 570 1,804<br />
Prairie Ave from Century Blvd to Lennox Blvd 73 200 633 2,001<br />
Prairie Ave from Lennox Blvd to I-105 Ramps 73 220 695 2,196<br />
Prairie Ave from I-105 Ramps to Imperial Hwy 72 152 480 1,519<br />
Crenshaw Blvd, north <strong>of</strong> 8 th St 73 192 606 1,916<br />
Crenshaw Blvd from 8 th St to Manchester Blvd 73 197 624 1,974<br />
Crenshaw Blvd from Manchester Blvd to 90 th St 73 188 593 1,876<br />
Crenshaw Blvd from 90 th St to Arbor Vitae St 73 204 645 2,039<br />
Crenshaw Blvd from Arbor Vitae St to Century Blvd 73 191 605 1,913<br />
Crenshaw Blvd from Century Blvd to 108 th St 74 237 751 2,373<br />
Crenshaw Blvd from 108 th St to Imperial Hwy 73 215 679 2,146<br />
Crenshaw Blvd, south <strong>of</strong> Imperial Hwy 73 196 621 1,965<br />
Van Ness Ave, north <strong>of</strong> Manchester Blvd 69 81 257 813<br />
Van Ness Ave from Manchester Blvd to Arbor Vitae St 69 74 233 735<br />
Van Ness Ave from Arbor Vitae St to Century Blvd 68 70 222 701<br />
Van Ness Ave from Century Blvd to 108 th St 69 74 233 737<br />
Van Ness Ave from 108 th St to Imperial Hwy 69 75 237 751<br />
I-405 from Manchester Blvd to Century Blvd 81 1,406 4,446 14,058<br />
East/West Streets<br />
Centinela Ave from La Cienega Blvd to Beach St 72 172 545 1,724<br />
Centinela Ave from Beach St to La Brea Ave 72 173 546 1,726<br />
Centinela Ave from La Brea Ave to Hyde Park Pl 72 144 457 1,444<br />
Centinela Ave from Hyde Park Pl to Hyde Park Blvd 71 132 417 1,317<br />
Centinela Ave from Hyde Park Blvd to Florence Ave 71 130 412 1,301<br />
Florence Ave from Aviation Blvd to La Cienega Blvd 70 94 298 942<br />
Florence Ave from La Cienega Blvd to Eucalyptus Ave 71 127 402 1,271<br />
Florence Ave from Eucalyptus Ave to La Brea Ave 71 136 429 1,356<br />
Florence Ave from La Brea Ave to Hillcrest Blvd 71 127 402 1,272<br />
Florence Ave from Hillcrest Blvd to Centinela Ave 72 154 486 1,535<br />
Florence Ave from Centinela Ave to Prairie Ave 74 233 737 2,331<br />
Florence Ave from Prairie Ave to Redondo Blvd 74 232 733 2,318<br />
Florence Ave, east <strong>of</strong> Redondo Blvd 73 191 603 1,907<br />
<strong>City</strong> <strong>of</strong> <strong>Inglewood</strong> <strong>General</strong> <strong>Plan</strong> <strong>Update</strong> Technical Background Report<br />
6.9-9
Chapter 6 Community Safety and Hazards<br />
Table 6.9-3<br />
Roadway Segment<br />
Existing Roadway Noise Levels<br />
Reference Distance to Noise Contour (feet)<br />
CNEL at<br />
100 Feet a 70 CNEL 65 CNEL 60 CNEL<br />
Manchester Blvd from Aviation Blvd to La Cienega Blvd 71 138 438 1,384<br />
Manchester Blvd from La Cienega Blvd to I-405 Ramps 73 196 621 1,964<br />
Manchester Blvd from I-405 Ramps to <strong>Inglewood</strong> Ave 73 195 618 1,955<br />
Manchester Blvd from <strong>Inglewood</strong> Ave to Eucalyptus Ave 73 188 594 1,879<br />
Manchester Blvd from Eucalyptus Ave to La Brea Ave 73 180 570 1,802<br />
Manchester Blvd from La Brea Ave to Hillcrest Blvd 72 162 512 1,620<br />
Manchester Blvd from Hillcrest Blvd to Prairie Ave 72 1,693 515 1,630<br />
Manchester Blvd from Prairie Ave to Crenshaw Dr 73 200 632 1,997<br />
Manchester Blvd from Crenshaw Dr to Crenshaw Blvd 71 131 413 1,306<br />
Manchester Blvd from Crenshaw Blvd to Van Ness Ave 73 200 632 1,997<br />
Arbor Vitae St from Aviation Blvd to La Cienega Blvd 70 99 313 990<br />
Arbor Vitae St from La Cienega Blvd to <strong>Inglewood</strong> Ave 70 90 285 902<br />
Arbor Vitae St from <strong>Inglewood</strong> Ave to Eucalyptus Ave 69 87 274 866<br />
Arbor Vitae St from Eucalyptus Ave to La Brea Ave 69 83 262 829<br />
Arbor Vitae St from La Brea Ave to Prairie Ave 69 72 227 718<br />
Century Blvd from La Cienega Blvd to I-405 Ramps 75 319 1,008 3,187<br />
Century Blvd from I-405 Ramps to <strong>Inglewood</strong> Ave 74 233 736 2,328<br />
Century Blvd from <strong>Inglewood</strong> Ave to La Brea Ave 74 226 714 2,259<br />
Century Blvd from La Brea Ave to Prairie Ave 73 179 565 1,787<br />
Century Blvd from Prairie Ave to Yukon Ave 73 178 564 1,784<br />
Century Blvd from Yukon Ave to Crenshaw Blvd 73 195 618 1,954<br />
Century Blvd from Crenshaw Blvd to Van Ness Ave 73 183 578 1,829<br />
Imperial Hwy from Prairie Ave to Yukon Ave 71 141 446 1,410<br />
Imperial Hwy from Yukon Ave to Crenshaw Blvd 71 138 437 1,382<br />
Imperial Hwy from Crenshaw Blvd to Van Ness Ave 72 152 479 1,516<br />
I-105, west <strong>of</strong> Crenshaw Blvd 81 1,226 3,876 12,258<br />
SOURCE: TAHA 2006<br />
a Distances are in feet from roadway centerline. The identified noise level at 100 feet from the roadway<br />
centerline is for reference purposes only as a point from which to calculate the noise contour distances. It does<br />
not reflect an actual building location or potential impact location.<br />
6.9-10<br />
<strong>City</strong> <strong>of</strong> <strong>Inglewood</strong> <strong>General</strong> <strong>Plan</strong> <strong>Update</strong> Technical Background Report
CITY <strong>of</strong> INGLEWOOD<br />
<strong>General</strong> <strong>Plan</strong><br />
EXISTING ROADWAY<br />
NOISE CONTOUR (CNEL)<br />
LOS ANGELES COUNTY<br />
64TH ST<br />
CENTINELA AVE<br />
CITY OF LOS ANGELES<br />
405<br />
ISIS AVE<br />
AVIATION BLVD<br />
HINDRY AVE<br />
GLASGOW AVE<br />
LA CIENEGA BLVD<br />
CEDAR AVE<br />
INGLEWOOD AVE<br />
ARBOR VITAE<br />
LA BREA AVE<br />
MANCHESTER BLVD<br />
95TH ST<br />
HARDY ST<br />
98TH ST<br />
HILLCREST BLVD<br />
TAMARACK AVE<br />
FLORENCE AVE<br />
PRARIE AVE<br />
90TH ST<br />
WEST BLVD<br />
8TH AVE<br />
CRENSHAW BLVD<br />
76TH ST<br />
78TH ST<br />
78TH PL<br />
79TH ST<br />
80TH ST<br />
85TH ST<br />
5TH AVE<br />
VAN NESS AVE<br />
CITY OF LOS ANGELES<br />
CENTURY BLVD<br />
101ST ST<br />
Legend<br />
LOS ANGELES COUNTY<br />
DOTY AVE<br />
104TH ST<br />
108TH ST<br />
YUKON AVE<br />
LEMOLI AVE<br />
IMPERIAL HWY<br />
8TH PL<br />
6TH ST<br />
4TH ST<br />
2ND ST<br />
LOS ANGELES COUNTY<br />
<strong>City</strong> Boundary<br />
Railroad<br />
105<br />
DEHN AVE<br />
SIMMS AVE<br />
60dBA CNEL Noise Contour<br />
65dBA CNEL Noise Contour<br />
70 dBA CNEL Noise Contour<br />
Source: TAHA, May 2006.<br />
Date: May 1, 2006<br />
A Division <strong>of</strong><br />
0 0.25 0.5<br />
Miles<br />
Figure 6.9-2
6.9 Noise<br />
Aircraft Noise Levels<br />
Figure 6.9-3 displays CNEL noise contours at LAX during the third quarter <strong>of</strong> 2005. As<br />
shown, the 65 dBA CNEL noise contour for both the northern and southern runways<br />
extend into the <strong>City</strong> <strong>of</strong> <strong>Inglewood</strong>. As such, aircraft noise levels may result in<br />
incompatible noise levels at various residential uses located within the <strong>City</strong>. LAX records<br />
noise-related aircraft complaints on a monthly basis. During 2005, an average <strong>of</strong><br />
approximately seven households per month filed an average <strong>of</strong> approximately 35 noise<br />
complaints in the <strong>City</strong>. The <strong>City</strong> has implemented a voluntary Residential Sound<br />
Insulation Program funded by grants from Los Angeles World Airports (LAWA) and the<br />
Federal Aviation Administration (FAA) to lessen aircraft-related noise levels within<br />
residential uses. This program is further discussed below under the “<strong>City</strong> <strong>of</strong> <strong>Inglewood</strong><br />
Regulations.”<br />
Aircraft noise from Hawthorne Municipal Airport may also be audible at various land<br />
uses within the <strong>City</strong> <strong>of</strong> <strong>Inglewood</strong>. CNEL contours have not been developed for the<br />
Hawthorne Municipal Airport. However, given the arrival and departure flight patterns<br />
along with the size <strong>of</strong> aircraft using the airport, it is unlikely that CNEL contours would<br />
reach incompatible levels within the <strong>City</strong> <strong>of</strong> <strong>Inglewood</strong>.<br />
Sensitive Land Uses<br />
Sensitive land uses are those uses that have associated human activities that may be<br />
subject to stress or significant interference from noise such as residences, schools, child<br />
care centers, hospitals, long-term health care facilities, convalescent centers, and<br />
retirement homes. Various standards have been developed to address the compatibility <strong>of</strong><br />
land uses with noise levels. The applicable standards are presented in the following<br />
discussion. The standards place special emphasis on land uses that are considered to be<br />
sensitive to high noise levels.<br />
The <strong>City</strong> <strong>of</strong> <strong>Inglewood</strong> contains a number <strong>of</strong> each <strong>of</strong> these different land uses, including<br />
hospitals, libraries, retirement homes, parks and recreational facilities, public and private<br />
schools, religious institutions, and childcare facilities.<br />
• Regulatory Setting<br />
Federal Regulations<br />
Federal noise regulations relevant to the <strong>City</strong> <strong>of</strong> <strong>Inglewood</strong> are transportation related.<br />
Noncompliance with federal regulations may reduce federal funding within a city. FHWA<br />
requires abatement <strong>of</strong> highway traffic noise for highway projects through rules in the<br />
Code <strong>of</strong> Federal Regulations (23 CFR Part 772). The Federal Transit Administration and<br />
the Federal Railroad Administration each require noise and vibration assessments for any<br />
mass transit or high-speed railroad projects that would pass by residential areas. For<br />
housing constructed with assistance from the U.S. Department <strong>of</strong> Housing and Urban<br />
<strong>City</strong> <strong>of</strong> <strong>Inglewood</strong> <strong>General</strong> <strong>Plan</strong> <strong>Update</strong> Technical Background Report<br />
6.9-13
Chapter 6 Community Safety and Hazards<br />
Development, minimum noise insulation standards must be achieved (24 CFR Part 51,<br />
Subpart B).<br />
The FAA has prepared guidelines for acceptable aircraft noise exposure in its Federal<br />
Aviation Regulation (FAR) Part 150 Noise Compatibility <strong>Plan</strong>ning Program. According<br />
to Part 150 guidelines, exterior aircraft exposures <strong>of</strong> 65 dBA CNEL or less and an interior<br />
exposure 45 dBA CNEL or less are considered acceptable for residential uses. 126 The<br />
FAR Part 150 Noise Compatibility <strong>Plan</strong>ning Program also provides funds for noise<br />
abatement in impacted areas. For a city to obtain noise abatement funds, FAA requires<br />
that local authorities provide evidence that they are preventing the introduction <strong>of</strong> new<br />
noise sensitive uses within noise impact areas. This policy is intended to encourage the<br />
promulgation and enforcement <strong>of</strong> local land use compatibility measures.<br />
State Regulations<br />
The Sate <strong>of</strong> California Governor’s Office <strong>of</strong> <strong>Plan</strong>ning and Research has published<br />
recommended guidelines for the preparation and content <strong>of</strong> the Noise Element <strong>of</strong> a<br />
<strong>General</strong> <strong>Plan</strong>. Each jurisdiction is required to consider these guidelines when developing<br />
the <strong>General</strong> <strong>Plan</strong> Noise Element and determining acceptable noise levels within the<br />
community. The purpose <strong>of</strong> the Noise Element is to limit the exposure <strong>of</strong> the community<br />
to excessive noise levels. A noise element must identify and appraise noise problems in<br />
the community by analyzing and quantifying current and projected noise levels for all<br />
stationary and mobile noise sources in the community. Noise contours are then<br />
developed and shown for all the noise sources in the community, and are eventually used<br />
as a guide for establishing a pattern <strong>of</strong> land uses that minimizes the exposure <strong>of</strong><br />
community residents to excessive noise.<br />
Title 24 <strong>of</strong> the California Code <strong>of</strong> Regulations includes Sound Transmission Control<br />
requirements that establish uniform minimum noise insulation performance standards for<br />
new hotels, motels, dormitories, apartment houses, and dwellings other than detached<br />
single-family units. Specifically, Title 24 states that interior noise levels attributable to<br />
exterior sources shall not exceed 45 dBA CNEL in any habitable room <strong>of</strong> new dwellings.<br />
Dwellings are to be designed so that interior noise levels will meet this standard for at<br />
least ten years from the time <strong>of</strong> building permit application.<br />
The State Department <strong>of</strong> Health Services has adopted guidelines for use in assessing the<br />
compatibility <strong>of</strong> various land use types with a range <strong>of</strong> noise levels. These guidelines are<br />
presented in Table 6.9-4. As an example, an exterior noise level up to 65 dBA CNEL is<br />
“normally acceptable” for multi-family residential uses, without special noise insulation<br />
requirements. A noise level <strong>of</strong> 65 to 70 dBA CNEL or more is identified as "conditionally<br />
acceptable" for multi-family residential uses. Under the “conditionally acceptable”<br />
category, an analysis <strong>of</strong> the noise reduction requirements is required and noise insulation<br />
126 Although the noise standards identified by the FAA are based on L dn levels, CNEL is used in this<br />
Analysis. CNEL and L dn rarely differ by more than one dBA.<br />
6.9-14<br />
<strong>City</strong> <strong>of</strong> <strong>Inglewood</strong> <strong>General</strong> <strong>Plan</strong> <strong>Update</strong> Technical Background Report
CITY <strong>of</strong> INGLEWOOD<br />
<strong>General</strong> <strong>Plan</strong><br />
EXISTING LAX NOISE CONTOURS<br />
Legend<br />
Residential - Single-Family within Contour<br />
Residential - Multi-Family within Contour<br />
Airport Property<br />
<strong>City</strong> <strong>of</strong> <strong>Inglewood</strong> Boundary<br />
Landmarks<br />
Churches<br />
Hospitals<br />
Schools<br />
Noise Contours<br />
Airport Boundary<br />
Freeways<br />
Streets<br />
Source: Los Angeles World Airports.<br />
Date: May 15, 2006<br />
A Division <strong>of</strong><br />
Figure 6.9-3
6.9 Noise<br />
Table 6.9-4<br />
Land Use Category<br />
Residential-Low Density Single<br />
Family, Duplex, Mobile Homes<br />
Land Use/Noise Compatibility Guidelines<br />
Community Noise Exposure (dBA, CNEL)<br />
55 60 65 70 75 80<br />
Residential-Multi-Family<br />
Transient Lodging – Motels, Hotels<br />
Schools, Libraries, Churches,<br />
Hospitals, Nursing Homes<br />
Auditoriums, Concert Halls,<br />
Amphitheaters<br />
Sports Arena, Outdoor Spectator<br />
Sports<br />
Playgrounds, Neighborhood Parks<br />
Golf Courses, Riding Stables, Water<br />
Recreation, Cemeteries<br />
Office Buildings, Business<br />
Commercial and Pr<strong>of</strong>essional<br />
Industrial, Manufacturing, Utilities,<br />
Agriculture<br />
SOURCE:<br />
California Office <strong>of</strong> Noise Control, Department <strong>of</strong> Health Services<br />
Normally Acceptable – Specified land use is satisfactory based upon the assumption that any<br />
buildings involved are <strong>of</strong> normal conventional construction without any special noise insulation<br />
requirements.<br />
Conditionally Acceptable – New construction or development shall be undertaken only after a<br />
detailed analysis <strong>of</strong> the noise reduction requirements is made and needed noise insulation<br />
features included in the design. Conventional construction, but with closed windows and fresh air<br />
supply system or air conditioning, will normally suffice.<br />
Normally Unacceptable – New construction or development should generally be discouraged. If<br />
new construction or development does proceed, a detailed analysis <strong>of</strong> the noise reduction<br />
requirements must be made and needed noise insulation features included in the design.<br />
Clearly Unacceptable – New construction or development should generally not be undertaken.<br />
<strong>City</strong> <strong>of</strong> <strong>Inglewood</strong> <strong>General</strong> <strong>Plan</strong> <strong>Update</strong> Technical Background Report<br />
6.9-17
Chapter 6 Community Safety and Hazards<br />
features need to be incorporated into the design <strong>of</strong> the land uses. Conventional<br />
construction with closed windows and fresh air supply system or air conditioning will<br />
normally suffice under this category. A noise level <strong>of</strong> 70 to 75 dBA CNEL is identified as<br />
“normally unacceptable” for multi-family residential uses. Under this category, an analysis<br />
<strong>of</strong> the noise reduction requirements is also required and noise insulation features need to<br />
be incorporated into the design <strong>of</strong> the land uses.<br />
<strong>City</strong> <strong>of</strong> <strong>Inglewood</strong> Regulations<br />
<strong>Inglewood</strong> Municipal Code<br />
Article 2 (Noise Regulations) under Chapter 5, (Offenses, Miscellaneous) <strong>of</strong> the<br />
<strong>Inglewood</strong> Municipal Code establishes criteria and standards for the regulation <strong>of</strong> noise<br />
levels within the <strong>City</strong>. Section 5-29 <strong>of</strong> the <strong>City</strong> Municipal Code establishes the general<br />
standards relative to disturbance <strong>of</strong> peace as follows:<br />
… It shall be unlawful for any person at any location to create any noise, or<br />
to allow the creation <strong>of</strong> any noise on property owned, leased, occupied, or<br />
otherwise controlled by that person, when the foregoing causes the noise<br />
level, when measured on any other property, to exceed any noise for the<br />
cumulative time periods specified [in the Noise Ordinance].<br />
Sections 5-27 and 5-30 <strong>of</strong> the <strong>City</strong> Municipal Code establish base ambient noise levels<br />
and maximum residential exterior and interior noise levels. Table 6.9-5 and Table 6.9-6<br />
show the base ambient noise levels and maximum residential exterior and interior noise<br />
levels, respectively. According to Section 5-27 <strong>of</strong> the <strong>City</strong> Municipal Code, actual<br />
measurements exceeding the noise levels at the time and within the zones defined in<br />
Table 6.9-5 shall be employed as the base ambient noise level. In addition, no ambient<br />
noise shall be less than the noise level specified in Table 6.9-5.<br />
Table 6.9-5<br />
Base Ambient Noise Levels<br />
Decibels Time Land Use Zone<br />
45 dBA 10:00 P.M.–7:00 A.M. Residential<br />
55 dBA 7:00 A.M.–10:00 P.M. Residential<br />
65 dBA Anytime Commercial and uses not specified<br />
75 dBA Anytime Industrial<br />
SOURCE: <strong>City</strong> <strong>of</strong> <strong>Inglewood</strong> Municipal Code, Section 5-27 (Base Ambient Noise Level) <strong>of</strong> Article 2 (Noise<br />
Regulations) <strong>of</strong> Chapter 5 (Offenses, Miscellaneous) September 13, 1988<br />
6.9-18<br />
<strong>City</strong> <strong>of</strong> <strong>Inglewood</strong> <strong>General</strong> <strong>Plan</strong> <strong>Update</strong> Technical Background Report
6.9 Noise<br />
Table 6.9-6<br />
Exterior Noise Levels<br />
Maximum Residential Noise Levels<br />
Noise Level Exceeded<br />
Maximum Duration Period<br />
(1) Base Ambient Noise Level (BANL) 30 minutes in any hour<br />
(2) 5 dBA above BANL 15 minutes in any hour<br />
(3) 10 dBA above BANL 5 minutes in any hour<br />
(4) 15 dBA above BANL 1 minute in any hour<br />
(5) 20 dBA above BANL Not permitted<br />
Interior Noise Levels<br />
(1) BANL 5 minutes in any hour<br />
(2) 5 dBA above BANL 1 minute in any hour<br />
(3) 10 dBA above BANL Not permitted<br />
SOURCE: <strong>City</strong> <strong>of</strong> <strong>Inglewood</strong> Municipal Code, Section 5-30 (Maximum Residential Noise Levels) <strong>of</strong> Article 2<br />
(Noise Regulations) <strong>of</strong> Chapter 5 (Offenses, Miscellaneous) September 13, 1988<br />
The <strong>City</strong> Municipal Code also regulates non-residential noise levels and construction<br />
noise. Section 5-31 (Maximum Nonresidential Noise Levels) states that noise levels at the<br />
exterior <strong>of</strong> non-residential properties shall not exceed the respective base ambient noise<br />
levels for commercial and industrial land uses for a maximum cumulative duration <strong>of</strong> 30<br />
minutes in any hour. Section 5-41 (Construction <strong>of</strong> Building and Projects, Noise<br />
Regulated) states that it is unlawful for any person within a residential zone, or within<br />
500 feet <strong>of</strong> a residential zone, to operate construction equipment or perform any outside<br />
construction or repair work between the hours <strong>of</strong> 8:00 P.M. and 7:00 A.M. in such a<br />
manner that causes annoyance or discomfort unless a permit has been obtained from the<br />
Permits and Licenses Committee <strong>of</strong> the <strong>City</strong>.<br />
Other sources <strong>of</strong> noise regulated in the <strong>City</strong> Municipal Code include the following:<br />
• Radios, televisions, and stereos<br />
• Publicly amplified sound<br />
• Hawkers and peddlers<br />
• Ice cream trucks<br />
• Drums and musical instruments<br />
• Machinery, equipment, fans and air conditioning<br />
• Motor driven vehicles<br />
• Vehicle repairs<br />
• Excessive train horn noise<br />
• Excessive aircraft noise<br />
• Jet engine testing<br />
• Animals and fowl<br />
<strong>City</strong> <strong>of</strong> <strong>Inglewood</strong> <strong>General</strong> <strong>Plan</strong> <strong>Update</strong> Technical Background Report<br />
6.9-19
Chapter 6 Community Safety and Hazards<br />
Residential Sound Insulation Program<br />
The <strong>City</strong> <strong>of</strong> <strong>Inglewood</strong>’s Residential Sound Insulation Program is designed to reduce the<br />
impact <strong>of</strong> noise on homes under the flight path <strong>of</strong> LAX. The <strong>City</strong> <strong>of</strong>fers sound insulation<br />
at no cost to residents living in neighborhoods with a recorded CNEL <strong>of</strong> 65 dBA and<br />
higher as shown on the map produced by the LAWA for the Fourth Quarter <strong>of</strong> 1992.<br />
This is a voluntary program funded by grants from LAWA and the FAA. The funding<br />
agreement with LAWA allocates 65 percent <strong>of</strong> the funds to the west side <strong>of</strong> the <strong>City</strong> and<br />
up to 35 percent <strong>of</strong> funds for noise impacted residences on the east side <strong>of</strong> the <strong>City</strong>.<br />
Within these areas, priority is given to the most noise-impacted blocks. Sound insulation<br />
improvements <strong>of</strong>ten include, but are not limited to, replacing standard doors and<br />
windows with acoustically rated doors and windows, adding insulation to attics, the<br />
addition <strong>of</strong> central air and heating to the home, and fitting chimneys and vents with<br />
dampers and/or acoustic louvers.<br />
• Issues<br />
• New development will likely further increase the number <strong>of</strong> noise sources within<br />
the <strong>City</strong>.<br />
• Land uses located along major arterial streets and in proximity to Interstates 405<br />
and 105 are exposed to traffic-related noise levels <strong>of</strong> 70 dBA (CNEL) or more.<br />
• Residential neighborhoods will be exposed to noise generated by LAX in excess <strong>of</strong><br />
65 dBA CNEL.<br />
• References<br />
Barry, T.M. and J.A. Reagan. FHWA Highway Traffic Noise Prediction Model (FHWA-RD-<br />
77-108). 1978.<br />
<strong>City</strong> <strong>of</strong> <strong>Inglewood</strong>. 1987. Noise Element, <strong>City</strong> <strong>of</strong> <strong>Inglewood</strong> <strong>General</strong> <strong>Plan</strong>.<br />
———. Municipal Code. Chapter 5—Noise Regulations <strong>of</strong> Article 2.<br />
Los Angeles World Airports. 2005. LAX Noise Contour Map (3Q05).<br />
http://www.lawa.org/lax/laxContourMaps.cfm. Site accessed February 27, 2006.<br />
State <strong>of</strong> California. Department <strong>of</strong> Health Services. 1978. Noise/Land Use Compatibility<br />
Matrix.<br />
State <strong>of</strong> California. Governor’s Office <strong>of</strong> <strong>Plan</strong>ning and Research. 2003. <strong>General</strong> <strong>Plan</strong><br />
Guidelines, Appendix C: Guidelines for the Preparation and Content <strong>of</strong> the Noise<br />
Element <strong>of</strong> the <strong>General</strong> <strong>Plan</strong>. October.<br />
United States Department <strong>of</strong> Transportation. Federal Highway Administration. 1980a.<br />
Highway Noise Fundamentals.<br />
6.9-20<br />
<strong>City</strong> <strong>of</strong> <strong>Inglewood</strong> <strong>General</strong> <strong>Plan</strong> <strong>Update</strong> Technical Background Report
CHAPTER 7<br />
Synthesis <strong>of</strong> <strong>Plan</strong>ning Issues<br />
This Chapter represents a summary <strong>of</strong> the issues identified in each <strong>of</strong> the preceding<br />
Sections <strong>of</strong> this Technical Background Report. The issues presented here, represent<br />
opportunities, constraints, challenges, or problems facing the <strong>City</strong> <strong>of</strong> <strong>Inglewood</strong> as related<br />
to each <strong>of</strong> the topical areas to be covered in the <strong>General</strong> <strong>Plan</strong> update. The identification<br />
and assessment <strong>of</strong> issues is an important component <strong>of</strong> the planning process as it<br />
provides a basis to target resources towards the goals, policies, and implementation<br />
programs that will be incorporated into the <strong>General</strong> <strong>Plan</strong>.<br />
The first column <strong>of</strong> the matrix below lists the issues identified in each <strong>of</strong> the respective<br />
TBR sections. Bullets are placed under the column headings Policy and/or Framework to<br />
indicate whether the issue statement may be addressed by policy, or if it provides a fact<br />
that should be considered in the update <strong>of</strong> the <strong>General</strong> <strong>Plan</strong>.<br />
Technical Background Report Issue Policy Framework<br />
COMMUNITY DEVELOPMENT<br />
Land Use<br />
Single-family homes are being increasingly replaced by condominiums or<br />
apartments in multi-family-zoned areas.<br />
The extensive area zoned for commercial along the arterial streets competes<br />
with the maintenance <strong>of</strong> a viable downtown.<br />
Many businesses along the major arterials have not been maintained and cannot<br />
provide adequate <strong>of</strong>f-street parking due to inadequate lot size. The shallow lots<br />
and multiple small businesses lead to frequent curb cuts, congested streets and a<br />
lack parking.<br />
The <strong>City</strong> lacks signature development at major gateways into the <strong>City</strong>, such as<br />
Century and Manchester Boulevards from the west, and Prairie Avenue and<br />
Crenshaw Boulevard from the south.<br />
Many commercial corridors lack the amenities (streetscape, bus shelters, trees,<br />
etc.) necessary to encourage walking.<br />
Housing<br />
The <strong>City</strong> is experiencing a decrease in the single-family housing stock due, in<br />
part, to the demolition <strong>of</strong> older single-family homes in multi-family zones<br />
replaced by apartment or condominium development.<br />
The low percentage <strong>of</strong> home owners is an issue. Only 36 percent <strong>of</strong> <strong>Inglewood</strong><br />
residents were owners in 2000, compared to 48 percent for the County.<br />
Housing availability in <strong>Inglewood</strong> is an issue. The vacancy rate for rental units<br />
declined dramatically over the last decade, from 7.1 percent in 1990 to 3.5<br />
percent in 2000.<br />
<strong>Inglewood</strong>’s housing stock is relatively old, compared to other South Bay<br />
communities. This represents a potential problem since a large number <strong>of</strong> the<br />
units are approaching the latter stages <strong>of</strong> their physical life span, which is<br />
generally associated with a more rapid rate <strong>of</strong> structural deterioration.<br />
Many homes are impacted by both direct and indirect effect <strong>of</strong> aircraft noise<br />
from LAX, which creates a major constraint to maintaining adequate housing<br />
conditions in the <strong>City</strong>.<br />
●<br />
●<br />
●<br />
●<br />
●<br />
●<br />
●<br />
●<br />
●<br />
●<br />
<strong>City</strong> <strong>of</strong> <strong>Inglewood</strong> <strong>General</strong> <strong>Plan</strong> <strong>Update</strong> Technical Background Report<br />
7-1
Chapter 7 Synthesis <strong>of</strong> <strong>Plan</strong>ning Issues<br />
Technical Background Report Issue Policy Framework<br />
Home prices have significantly increased in <strong>Inglewood</strong> and the region since<br />
2004, causing the purchase <strong>of</strong> many homes to be out <strong>of</strong> reach for a large<br />
●<br />
portion <strong>of</strong> the <strong>City</strong>’s residents.<br />
Overcrowding in the <strong>City</strong> increased substantially between 1990 and 2000,<br />
reflecting an increase in population growth without a relative increase in the<br />
number <strong>of</strong> housing units to meet this need. Additionally, overcrowding indicates<br />
that there may be a lack <strong>of</strong> housing that is suitable or affordable.<br />
●<br />
Economic Trends and Conditions<br />
The <strong>City</strong>’s existing employment base, with one-third <strong>of</strong> all jobs in the services<br />
sector, has the effect <strong>of</strong> lowering the average wage <strong>of</strong> local employment<br />
opportunities.<br />
The <strong>City</strong>’s population age, 25 years and older, has achieved markedly lower<br />
levels <strong>of</strong> higher education than the total for the South Bay Cities and Los<br />
Angeles County.<br />
The <strong>City</strong> is currently witnessing leakage in most <strong>of</strong> its retail categories, with only<br />
<strong>General</strong> Merchandise performing above the Los Angeles County per capita<br />
average retail sales.<br />
In 2004, the unemployment rate in <strong>Inglewood</strong> was the second highest among the<br />
South Bay Cities at 8.3 percent, compared to 6.6 percent for Los Angeles<br />
County.<br />
Manufacturing declined by 31.9 percent from an estimated 2,685 jobs in 2001<br />
to 1829 jobs in 2004.<br />
The annual average salary in the <strong>City</strong> <strong>of</strong> <strong>Inglewood</strong> declined by 4.5 percent in<br />
constant 2005 dollars from $42,683 to $40,773 from 2001 to 2004.<br />
Per capita taxable retail sales in <strong>Inglewood</strong> were relatively low at $5,998<br />
amongst the cities in the South Bay; about 67 percent <strong>of</strong> the $8,980 area<br />
average.<br />
The <strong>City</strong> is generally lacking in strong regional retail centers.<br />
INFRASTRUCTURE<br />
Water System<br />
Retr<strong>of</strong>itting <strong>of</strong> Water Meters: <strong>City</strong> <strong>of</strong> <strong>Inglewood</strong> requires the replacing its water<br />
meters on all active accounts, including those for Municipal accounts (but exclude<br />
Fire Service meters). The effect <strong>of</strong> this project will be an increase in billable<br />
water consumption, thereby allowing the <strong>City</strong> <strong>of</strong> <strong>Inglewood</strong> to charge for water<br />
which is although being consumed, but has not been paid for.<br />
Sewer and Wastewater<br />
No issues have been identified related to sewer and wastewater.<br />
Storm Drains<br />
Local drainage problems may occur throughout the <strong>City</strong>. Staff is aware <strong>of</strong> local<br />
drainage threats such as stormwater run<strong>of</strong>f entering culverts or underground into<br />
storm sewers.<br />
Lack <strong>of</strong> maintenance can contribute to the flood hazard in urban areas.<br />
Solid Waste<br />
The <strong>City</strong> failed to meet new waste diversion and recycling services needed to<br />
meet the State’s 50 percent waste diversion goal and faces possible punitive<br />
State fines and other penalties.<br />
●<br />
●<br />
●<br />
●<br />
●<br />
●<br />
●<br />
●<br />
●<br />
●<br />
●<br />
7-2<br />
<strong>City</strong> <strong>of</strong> <strong>Inglewood</strong> <strong>General</strong> <strong>Plan</strong> <strong>Update</strong> Technical Background Report
Chapter 7 Synthesis <strong>of</strong> <strong>Plan</strong>ning Issues<br />
Technical Background Report Issue Policy Framework<br />
Electricity<br />
Existing electricity services, which include transmission and distribution lines, may<br />
need to be expanded to accommodate additional growth associated with new<br />
or expanded development.<br />
There is an issue <strong>of</strong> aesthetic in retaining electrical services in above-ground<br />
transmission lines.<br />
Natural Gas<br />
Existing natural gas service, which includes transmission and distribution lines,<br />
may need to be expanded to accommodate additional growth associated with<br />
new or expanded development.<br />
Telecommunications<br />
No issues have been identified related to telecommunications.<br />
Circulation<br />
While some progress has been made towards aligning intersections since the<br />
development <strong>of</strong> the previous Element, several locations still require detailed<br />
analysis and the implementation <strong>of</strong> mitigation measures or improvements if<br />
deemed necessary.<br />
As a result <strong>of</strong> traffic growth in the area and the physical limitations found along<br />
several major roadway facilities, some neighborhoods are experiencing<br />
problems with “cut-thru” traffic, or vehicles utilizing less congested neighborhood<br />
streets to bypass areas <strong>of</strong> congestion on more heavily traveled facilities. This<br />
situation degrades the surrounding neighborhoods in terms <strong>of</strong> quality <strong>of</strong> life and<br />
creates possible dangerous conditions.<br />
Contrary to the <strong>City</strong>’s Downtown Street Design Study which recommended the<br />
conversion <strong>of</strong> both La Brea Avenue and Market Street into directional one-way<br />
thoroughfares, currently, both streets still operate as two-directional facilities<br />
with La Brea Avenue bearing the brunt <strong>of</strong> overall growth in traffic volumes.<br />
Crenshaw Boulevard has seen a substantial increase in traffic volumes due to the<br />
completion <strong>of</strong> a freeway interchange with the Glenn Anderson Freeway (I-105),<br />
located immediately south <strong>of</strong> the <strong>City</strong> <strong>of</strong> <strong>Inglewood</strong>. This situation is magnified<br />
by the absence <strong>of</strong> a direct freeway interchange along either Western Avenue<br />
or Prairie Avenue, the two major north/south roadway facilities located on<br />
either side <strong>of</strong> Crenshaw Boulevard.<br />
The current revision <strong>of</strong> the LAX Master <strong>Plan</strong> is expected to include several<br />
significant improvements to roadway facilities such as Arbor Vitae Avenue,<br />
Century Boulevard, La Cienega Boulevard, Aviation Boulevard and Lennox<br />
Boulevard. These improvements will greatly affect the current traffic distribution<br />
across the <strong>City</strong>.<br />
Currently, the <strong>City</strong> does not have either a bicycle plan or any existing dedicated<br />
bicycle routes.<br />
Several areas <strong>of</strong> the <strong>City</strong> are currently experiencing issues regarding the lack <strong>of</strong><br />
on-street parking. This may be the result <strong>of</strong> insufficient roadway right-<strong>of</strong>-way to<br />
accommodate growth in traffic volumes without sacrificing parking.<br />
COMMUNITY SERVICES<br />
●<br />
●<br />
●<br />
●<br />
●<br />
●<br />
●<br />
●<br />
●<br />
●<br />
●<br />
Schools<br />
The District has nine elementary schools and one middle school on year-round<br />
track, in order to relieve overcrowding within the district, as five elementary<br />
schools, one middle school, and one high school are over 90 percent <strong>of</strong> their<br />
enrollment capacity.<br />
●<br />
<strong>City</strong> <strong>of</strong> <strong>Inglewood</strong> <strong>General</strong> <strong>Plan</strong> <strong>Update</strong> Technical Background Report<br />
7-3
Chapter 7 Synthesis <strong>of</strong> <strong>Plan</strong>ning Issues<br />
Technical Background Report Issue Policy Framework<br />
There is a demonstrated need for pre-schools in the <strong>Inglewood</strong> District, as<br />
indicated by waiting lists.<br />
●<br />
District enrollments are expected to increase in the Hollywood Park area and<br />
related attendance boundaries.<br />
●<br />
As stated above, school enrollments are expected to increase, but there are no<br />
plans to construct new schools to meet these future needs.<br />
●<br />
Recreation and Parks<br />
The <strong>City</strong> provides a low ratio <strong>of</strong> parkland to residents. While the northern and<br />
northeastern parts <strong>of</strong> <strong>Inglewood</strong> are adequately served by parks having<br />
recreational facilities; the southern and southwestern parts are not served by<br />
comparable facilities.<br />
Given the limited potential for new parkland acquisition, attention should<br />
continue to focus on improving access to and increasing the availability <strong>of</strong><br />
recreational opportunities.<br />
The Senior Center is crowded beyond capacity. A new Senior Center has been<br />
planned and approved; however, a funding source has not been identified.<br />
Land acquired by the <strong>City</strong> in the southern and southwestern parts <strong>of</strong> the <strong>City</strong><br />
with aircraft noise mitigation funds should be explored for recreational<br />
opportunities.<br />
Library Services<br />
Overall library usage has been declining for the past two years.<br />
ENVIRONMENTAL RESOURCES<br />
Biological Resources<br />
While there is currently no federal or state listed species in the <strong>City</strong>, if one were<br />
to be identified at a later date, it could impact redevelopment activities within<br />
the <strong>City</strong>.<br />
Hydrology and Water Quality<br />
Increasing urbanization will increase impervious surfaces, increasing stormwater<br />
run<strong>of</strong>f and sedimentation, thereby triggering potential decreases in water<br />
quality.<br />
Topography and Hillsides<br />
The <strong>City</strong> does not currently have regulations or policies to mitigate potential<br />
hazards, including landslides that could result from development in areas <strong>of</strong> the<br />
<strong>City</strong> with increasing gradients (i.e. Baldwin Hills area).<br />
Visual Resources<br />
Prairie Avenue has the potential to become a strong visual resources; however,<br />
large unscreened parking lots, lack <strong>of</strong> street improvements including a median<br />
parkway landscaping and onsite landscaping and buffers contribute to lack <strong>of</strong><br />
visual appeal along the corridor for pedestrians and vehicles.<br />
Vacant store fronts and lack <strong>of</strong> maintenance along some <strong>of</strong> the <strong>City</strong>’s major<br />
corridors such as Imperial Highway create visually unappealing environments.<br />
Historical and Cultural Resources<br />
The <strong>City</strong> lacks a local register <strong>of</strong> historical resources or a historic preservation<br />
ordinance to protect and promote preservation <strong>of</strong> the <strong>City</strong>’s historic resources.<br />
The <strong>City</strong> has not performed local surveys or studies that evaluate resources<br />
outside <strong>of</strong> the downtown area that may be historically significant.<br />
Many <strong>of</strong> the commercial properties with historic value are vacant or contain<br />
businesses which are marginal or underutilized.<br />
●<br />
●<br />
●<br />
●<br />
●<br />
●<br />
●<br />
●<br />
●<br />
●<br />
●<br />
●<br />
●<br />
7-4<br />
<strong>City</strong> <strong>of</strong> <strong>Inglewood</strong> <strong>General</strong> <strong>Plan</strong> <strong>Update</strong> Technical Background Report
Chapter 7 Synthesis <strong>of</strong> <strong>Plan</strong>ning Issues<br />
Technical Background Report Issue Policy Framework<br />
The pressure for redevelopment continues to threaten historic residential and<br />
commercial structures within the <strong>City</strong>.<br />
●<br />
A large number <strong>of</strong> the existing historic areas have been negatively affected by<br />
incompatible architectural designs that do not acknowledge the historical context ●<br />
<strong>of</strong> surrounding development.<br />
<strong>Inglewood</strong> has limited venues suitable for the presentation <strong>of</strong> pr<strong>of</strong>essional<br />
quality visual and performing artists.<br />
●<br />
The <strong>City</strong> <strong>of</strong> <strong>Inglewood</strong> is noted for sports and entertainment but lacks recognition<br />
for artist cultural opportunities<br />
●<br />
Air Quality<br />
The <strong>City</strong> lacks planning programs that reduce the length and or number <strong>of</strong><br />
vehicle trips and encourage residents to work locally, rideshare, telecommute, or<br />
use alternative forms <strong>of</strong> transportation.<br />
The <strong>City</strong> lacks policies that discourage sensitive receptors near Interstates 405<br />
and 105.<br />
COMMUNITY SAFETY AND HAZARDS<br />
Geology, Soils, and Mineral Resources<br />
No issues have been identified related to geologic or mineral resources.<br />
Seismic Hazards<br />
The <strong>City</strong> <strong>of</strong> <strong>Inglewood</strong> is located within a seismically active region. Therefore,<br />
existing and future developments within the <strong>City</strong> are likely to be subject to<br />
potential seismic hazards, including subsidence, landsliding, and liquefaction<br />
depending on their location.<br />
Many public buildings, including the Civic Center, <strong>Inglewood</strong> Police<br />
Headquarters, County Superior Court Buildings and private institutions were<br />
designed or built prior to 1973 lack seismic retr<strong>of</strong>itting.<br />
Flood Hazards<br />
<strong>Inglewood</strong> is highly urbanized and the majority <strong>of</strong> the ground coverage consists<br />
<strong>of</strong> impervious surfaces, which can lead to an increase in volume and velocity <strong>of</strong><br />
run<strong>of</strong>f after a rainfall event, increasing the potential for flood hazards.<br />
The <strong>City</strong> lacks a plan to address mitigation in areas <strong>of</strong> historical flooding during<br />
large storm events.<br />
Fire Hazards<br />
The older housing stock <strong>of</strong> the <strong>City</strong> could pose a fire hazard if upgraded fire<br />
prevention devices have not been installed.<br />
Hazards Materials<br />
With major freeways and truck routes that traverse the <strong>City</strong>, hazardous<br />
materials are routinely transported through the <strong>City</strong>.<br />
Police Services<br />
The existing Police Department is insufficient to accommodate the staffing and<br />
equipment that it currently has and needs. The Department has been using <strong>City</strong><br />
Hall to house some <strong>of</strong> its divisions.<br />
Fire Services<br />
No issues have been identified related to fire services.<br />
Emergency Preparedness<br />
No issues have been identified related to emergency preparedness.<br />
●<br />
●<br />
●<br />
●<br />
●<br />
●<br />
●<br />
●<br />
●<br />
<strong>City</strong> <strong>of</strong> <strong>Inglewood</strong> <strong>General</strong> <strong>Plan</strong> <strong>Update</strong> Technical Background Report<br />
7-5
Chapter 7 Synthesis <strong>of</strong> <strong>Plan</strong>ning Issues<br />
Technical Background Report Issue Policy Framework<br />
Noise<br />
New development will likely further increase the number <strong>of</strong> noise sources within<br />
the <strong>City</strong>.<br />
Land uses located along major arterial streets and in proximity to Interstates<br />
405 and 105 are exposed to traffic-related noise levels <strong>of</strong> 70 dBA (CNEL) or<br />
more.<br />
Residential neighborhoods will be exposed to noise generated by LAX in excess<br />
<strong>of</strong> 65 dBA CNEL..<br />
●<br />
●<br />
●<br />
7-6<br />
<strong>City</strong> <strong>of</strong> <strong>Inglewood</strong> <strong>General</strong> <strong>Plan</strong> <strong>Update</strong> Technical Background Report
Chapter 7 Synthesis <strong>of</strong> <strong>Plan</strong>ning Issues<br />
Appendix A<br />
<strong>City</strong> <strong>of</strong> <strong>Inglewood</strong> <strong>General</strong> <strong>Plan</strong><br />
<strong>Update</strong> Economic Conditions and<br />
Trends Report
DRAFT<br />
<strong>City</strong> <strong>of</strong> <strong>Inglewood</strong><br />
Economic Conditions and Trends<br />
<strong>General</strong> <strong>Plan</strong> <strong>Update</strong><br />
Prepared for:<br />
<strong>City</strong> <strong>of</strong> <strong>Inglewood</strong><br />
One Manchester Blvd.<br />
<strong>Inglewood</strong>, CA 90301<br />
April 20, 2006<br />
SRHA JOB #1112<br />
11661 San Vicente Blvd. Suite 306<br />
Los Angeles, CA 90049<br />
310.820.2680, 310.820.8341 fax<br />
www.stanleyrh<strong>of</strong>fman.com
CONTENTS<br />
TABLES .......................................................................................................................................................III<br />
FIGURES.......................................................................................................................................................V<br />
EXECUTIVE SUMMARY..............................................................................................................................VI<br />
CHAPTER 1 - INTRODUCTION.................................................................................................................... 1<br />
1.1 Background and Purpose <strong>of</strong> Report ......................................................................................... 1<br />
1.2 Organization <strong>of</strong> Report ........................................................................................................... 1<br />
1.3 Regional Setting .................................................................................................................... 2<br />
1.4 Sources <strong>of</strong> Information............................................................................................................ 4<br />
CHAPTER 2 – COMMUNITY OVERVIEW .................................................................................................... 5<br />
2.1 Population ............................................................................................................................. 5<br />
2.2 Households ........................................................................................................................... 7<br />
2.3 Tenure .................................................................................................................................. 8<br />
2.4 Housing Units ...................................................................................................................... 10<br />
2.5 Overcrowding ...................................................................................................................... 13<br />
2.6 Race and Ethnicity ............................................................................................................... 14<br />
2.7 Age Distribution <strong>of</strong> Population ............................................................................................... 16<br />
2.8 Educational Attainment......................................................................................................... 18<br />
2.9 Labor Force......................................................................................................................... 20<br />
2.10 Household Income ............................................................................................................... 23<br />
2.11 Projected Population, Household and Employment Growth...................................................... 25<br />
CHAPTER 3 – BUSINESS OVERVIEW...................................................................................................... 28<br />
3.1 Overall 1994 to 2004 Employment Trends.............................................................................. 28<br />
3.2 NAICS Sectoral Employment and Salary Trends: 2001 to 2004................................................ 28<br />
3.3 Distribution <strong>of</strong> Establishments by Sector and Size: 2001 to 2004.............................................. 34<br />
Stanley R. H<strong>of</strong>fman Associates, Inc. i Economic Conditions and Trends<br />
April 20, 2006<br />
<strong>City</strong> <strong>of</strong> <strong>Inglewood</strong> <strong>General</strong> <strong>Plan</strong> <strong>Update</strong>
3.4 Sectoral Clustering in the <strong>City</strong> <strong>of</strong> <strong>Inglewood</strong>............................................................................ 36<br />
3.5 <strong>City</strong> <strong>of</strong> <strong>Inglewood</strong> Compared with the Los Angeles County Economy........................................ 39<br />
CHAPTER 4 – MARKET CONDITIONS AND TRENDS ............................................................................. 40<br />
4.1 <strong>City</strong> <strong>of</strong> <strong>Inglewood</strong> Taxable Sales: 1994 to 2004....................................................................... 40<br />
4.2 <strong>City</strong> <strong>of</strong> <strong>Inglewood</strong> Taxable Retail Sales Trends: 1994 to 2004 .................................................. 41<br />
4.4 Comparative Taxable Retail Sales......................................................................................... 43<br />
4.5 <strong>City</strong> <strong>of</strong> <strong>Inglewood</strong> Retail Leakage Analysis ............................................................................. 45<br />
4.6 Retail Market Inventory in the <strong>City</strong> <strong>of</strong> <strong>Inglewood</strong>...................................................................... 46<br />
4.7 Retail Market Lease and Vacancy Rates: 2006....................................................................... 46<br />
CHAPTER 5 – REAL ESTATE TRENDS.................................................................................................... 49<br />
5.1 Building Activity.................................................................................................................... 49<br />
5.2 Housing Value ..................................................................................................................... 52<br />
5.3 Multi-Family Rental Market.................................................................................................... 54<br />
CHAPTER 6– LOCATIONAL AND ECONOMIC OPPORTUNITIES .......................................................... 55<br />
6.1 Los Angeles International Airport........................................................................................... 55<br />
6.2 Tourism and Lodging........................................................................................................ 56<br />
6.3 Hollywood Park.................................................................................................................... 57<br />
6.4 The Forum .......................................................................................................................... 57<br />
6.5 Downtown ........................................................................................................................... 57<br />
APPENDIX A............................................................................................................................................... 58<br />
APPENDIX B............................................................................................................................................... 60<br />
Stanley R. H<strong>of</strong>fman Associates, Inc. ii Economic Conditions and Trends<br />
April 20, 2006<br />
<strong>City</strong> <strong>of</strong> <strong>Inglewood</strong> <strong>General</strong> <strong>Plan</strong> <strong>Update</strong>
TABLES<br />
2-1 Population Trends: 1990-2000 and 2000-2005...................................................................... 7<br />
2-2 Demographic Pr<strong>of</strong>ile <strong>of</strong> Market Area: 2000-2005................................................................. 8<br />
2-3 Housing Tenure: 1990-2000 ..................................................................................................9<br />
2-4 Dwelling Units: 1990-2000.................................................................................................. 10<br />
2-5 Age <strong>of</strong> Housing Stock.......................................................................................................... 11<br />
2-6 Overcrowding ...................................................................................................................... 13<br />
2-7 Population by Race and Ethnicity: 2000.............................................................................. 14<br />
2-8 Age Distribution: 1990 and 2000......................................................................................... 16<br />
2-9 Educational Attainment <strong>of</strong> Population 25 years and older: 2000 ........................................ 18<br />
2-10 Labor Force: 1990 to 2000................................................................................................... 20<br />
2-11 Comparative Unemployment Rates: 1994 and 2004 ........................................................... 21<br />
2-11 Distribution <strong>of</strong> Income: 1990-2000 ..................................................................................... 23<br />
2-12 Average Household Income................................................................................................. 24<br />
2-13 Population, Households and Employment: Projections 2000-2030 ................................... 26<br />
3-1 Total Employment: 1994-2004........................................................................................... 29<br />
3-2 Employment by Sector: 2001-2004 ..................................................................................... 30<br />
3-3 Number <strong>of</strong> Establishments, Employment and Wages: 2001-2004 ...................................... 32<br />
3-4 Distribution <strong>of</strong> Establishments by Sectors: 2001 to 2004.................................................... 35<br />
3-5 Distribution <strong>of</strong> Firms by ZIP Codes..................................................................................... 37<br />
3-6 Locational Index <strong>of</strong> Sectors by ZIP Codes: 2003 ................................................................ 38<br />
3-7 Comparative Sectoral Specialization by Employment Distribution: 2004.......................... 39<br />
4-1 <strong>City</strong> <strong>of</strong> <strong>Inglewood</strong> Taxable Sales Trends: 1994-2004 ......................................................... 40<br />
4-2 <strong>City</strong> <strong>of</strong> <strong>Inglewood</strong> Taxable Sales by Retail Category: 1994-2004 ...................................... 42<br />
4-3 South Bay Cities: Taxable Retail Sales Trends: 1994 to 2004 ............................................ 44<br />
4-4 Comparative Per Capita Taxable Retail Sales: 2004 ........................................................... 45<br />
4-5 Retail Market Inventory: 2006............................................................................................. 47<br />
4-6 Retail Market Lease and Vacancy Rates: 2006 ................................................................... 48<br />
5-1 Non-Residential Building Permit Valuations: 1994-2004................................................... 49<br />
5-2 Residential Building Activity: 1994-2004........................................................................... 51<br />
5-3 Single Family Median Sales Price: February 2006.............................................................. 52<br />
5-4 Condominium Median Sales Price: May 2005 .................................................................... 53<br />
Stanley R. H<strong>of</strong>fman Associates, Inc. iii Economic Conditions and Trends<br />
April 20, 2006<br />
<strong>City</strong> <strong>of</strong> <strong>Inglewood</strong> <strong>General</strong> <strong>Plan</strong> <strong>Update</strong>
6-1 Transient Occupancy Tax Revenues in 2002-2003 ............................................................. 56<br />
A-1 SIC to NAICS Crosswalk .................................................................................................... 58<br />
A-2 Self Employment Rates by NAICS Categories ................................................................... 59<br />
Stanley R. H<strong>of</strong>fman Associates, Inc. iv Economic Conditions and Trends<br />
April 20, 2006<br />
<strong>City</strong> <strong>of</strong> <strong>Inglewood</strong> <strong>General</strong> <strong>Plan</strong> <strong>Update</strong>
FIGURES<br />
1-1 <strong>City</strong> <strong>of</strong> <strong>Inglewood</strong> and Surrounding Areas .....................................................................................3<br />
2-1 Population Trends : 1970-2005....................................................................................................... 6<br />
2-2 Housing Tenure: Occupied Housing Units in 2000....................................................................... 9<br />
2-3 Age <strong>of</strong> Housing Stock.................................................................................................................. 12<br />
2-4 Race and Ethnicity: 2000............................................................................................................. 15<br />
2-5 Age Distribution in <strong>Inglewood</strong> and Los Angeles County............................................................ 17<br />
2-6 AA Degree and Above in <strong>City</strong> <strong>of</strong> <strong>Inglewood</strong>, South Bay Cities and L.A. County: 2000 ........... 19<br />
2-7 Comparative Unemployment Rates: 2004................................................................................... 22<br />
2-8 Average Annual Household Income: 1990-2000 ........................................................................ 24<br />
2-9 Projected Population and Employment Growth: Percent Change 2000 to 2030......................... 27<br />
3-1 Employment by Major Employment Categories: 2004 ............................................................... 29<br />
3-2 Service Sector Categories as Percent <strong>of</strong> Total Service Sector Employment: 2004 ..................... 31<br />
3-3 Average Annual Salary in 8 Largest Employment Sectors: 2004 ............................................... 33<br />
3-4 Average Annual Salary for Service Sector Industries: 2004 ....................................................... 34<br />
3-5 Distribution <strong>of</strong> Establishments by Sector: 2004 .......................................................................... 35<br />
3-6 Distribution <strong>of</strong> Firms by ZIP Codes............................................................................................. 38<br />
4-1 <strong>City</strong> <strong>of</strong> <strong>Inglewood</strong> Taxable Sales Trends: 1994-2004 ................................................................. 41<br />
4-2 Per Capita Taxable Retail Sales: 2004......................................................................................... 43<br />
5-1 Non Residential Building Activity: 1992-2004 ........................................................................... 50<br />
5-2 Residential Building Activity ...................................................................................................... 51<br />
5-3 Comparative Median Contract Rent: 2000 and 2006 .................................................................. 54<br />
Stanley R. H<strong>of</strong>fman Associates, Inc. v Economic Conditions and Trends<br />
April 20, 2006<br />
<strong>City</strong> <strong>of</strong> <strong>Inglewood</strong> <strong>General</strong> <strong>Plan</strong> <strong>Update</strong>
EXECUTIVE SUMMARY<br />
The purpose <strong>of</strong> this report is to provide an understanding <strong>of</strong> the existing demographic and<br />
economic conditions and trends in the <strong>City</strong> <strong>of</strong> <strong>Inglewood</strong> and the larger growth dynamics <strong>of</strong> the<br />
surrounding area. This provides the background information for evaluating significant economic<br />
issues, economic goals and policies and planning implications for the <strong>City</strong>’s <strong>General</strong> <strong>Plan</strong> update<br />
process.<br />
The <strong>City</strong>’s economic goals will encompass a range <strong>of</strong> areas, including: the creation <strong>of</strong> more<br />
residential opportunities; development <strong>of</strong> retail opportunities; and the pursuit <strong>of</strong> economic<br />
development opportunities oriented towards a diverse economic base. The following presents<br />
the key findings and trends, including: demographic trends; residential trends; employment<br />
trends; growth projections and market conditions and trends.<br />
Key Economic Issues<br />
• In the context <strong>of</strong> globalization, the US economy is witnessing a shift away from lower<br />
skilled manufacturing and service sector jobs, resulting in shrinking employment<br />
opportunities for lower education and lower skilled sections <strong>of</strong> the workforce.<br />
• The <strong>City</strong> <strong>of</strong> <strong>Inglewood</strong> needs to consolidate its present competitive advantage in sectors<br />
like Health Care and Social Services, and Transportation and Warehousing, while taking<br />
active policy measures to attract higher skilled activities in Scientific and Technical,<br />
Information, and the Finance, Insurance and Real Estate (FIRE) sectors.<br />
• The <strong>City</strong>’s existing employment base, with one-third <strong>of</strong> all jobs in the services sector, has<br />
the effect <strong>of</strong> lowering the average wage <strong>of</strong> local employment opportunities. The <strong>City</strong><br />
needs to expand other sectors like pr<strong>of</strong>essional services and specialized manufacturing.<br />
• In order to complement higher skilled activities, the <strong>City</strong> needs to pay special attention to<br />
education and skill enhancement programs for the resident workforce. The <strong>City</strong>’s resident<br />
labor force currently has lower levels <strong>of</strong> higher education compared to Los Angeles<br />
County averages.<br />
• The <strong>City</strong> is currently witnessing leakage in most <strong>of</strong> its retail categories, with only <strong>General</strong><br />
Merchandise performing above the Los Angeles County per capita average retail sales.<br />
This indicates that the <strong>City</strong> has the opportunity to attract retail centers with greater<br />
community and regional focus.<br />
• The <strong>City</strong> has the opportunity to facilitate the redevelopment <strong>of</strong> large underutilized<br />
properties like the Hollywood Park and the Forum. The future expansion <strong>of</strong> Hollywood<br />
Park for gaming purposes is contingent on whether casino gaming in California is<br />
allowed outside Indian Reservations.<br />
• The <strong>City</strong> needs to leverage certain key locational attributes in order to enhance its<br />
competitive advantage. These opportunities include proximity to LAX, the LA-Long<br />
Stanley R. H<strong>of</strong>fman Associates, Inc. vi Economic Conditions and Trends<br />
April 20, 2006<br />
<strong>City</strong> <strong>of</strong> <strong>Inglewood</strong> <strong>General</strong> <strong>Plan</strong> <strong>Update</strong>
Beach Port, local and regional connectivity through proximity to freeways I-405, I-105<br />
and I-101, and the Metro Green Line along the I-105.<br />
• The increasing attention being paid to public transportation in the wider Los Angeles and<br />
Southern California region needs to be incorporated into long-term development<br />
opportunities for the <strong>City</strong> and its local residents.<br />
• These development opportunities include transit oriented development and development<br />
<strong>of</strong> technology and business parks.<br />
• Being located adjacent to LAX, the greater <strong>Inglewood</strong> is already a favored lodging<br />
destination for tourists. Increasing public transportation connectivity within Los Angeles<br />
and the wider Southern California region will likely to create more lodging opportunities<br />
within the <strong>City</strong>.<br />
• Further, the <strong>City</strong> provides excellent future opportunities for businesses that serve<br />
specialized tourist needs.<br />
Demographic Trends<br />
• In the five-year period from 2000 to 2005, <strong>Inglewood</strong>’s population increased from<br />
112,580 in 2000 to 118,164 in 2005, at an average annual growth rate <strong>of</strong> 0.97 percent.<br />
• The average household size in <strong>Inglewood</strong> increased from 2.91 in 2000 to 3.22 in 2005.<br />
Similar increases in average household size have occurred in both the South Bay Cities<br />
and Los Angeles County.<br />
• The <strong>City</strong> <strong>of</strong> <strong>Inglewood</strong>’s average annual growth rate was also much lower than that <strong>of</strong> the<br />
South Bay Cities, 0.27 percent as compared to 0.63 percent in the period from 1990 to<br />
2000 and 0.97 as compared to 1.27 in the period from 2000 to 2005.<br />
• The <strong>City</strong> <strong>of</strong> <strong>Inglewood</strong> is the second largest incorporated city in the South Bay,<br />
representing about 15 percent <strong>of</strong> the South Bay’s population.<br />
Housing and Overcrowding<br />
• In both 1990 and 2000, about 36 percent <strong>of</strong> <strong>Inglewood</strong>’s population owned their housing<br />
unit while about 64 percent rented their place <strong>of</strong> residence.<br />
• Severe overcrowding, as defined as 1.51 or more occupants per room, increased<br />
significantly between 1990 and 2000 in both <strong>Inglewood</strong> and Los Angeles County. There<br />
was a 28.1 percent increase in the number <strong>of</strong> severely overcrowded housing units in<br />
<strong>Inglewood</strong> and a 35.3 percent increase in Los Angeles County.<br />
• Overcrowded units are a reflection <strong>of</strong> the increasing population growth without a relative<br />
increase in the number <strong>of</strong> housing units to meet this need.<br />
Race and Ethnicity<br />
• The <strong>City</strong>’s racial composition is markedly different from that <strong>of</strong> Los Angeles County as<br />
whole. In 2000, the non-Hispanic White population comprised only 4.1 percent <strong>of</strong><br />
<strong>Inglewood</strong>’s population, compared with 31.1 percent in the County.<br />
Stanley R. H<strong>of</strong>fman Associates, Inc. vii Economic Conditions and Trends<br />
April 20, 2006<br />
<strong>City</strong> <strong>of</strong> <strong>Inglewood</strong> <strong>General</strong> <strong>Plan</strong> <strong>Update</strong>
• In addition, the Black population in <strong>Inglewood</strong> is much greater than that <strong>of</strong> the County;<br />
46.4 percent <strong>of</strong> <strong>Inglewood</strong>’s population is Black as compared to just 9.5 percent <strong>of</strong> the<br />
County as a whole.<br />
• Persons <strong>of</strong> Hispanic origin are relatively equally represented in both the <strong>City</strong> and County.<br />
The <strong>City</strong> <strong>of</strong> <strong>Inglewood</strong>’s population is 46.0 percent Hispanic while L.A. County is 44.6<br />
percent Hispanic.<br />
Age Distribution <strong>of</strong> Population<br />
• In both <strong>Inglewood</strong> and Los Angeles County, the age group 35 to 64 is the largest portion<br />
<strong>of</strong> the population. This broad age group is considered to be the most experienced segment<br />
<strong>of</strong> the labor force.<br />
• As shown, in both <strong>Inglewood</strong> and Los Angeles County, those under age 18 are continuing<br />
to become an even larger segment <strong>of</strong> the population. This group consists primarily <strong>of</strong><br />
minors who are not <strong>of</strong> working age.<br />
• In both <strong>Inglewood</strong> and Los Angeles County, those in the entry level labor force age<br />
group, 18 to 34 years <strong>of</strong> age, have declined significantly from their 1990 levels.<br />
• With respect to those 65 years and over, the proportion <strong>of</strong> the population in this age<br />
group has remained relatively constant in both the <strong>City</strong> <strong>of</strong> <strong>Inglewood</strong> and Los Angeles<br />
County, as a whole.<br />
Educational Attainment<br />
• The <strong>City</strong>’s population age, 25 years and older, has achieved markedly lower levels <strong>of</strong><br />
higher education than the total for the South Bay Cities and Los Angeles County.<br />
Employment<br />
• Sales and <strong>of</strong>fice occupations are the largest category <strong>of</strong> the labor force in the <strong>City</strong> <strong>of</strong><br />
<strong>Inglewood</strong>, comprising 30.7 percent <strong>of</strong> the total jobs. This is slightly higher than Los<br />
Angeles County, which has 27.6 percent <strong>of</strong> the labor force employed in sales and <strong>of</strong>fice<br />
occupations.<br />
• The Management and Pr<strong>of</strong>essional occupations comprised 24.6 percent <strong>of</strong> <strong>Inglewood</strong>’s<br />
labor force while 34.3 percent <strong>of</strong> Los Angeles County’s labor force were in this category.<br />
• In 2004, the unemployment rate in <strong>Inglewood</strong> was the second highest among the South<br />
Bay Cities at 8.3 percent, compared to 6.6 percent for Los Angeles County.<br />
Employment Trends<br />
• The <strong>City</strong>’s total employment (including self-employment) grew marginally from 30,886<br />
in 1994 to 31,127 in 2004, at an annual average growth rate <strong>of</strong> 0.1 percent.<br />
• In 2004, services formed the largest employment sector in the <strong>City</strong> with nearly 32 percent<br />
<strong>of</strong> the total jobs.<br />
• Manufacturing declined by 31.9 percent from an estimated 2,685 jobs in 2001 to 1829<br />
jobs in 2004.<br />
Stanley R. H<strong>of</strong>fman Associates, Inc. viii Economic Conditions and Trends<br />
April 20, 2006<br />
<strong>City</strong> <strong>of</strong> <strong>Inglewood</strong> <strong>General</strong> <strong>Plan</strong> <strong>Update</strong>
• Finance, Insurance and Real Estate (FIRE) declined by 32.2 percent and Pr<strong>of</strong>essional and<br />
Technical Services declined by 45.8 percent.<br />
Wage Trends<br />
• The annual average salary in the <strong>City</strong> <strong>of</strong> <strong>Inglewood</strong> declined by 4.5 percent in constant<br />
2005 dollars from $42,683 to $40,773 from 2001 to 2004.<br />
• Entertainment and Recreation jobs had the highest average salary <strong>of</strong> $81,424, followed<br />
by Government and Manufacturing jobs at $47,253 and $44,159, respectively.<br />
• Average salaries in the Wholesale, Services and Retail sectors are below the <strong>City</strong> average<br />
salaries <strong>of</strong> $40,733. These sectors comprised nearly 47 percent <strong>of</strong> the total employment in<br />
the <strong>City</strong> in 2004.<br />
Household Income<br />
• As shown, the average household income in constant 2006 dollars for the <strong>City</strong> was<br />
$54,732 in 2000, much lower than the average household incomes <strong>of</strong> the South Bay cities<br />
and the County.<br />
<strong>Inglewood</strong>’s Economy Compared with the Los Angeles County<br />
• In 2004, <strong>Inglewood</strong> had a 4.4-times higher share <strong>of</strong> employment in the Arts,<br />
Entertainment and Recreation sector compared to the County. This can be explained by<br />
the relatively higher impact <strong>of</strong> the Hollywood Park Race Track and Casino on the <strong>City</strong>’s<br />
employment base.<br />
• The economy <strong>of</strong> <strong>Inglewood</strong> was also relatively more specialized compared to Los<br />
Angeles County, as measured by the percent share <strong>of</strong> employment, in Transportation and<br />
Warehousing (3.2-times) and Health Care and Social Services (1.7-times).<br />
• However, the below–average employment shares relative to Los Angeles County in<br />
Pr<strong>of</strong>essional, Scientific and Technical (0.2-times), Information (0.2-times),<br />
Manufacturing (0.5-times) and Finance, Insurance and Real Estate (0.6-times), indicate<br />
sectors for potential future growth in the <strong>City</strong>.<br />
Taxable Sales<br />
• Total taxable sales transactions in the <strong>City</strong> <strong>of</strong> <strong>Inglewood</strong> have grown from 1994 to 2004,<br />
increasing in constant 2005 dollars from about $675.0 million in 1993 to $833.2 million<br />
in 2004.<br />
• Taxable Retail sales in the <strong>City</strong> <strong>of</strong> <strong>Inglewood</strong> followed a pattern <strong>of</strong> initial decline from<br />
1994 to1999 and then rose appreciably from 2000 to 2004. These trends can be explained<br />
by stronger sales performance in key retail categories including <strong>General</strong> Merchandise,<br />
Building Materials and Apparel.<br />
• Per capita taxable retail sales in <strong>Inglewood</strong> were relatively low at $5,998 amongst the<br />
cities in the South Bay; about 67 percent <strong>of</strong> the $8,980 area average.<br />
Stanley R. H<strong>of</strong>fman Associates, Inc. ix Economic Conditions and Trends<br />
April 20, 2006<br />
<strong>City</strong> <strong>of</strong> <strong>Inglewood</strong> <strong>General</strong> <strong>Plan</strong> <strong>Update</strong>
• Only <strong>General</strong> Merchandise performed above the Los Angeles County per capita average<br />
retail sales, indicating sizable retail leakage in most <strong>of</strong> <strong>Inglewood</strong>’s retail categories.<br />
• Long-term fiscal well-being <strong>of</strong> the <strong>City</strong> is important. Municipal revenues are needed for<br />
maintenance and improvement <strong>of</strong> infrastructure to accommodate growth. A balance <strong>of</strong><br />
land uses should be the goal in order to provide key public revenues such as property tax<br />
and sales tax.<br />
Market Conditions<br />
• Sixteen retail centers surveyed in <strong>Inglewood</strong> have a total <strong>of</strong> 1,572,788 square feet <strong>of</strong> retail<br />
space; slightly over half <strong>of</strong> this space has been built since 2004. However, the <strong>City</strong> is<br />
generally lacking in strong regional retail centers.<br />
• The overall vacancy rate <strong>of</strong> these sixteen centers is relatively low at an estimated 4.3<br />
percent.<br />
• With its mix <strong>of</strong> retail and dining establishments, Downtown appears to be primarily a<br />
local-serving district.<br />
Real Estate Trends<br />
• The valuation for new commercial buildings displayed significant fluctuation over the 10<br />
year time period from 1994 to 2004. The valuation (in constant 2006 dollars) for new<br />
commercial buildings increased from just $612,000 in 1995 to about 28.3 million in<br />
2003.<br />
• In comparison, the addition <strong>of</strong> new industrial valuation over the same time period has<br />
been virtually non-existent.<br />
• The data indicates that on an average, 31 new residential units were permitted every year,<br />
<strong>of</strong> which 12 were single-family units and 20 were multi-family units. However, at least<br />
200 more units have been added to the housing stock since 2004.<br />
• The median price <strong>of</strong> a single-family residence sold in the <strong>City</strong> <strong>of</strong> <strong>Inglewood</strong> in February,<br />
2006 was $475,000. The median price <strong>of</strong> a condominium sold in the <strong>City</strong> <strong>of</strong> <strong>Inglewood</strong> in<br />
February, 2006 was around $330,000.<br />
Stanley R. H<strong>of</strong>fman Associates, Inc. x Economic Conditions and Trends<br />
April 20, 2006<br />
<strong>City</strong> <strong>of</strong> <strong>Inglewood</strong> <strong>General</strong> <strong>Plan</strong> <strong>Update</strong>
Chapter 1 - INTRODUCTION<br />
1.1 Background and Purpose <strong>of</strong> Report<br />
The purpose <strong>of</strong> this report is to provide an understanding <strong>of</strong> the existing demographic and<br />
economic conditions and trends in the <strong>City</strong> <strong>of</strong> <strong>Inglewood</strong> and the larger growth dynamics <strong>of</strong> the<br />
surrounding area. This economic trends report includes baseline data and trends related to<br />
population, housing, employment, taxable sales and residential and non-residential market<br />
conditions.<br />
The findings <strong>of</strong> the report will provide the framework for preparing economic goals and policies<br />
and facilitate discussion <strong>of</strong> existing and future economic development efforts. These goals and<br />
policies will be developed within the context <strong>of</strong> the <strong>General</strong> <strong>Plan</strong> to insure that the <strong>City</strong> is able to<br />
maintain a strong economic base and take advantage <strong>of</strong> future employment opportunities. A<br />
strong economy not only provides the local workers with adequate income to afford a high<br />
quality <strong>of</strong> life, but it also provides local government with adequate public revenues to maintain a<br />
high quality <strong>of</strong> public services.<br />
The goal is to identify target economic opportunities that are both realistic and compatible with<br />
the <strong>City</strong>’s <strong>General</strong> <strong>Plan</strong> vision. In this context, the growth <strong>of</strong> the <strong>City</strong>’s economic base will<br />
depend on the identification <strong>of</strong> key industries that can be attracted to the <strong>City</strong> and support a<br />
diversified economy. Job types, salary and skill levels, income, land availability and location,<br />
and housing affordability are also important attributes <strong>of</strong> the economy.<br />
1.2 Organization <strong>of</strong> Report<br />
The following chapters <strong>of</strong> the report address the existing demographics and market conditions in<br />
the <strong>City</strong>, as well as economic trends.<br />
• The Executive Summary presents key economic issues and opportunities;<br />
• Chapter 1 presents the background, the purpose and organization <strong>of</strong> the report as well<br />
as the geographic study area boundaries and sources <strong>of</strong> information;<br />
• Chapter 2 – Community Overview, provides demographics related to population,<br />
households, income and labor force for the <strong>City</strong> compared to other South Bay<br />
communities and Los Angeles County;<br />
• Chapter 3—Business Setting, covers economic trends on employment and wages for<br />
the <strong>City</strong> and the County;<br />
Stanley R. H<strong>of</strong>fman Associates, Inc. 1 Economic Conditions and Trends<br />
April 20, 2006<br />
<strong>City</strong> <strong>of</strong> <strong>Inglewood</strong> <strong>General</strong> <strong>Plan</strong> <strong>Update</strong>
• Chapter 4 provides an assessment <strong>of</strong> current market conditions, including taxable<br />
retail and non-retail sales,<br />
• Chapter 5 includes trends <strong>of</strong> residential, commercial and industrial real estate market<br />
<strong>of</strong> the <strong>City</strong> and the region;<br />
• Chapter 6 addresses locational opportunities, including those concerning the Los<br />
Angeles International Airport, Hollywood Park and the lodging industry;<br />
1.3 Regional Setting<br />
<strong>Inglewood</strong> is centrally located within the Los Angeles Basin. The <strong>City</strong> <strong>of</strong> <strong>Inglewood</strong> is the<br />
northernmost <strong>City</strong> in the South Bay region <strong>of</strong> Los Angeles County. This region includes the<br />
cities <strong>of</strong> <strong>Inglewood</strong>, El Segundo, Hawthorne, Gardena, Lawndale, Manhattan Beach, Hermosa<br />
Beach, Redondo Beach, Torrance, Carson, Palos Verdes Estates, Lomita, Rolling Hills, Rolling<br />
Hills Estates, and Rancho Palos Verdes. The South Bay also includes portions <strong>of</strong> the <strong>City</strong> <strong>of</strong> Los<br />
Angeles along the Harbor Freeway and unincorporated parts <strong>of</strong> Los Angeles County. <strong>Inglewood</strong><br />
is bordered by the <strong>City</strong> <strong>of</strong> Los Angeles to the north and east, Hawthorne to the south, and LAX<br />
to the west. The <strong>City</strong> is adjacent to Los Angeles International Airport (LAX) and also about 15<br />
miles from the Los Angeles/Long Beach Port Complex.<br />
Two freeways directly serve <strong>Inglewood</strong>. The Century (105) Freeway runs from Norwalk to LAX<br />
and is accessible in the southern part <strong>of</strong> the <strong>City</strong>. The San Diego (405) Freeway runs from<br />
southern Orange County through the San Fernando Valley and is accessible in the western part<br />
<strong>of</strong> the <strong>City</strong>. In addition to direct freeway access, <strong>Inglewood</strong> is in close proximity to the Harbor<br />
(110) Freeway, which runs from Pasadena through Downtown Los Angeles to the Port <strong>of</strong> Los<br />
Angeles and the Santa Monica (10) Freeway, which runs east from the ocean in Santa Monica<br />
through Downtown Los Angeles to the Inland Empire. A regional vicinity map is presented in<br />
Figure1-1.<br />
Stanley R. H<strong>of</strong>fman Associates, Inc. 2 Economic Conditions and Trends<br />
April 20, 2006<br />
<strong>City</strong> <strong>of</strong> <strong>Inglewood</strong> <strong>General</strong> <strong>Plan</strong> <strong>Update</strong>
Figure 1-1<br />
<strong>City</strong> <strong>of</strong> <strong>Inglewood</strong> and Surrounding Areas<br />
Source: Stanley R.H<strong>of</strong>fman Associates, Inc.<br />
1-1 <strong>City</strong> <strong>of</strong> <strong>Inglewood</strong> and Surrounding Areas<br />
Stanley R. H<strong>of</strong>fman Associates, Inc. 3 Economic Conditions and Trends<br />
April 20, 2006<br />
<strong>City</strong> <strong>of</strong> <strong>Inglewood</strong> <strong>General</strong> <strong>Plan</strong> <strong>Update</strong>
1.4 Sources <strong>of</strong> Information<br />
This study is based upon information from several sources including:<br />
• A field survey <strong>of</strong> the <strong>City</strong> <strong>of</strong> <strong>Inglewood</strong>;<br />
• Taxable sales data for the <strong>City</strong> <strong>of</strong> <strong>Inglewood</strong>, annual data for 1994 and 2004, from the<br />
California State Board <strong>of</strong> Equalization.<br />
• Economic and demographic data from the U.S. Bureau <strong>of</strong> the Census, 1990 and 2000,<br />
and the California Department <strong>of</strong> Finance, 2005;<br />
• Population, Household and Employment projections for 2000 – 2030 from the Southern<br />
California Association <strong>of</strong> Governments (SCAG) Regional Transportation <strong>Plan</strong>, 2004;<br />
• Building activity data for the <strong>City</strong> <strong>of</strong> <strong>Inglewood</strong> from the Construction Industry Research<br />
Board (CIRB) for 1995- 2005;<br />
• Interviews with key individuals knowledgeable about economic conditions in the <strong>City</strong> <strong>of</strong><br />
<strong>Inglewood</strong>.<br />
• Published literature regarding retail activity, including the National Research Bureau’s<br />
2003 Shopping Center Directory and the Urban Land Institute’s Dollars and Cents <strong>of</strong><br />
Shopping Centers, 2004;<br />
• <strong>Inglewood</strong> Economic Development Opportunities Assessment Report, Volume I, Kosmont<br />
Partners, February 2003;<br />
• <strong>City</strong> <strong>of</strong> <strong>Inglewood</strong> <strong>City</strong>wide Economic Development Strategic <strong>Plan</strong>. Wilbur Smith<br />
Associates in Association with USC Center for Economic Development, January, 2005;<br />
Stanley R. H<strong>of</strong>fman Associates, Inc. 4 Economic Conditions and Trends<br />
April 20, 2006<br />
<strong>City</strong> <strong>of</strong> <strong>Inglewood</strong> <strong>General</strong> <strong>Plan</strong> <strong>Update</strong>
Chapter 2 – COMMUNITY OVERVIEW<br />
This chapter provides a descriptive pr<strong>of</strong>ile <strong>of</strong> demographic characteristics and trends for the <strong>City</strong><br />
<strong>of</strong> <strong>Inglewood</strong>. This includes population, households, household income, housing characteristics<br />
and employment. In addition, key demographics for the South Bay communities, including<br />
population, households and income are discussed.<br />
2.1 Population<br />
Population Growth from 1970 to 2005<br />
• Figure 2-1 illustrates the population growth trends for the <strong>City</strong> <strong>of</strong> <strong>Inglewood</strong> from 1970 to<br />
2005; in this period <strong>of</strong> time, the average annualized growth rate was 0.78 percent.<br />
• As shown, modest growth occurred in the period from 1970 to 1980; this increase from<br />
89,985 in 1970 to 94,162 in 1980 represents an increase in the population <strong>of</strong> 4,177, which<br />
amounts to an average annualized growth rate <strong>of</strong> 0.46 percent.<br />
• As shown, the most rapid rate <strong>of</strong> growth occurred in the 1980’s when the population jumped<br />
from 94,162 in 1980 to 109,602 in 1990. This increase <strong>of</strong> over 15,000 represents more than a<br />
15 percent increase in the total population and amounts to an average annualized growth rate<br />
<strong>of</strong> 1.53 percent.<br />
• As shown, population growth leveled <strong>of</strong>f considerably in the 1990’s. In this ten year period,<br />
the population increased from 109,602 in 1990 to 112,580 in 2000; this amounts to an<br />
average annualized growth rate <strong>of</strong> only 0.29 percent.<br />
• In the five-year period from 2000 to 2005, <strong>Inglewood</strong>’s population has increased<br />
significantly. As shown, the population increased from 112,580 in 2000 to 118,164 in 2005,<br />
a net increase <strong>of</strong> 5,584. This amounts to an average annualized growth rate <strong>of</strong> 0.97 percent.<br />
• Only about 13.4 percent <strong>of</strong> the housing stock in the <strong>City</strong> was built from 1980 to 2000. In<br />
comparison, 19.2 percent <strong>of</strong> the housing stock in the County was built during this period.<br />
Stanley R. H<strong>of</strong>fman Associates, Inc. 5 Economic Conditions and Trends<br />
April 20, 2006<br />
<strong>City</strong> <strong>of</strong> <strong>Inglewood</strong> <strong>General</strong> <strong>Plan</strong> <strong>Update</strong>
Figure 2-1<br />
Population Trends: 1970-2005<br />
120,000<br />
118,164<br />
115,000<br />
110,000<br />
109,602<br />
110,900<br />
112,580<br />
105,000<br />
103,500<br />
100,000<br />
95,000<br />
89,900<br />
94,162<br />
90,000<br />
89,985<br />
85,000<br />
80,000<br />
1970 1975 1980 1985 1990 1995 2000 2005<br />
Source: Stanley R. H<strong>of</strong>fman Associates, Inc.<br />
U.S. Bureau <strong>of</strong> the Census, 1990 and 2000.<br />
2-1 Population Trends : 1970-2005<br />
Stanley R. H<strong>of</strong>fman Associates, Inc. 6 Economic Conditions and Trends<br />
April 20, 2006<br />
<strong>City</strong> <strong>of</strong> <strong>Inglewood</strong> <strong>General</strong> <strong>Plan</strong> <strong>Update</strong>
Population Growth from 2000 to 2005 in <strong>Inglewood</strong> and the South Bay Cities<br />
• Table 2-1 presents the populations for the <strong>City</strong> <strong>of</strong> <strong>Inglewood</strong> and select South Bay Cities<br />
in 1990, 2000, and from 2001 to 2005. The 1990 and 2000 data come from the decennial<br />
census while the 2005 data is provided by the California State Department <strong>of</strong> Finance.<br />
• Though the population <strong>of</strong> the <strong>City</strong> <strong>of</strong> <strong>Inglewood</strong> went up only slightly in the period from<br />
1990 to 2000 (2.7 percent), within the five year period from 2000 to 2005, the <strong>City</strong> <strong>of</strong><br />
<strong>Inglewood</strong>’s population increased by 5.0 percent. Compared to other South Bay<br />
communities, however, <strong>Inglewood</strong>’s population growth has been quite modest.<br />
• The <strong>City</strong> <strong>of</strong> <strong>Inglewood</strong>’s average annual growth rate was also lower than the average <strong>of</strong><br />
the South Bay Cities, 0.27 percent as compared to 0.63 percent in the period from 1990 to<br />
2000 and 0.97 as compared to 1.27 in the period from 2000 to 2005.<br />
Table 2-1<br />
Population Trends: 1990-2000 and 2000-2005<br />
1990 2000 2005<br />
Annualized<br />
Growth<br />
Rate 1990-<br />
2000<br />
Annualized<br />
Growth<br />
Rate 2000-<br />
2005<br />
<strong>Inglewood</strong> 109,602 112,580 118,164 0.27% 0.97%<br />
Carson 83,995 89,730 98,329 0.66% 1.85%<br />
El Segundo 15,223 16,033 17,024 0.52% 1.21%<br />
Gardena 49,847 57,746 61,072 1.48% 1.13%<br />
Hawthorne 71,349 84,112 88,790 1.66% 1.09%<br />
Hermosa Beach 18219 18,566 19,608 0.19% 1.10%<br />
Lawndale 27,331 31,711 33,458 1.50% 1.08%<br />
Lomita 19,382 20,046 21,153 0.34% 1.08%<br />
Manhattan Beach 32063 33,852 36,843 0.54% 1.71%<br />
Palos Verdes Estates 13512 13,340 14,208 -0.13% 1.27%<br />
Rancho Palos Verdes 41659 41,145 43,525 -0.12% 1.13%<br />
Redondo Beach 60167 63,261 67,325 0.50% 1.25%<br />
Rolling Hills 1871 1,871 1,983 0.00% 1.17%<br />
Rolling Hills Estates 7789 7,676 8,191 -0.15% 1.31%<br />
Torrance 133,107 137,946 147,405 0.36% 1.34%<br />
Total South Bay Cities 685,116 729,615 777,078 0.63% 1.27%<br />
Sources: Stanley R. H<strong>of</strong>fman Associates, Inc.<br />
U.S. Bureau <strong>of</strong> the Census, 1990 and 2000.<br />
California Department <strong>of</strong> Finance.<br />
2-1 Population Trends: 1990-2000 and 2000-2005<br />
2.2 Households<br />
The following section presents the most recent population and housing estimates for the <strong>City</strong> <strong>of</strong><br />
<strong>Inglewood</strong>, the South Bay, and Los Angeles County.<br />
Stanley R. H<strong>of</strong>fman Associates, Inc. 7 Economic Conditions and Trends<br />
April 20, 2006<br />
<strong>City</strong> <strong>of</strong> <strong>Inglewood</strong> <strong>General</strong> <strong>Plan</strong> <strong>Update</strong>
• Table 2-2 presents the most recent demographic information available as provided by the<br />
California State Department <strong>of</strong> Finance. As shown, as <strong>of</strong> January 1, 2005, The <strong>City</strong> <strong>of</strong><br />
<strong>Inglewood</strong> had an estimated population <strong>of</strong> 118,164. The South Bay Cities had an<br />
estimated population <strong>of</strong> 777,078.<br />
• The <strong>City</strong> <strong>of</strong> <strong>Inglewood</strong> is the second largest incorporated city in the South Bay,<br />
representing about 15 percent <strong>of</strong> the South Bay’s population.<br />
• As shown, <strong>Inglewood</strong> has an average household size <strong>of</strong> 3.22 persons per household. This<br />
is larger than the other South Bay Cities communities with the exceptions <strong>of</strong> Carson and<br />
Lawndale, which have average persons per households <strong>of</strong> 3.83 and 3.49, respectively.<br />
• <strong>Inglewood</strong>’s Persons per Household average has increased from 2.91 in 2000 to 3.22 in<br />
2005. Similar increases in average household size have occurred in both the South Bay<br />
Cities and Los Angeles County.<br />
Table 2-2<br />
Demographic Pr<strong>of</strong>ile <strong>of</strong> Market Area: 2000 & 2005<br />
Population<br />
2000<br />
Occupied<br />
Units<br />
Persons Per<br />
Household<br />
Population<br />
2005<br />
Occupied<br />
Units<br />
Person Per<br />
Household<br />
<strong>Inglewood</strong> 112,580 38,648 2.91 118,164 36,724 3.22<br />
Carson 89,730 25,337 3.54 98,329 25,667 3.83<br />
El Segundo 16,033 7,261 2.21 17,024 7,124 2.39<br />
Gardena 57,746 21,041 2.74 61,072 20,437 2.99<br />
Hawthorne 84,112 29,629 2.84 88,790 28,630 3.10<br />
Hermosa Beach 18,566 9,840 1.89 19,608 9,510 2.06<br />
Lawndale 31,711 9,869 3.21 33,458 9,580 3.49<br />
Lomita 20,046 8,295 2.42 21,153 8,038 2.63<br />
Manhattan Beach 33,852 15,034 2.25 36,843 14,975 2.46<br />
Palos Verdes Estates 13,340 5,202 2.56 14,208 5,054 2.81<br />
Rancho Palos Verdes 41,145 15,709 2.62 43,525 15,344 2.84<br />
Redondo Beach 63,261 29,543 2.14 67,325 28,889 2.33<br />
Rolling Hills 1,871 682 2.74 1,983 650 3.05<br />
Rolling Hills Estates 7,676 2,880 2.67 8,191 2,847 2.88<br />
Torrance 137,946 55,967 2.46 147,405 55,407 2.66<br />
Total South Bay Cities 729,615 274,937 2.65 777,078 268,876 2.89<br />
Los Angeles County 9,519,330 3,270,906 2.91 10,226,506 3,201,352 3.19<br />
Sources: Stanley R. H<strong>of</strong>fman Associates, Inc.<br />
California State Department <strong>of</strong> Finance, January 1, 2005.<br />
2-2 Demographic Pr<strong>of</strong>ile <strong>of</strong> Market Area: 2000-2005<br />
2.3 Tenure<br />
• As shown in Table 2-3, in both 1990 and 2000, about 36 percent <strong>of</strong> <strong>Inglewood</strong>’s population<br />
owned their housing unit while about 64 percent rented their place <strong>of</strong> residence.<br />
• Los Angeles County as a whole had a higher home ownership rate. As shown, in both 1990<br />
and 2000 about 48 percent <strong>of</strong> those living in Los Angeles County owned their housing unit<br />
while 52 percent rented their place <strong>of</strong> residence.<br />
Stanley R. H<strong>of</strong>fman Associates, Inc. 8 Economic Conditions and Trends<br />
April 20, 2006<br />
<strong>City</strong> <strong>of</strong> <strong>Inglewood</strong> <strong>General</strong> <strong>Plan</strong> <strong>Update</strong>
Table 2-3<br />
Housing Tenure: 1990-2000<br />
1990<br />
Percent<br />
Distribution 2000<br />
Percent<br />
Distribution<br />
Change<br />
<strong>City</strong> <strong>of</strong> <strong>Inglewood</strong><br />
Owner Occupied 13,110 36.3% 13,396 36.4% 2.2%<br />
Renter Occupied 22,992 63.7% 23,421 63.6% 1.9%<br />
Total 36,102 100.0% 36,817 100.0% 2.0%<br />
Los Angeles County<br />
Owner Occupied 1,440,864 48.2% 1,499,694 47.9% 4.1%<br />
Renter Occupied 1,548,688 51.8% 1,634,080 52.1% 5.5%<br />
Total 2,989,552 100.0% 3,133,774 100.0% 4.8%<br />
Sources: Stanley R. H<strong>of</strong>fman Associates, Inc.<br />
U.S. Bureau <strong>of</strong> the Census, 1990 and 2000.<br />
2-3 Housing Tenure: 1990-2000<br />
Figure 2-2<br />
Housing Tenure: Occupied Housing Units in 2000<br />
70.0%<br />
63.6%<br />
60.0%<br />
50.0%<br />
47.9%<br />
52.1%<br />
40.0%<br />
36.4%<br />
30.0%<br />
20.0%<br />
10.0%<br />
0.0%<br />
<strong>Inglewood</strong><br />
Owner Occupied<br />
Los Angeles County<br />
Renter Occupied<br />
Source: Stanley R. H<strong>of</strong>fman Associates, Inc.<br />
U.S. Bureau <strong>of</strong> the Census, 1990 and 2000.<br />
2-2 Housing Tenure: Occupied Housing Units in 2000<br />
Stanley R. H<strong>of</strong>fman Associates, Inc. 9 Economic Conditions and Trends<br />
April 20, 2006<br />
<strong>City</strong> <strong>of</strong> <strong>Inglewood</strong> <strong>General</strong> <strong>Plan</strong> <strong>Update</strong>
2.4 Housing Units<br />
Distribution by Type<br />
• As shown in 2-4, the <strong>City</strong> <strong>of</strong> <strong>Inglewood</strong>’s housing stock remained relatively constant,<br />
actually decreasing slightly from 38,713 in 1990 to 38,639 in 2000 as reported by the<br />
U.S. Census.<br />
• As shown in Table 2-4, single-family units comprised 44.4 percent <strong>of</strong> the dwelling units<br />
in the <strong>City</strong> in 2000. In comparison, Los Angeles County had 55.0 percent singly-family<br />
units in 2000.<br />
• In 2000, 55.0 percent <strong>of</strong> the housing stock in the <strong>City</strong> was comprised <strong>of</strong> multi-family<br />
units, compared to 43.3 percent in Los Angeles County.<br />
• Mobile Homes and other non-standard housing structures comprised only 0.6 percent <strong>of</strong><br />
the total housing stock in the <strong>City</strong> in the year 2000. In comparison, in Los Angeles<br />
County these housing types comprised 1.7 percent <strong>of</strong> the total housing stock in the year<br />
2000.<br />
Table 2-4<br />
Dwelling Units: 1990-2000<br />
1990<br />
Percent<br />
Distribution 2000<br />
Percent<br />
Distribution<br />
Change<br />
<strong>City</strong> <strong>of</strong> <strong>Inglewood</strong><br />
Single Family 16,629 43.0% 17,139 44.4% 3.1%<br />
Multi-Family 21,456 55.4% 21,262 55.0% -0.9%<br />
Mobile Homes/ Other 628 1.6% 238 0.6% -62.1%<br />
Total 38,713 100.0% 38,639 100.0% -0.2%<br />
Los Angeles County<br />
Single Family 1,745,645 55.2% 1,800,905 55.0% 3.2%<br />
Multi-Family 1,361,936 43.1% 1,415,474 43.3% 3.9%<br />
Mobile Homes/ Other 55,729 1.8% 55,790 1.7% 0.1%<br />
Total 3,163,310 100.0% 3,272,169 100.0% 3.4%<br />
Sources: Stanley R. H<strong>of</strong>fman Associates, Inc.<br />
U.S. Bureau <strong>of</strong> the Census, 1990 and 2000.<br />
2-4 Dwelling Units: 1990-2000<br />
Stanley R. H<strong>of</strong>fman Associates, Inc. 10 Economic Conditions and Trends<br />
April 20, 2006<br />
<strong>City</strong> <strong>of</strong> <strong>Inglewood</strong> <strong>General</strong> <strong>Plan</strong> <strong>Update</strong>
Age <strong>of</strong> Housing Stock<br />
• As shown in Table 2-5 and Figure 2-3, the housing stock in the <strong>City</strong> <strong>of</strong> <strong>Inglewood</strong> is<br />
relatively older than that <strong>of</strong> Los Angeles County.<br />
• Only about 13.4 percent <strong>of</strong> the housing stock in the <strong>City</strong> was built from 1980 to 2000. In<br />
comparison, 19.2 percent <strong>of</strong> the housing stock in the County was built during this period.<br />
Table 2-5<br />
Age <strong>of</strong> Housing Stock<br />
No. <strong>of</strong><br />
Units<br />
% <strong>of</strong> Total<br />
<strong>City</strong> <strong>of</strong> <strong>Inglewood</strong><br />
Built 1990 to 2000 1,588 4.1%<br />
Built 1980 to 1989 3,576 9.3%<br />
Built 1970 to 1979 5,624 14.6%<br />
Built 1960 to 1969 8,475 21.9%<br />
Built 1950 to 1959 9,042 23.4%<br />
Built 1940 to 1949 5,907 15.3%<br />
Built 1939 or earlier 4,427 11.5%<br />
Total Units 38,639 100.0%<br />
Percent built since 1980 13.4%<br />
Los Angeles County<br />
Built 1990 to 2000 224,060 6.9%<br />
Built 1980 to 1989 403,184 12.3%<br />
Built 1970 to 1979 509,695 15.6%<br />
Built 1960 to 1969 583,178 17.8%<br />
Built 1950 to 1959 728,336 22.3%<br />
Built 1940 to 1949 400,671 12.2%<br />
Built 1939 or earlier 421,785 12.9%<br />
Total Units 3,270,909 100.0%<br />
Percent built since 1980 19.2%<br />
Sources: Stanley R. H<strong>of</strong>fman Associates, Inc.<br />
U.S. Bureau <strong>of</strong> the Census, 2000.<br />
2-5 Age <strong>of</strong> Housing Stock<br />
Stanley R. H<strong>of</strong>fman Associates, Inc. 11 Economic Conditions and Trends<br />
April 20, 2006<br />
<strong>City</strong> <strong>of</strong> <strong>Inglewood</strong> <strong>General</strong> <strong>Plan</strong> <strong>Update</strong>
Figure 2-3<br />
Age <strong>of</strong> Housing Stock<br />
Before 1939,<br />
11.5%<br />
<strong>City</strong> <strong>of</strong> <strong>Inglewood</strong><br />
1980-2000,<br />
13.4%<br />
1940-1959,<br />
38.7%<br />
1960-1979,<br />
36.5%<br />
Los Angeles County<br />
Before 1939,<br />
12.9%<br />
1980-2000,<br />
19.2%<br />
1940-1959,<br />
34.5%<br />
1960-1979,<br />
33.4%<br />
Source: Stanley R. H<strong>of</strong>fman Associates, Inc.<br />
U.S. Bureau <strong>of</strong> the Census 1990 and 2000.<br />
2-3 Age <strong>of</strong> Housing Stock<br />
Stanley R. H<strong>of</strong>fman Associates, Inc. 12 Economic Conditions and Trends<br />
April 20, 2006<br />
<strong>City</strong> <strong>of</strong> <strong>Inglewood</strong> <strong>General</strong> <strong>Plan</strong> <strong>Update</strong>
2.5 Overcrowding<br />
• Overcrowding is defined as more than 1.0 occupant per room. A housing unit with<br />
more than 1.5 occupants per room is considered to be severely overcrowded.<br />
• Overcrowding increased significantly between 1990 and 2000 in both the <strong>City</strong> <strong>of</strong><br />
<strong>Inglewood</strong> and Los Angeles County.<br />
• As shown in Table 2-6, about 27.9 percent <strong>of</strong> the housing units in the <strong>City</strong> <strong>of</strong><br />
<strong>Inglewood</strong> were overcrowded in 2000, a 5 percentage point increase from the 22.9<br />
percent in 1990. In comparison, in the year 2000, 23.0 percent <strong>of</strong> the housing units<br />
were overcrowded in Los Angeles County as a whole, up from 18.6 percent in 1990.<br />
• Severe overcrowding, as defined as 1.51 or more occupants per room, also increased<br />
significantly between 1990 and 2000 in both <strong>Inglewood</strong> and Los Angeles County. As<br />
shown in Table 2-6, there was a 28.1 percent increase in the number <strong>of</strong> severely<br />
overcrowded housing units in <strong>Inglewood</strong> and a 35.3 percent increase in Los Angeles<br />
County.<br />
• Overcrowded units are a reflection <strong>of</strong> the increasing population growth without a<br />
relative increase in the number <strong>of</strong> housing units to meet this need. Additionally,<br />
overcrowding indicates there may be a lack <strong>of</strong> housing that is suitable or affordable.<br />
Table 2-6<br />
Overcrowding<br />
1990 2000 Change % Change<br />
<strong>City</strong> <strong>of</strong> <strong>Inglewood</strong><br />
1.00 or less occupants per room 27,841 26,546 (1,295) -4.7%<br />
1.01 to 1.50 occupants per room 2,871 3,366 495 17.2%<br />
1.51 or more occupants per room 5,390 6,905 1,515 28.1%<br />
Total Units 36,102 36,817 715 2.0%<br />
Overcrowded Units % <strong>of</strong> Total 22.9% 27.9%<br />
Los Angeles County<br />
1.00 or less occupants per room 2,433,804 2,413,405 (20,399) -0.8%<br />
1.01 to 1.50 occupants per room 207,528 249,094 41,566 20.0%<br />
1.51 or more occupants per room 348,220 471,275 123,055 35.3%<br />
Total Units 2,989,552 3,133,774 144,222 4.8%<br />
Overcrowded Units % <strong>of</strong> Total 18.6% 23.0%<br />
1. More than 1.0 occupant per room is defined as an overcrowded condition.<br />
Sources: Stanley R. H<strong>of</strong>fman Associates, Inc.<br />
U.S. Bureau <strong>of</strong> the Census, 1990 and 2000.<br />
2-6 Overcrowding<br />
Stanley R. H<strong>of</strong>fman Associates, Inc. 13 Economic Conditions and Trends<br />
April 20, 2006<br />
<strong>City</strong> <strong>of</strong> <strong>Inglewood</strong> <strong>General</strong> <strong>Plan</strong> <strong>Update</strong>
2.6 Race and Ethnicity<br />
• As shown in Table 2-7 and Figure 2-4, the <strong>City</strong>’s racial composition is markedly different<br />
from that <strong>of</strong> Los Angeles County as whole. In 2000, the non-Hispanic White population<br />
comprised only 4.1 percent <strong>of</strong> <strong>Inglewood</strong>’s population, compared with 31.1 percent in the<br />
County.<br />
• In addition, the Black population in <strong>Inglewood</strong> is much greater than that <strong>of</strong> the County;<br />
46.4 percent <strong>of</strong> <strong>Inglewood</strong>’s population is Black as compared to just 9.5 percent <strong>of</strong> the<br />
County as a whole.<br />
• Also, while Asians makeup 11.8 percent <strong>of</strong> the County’s population, they makeup just<br />
1.1 percent <strong>of</strong> the <strong>City</strong> <strong>of</strong> <strong>Inglewood</strong>’s population.<br />
• Persons <strong>of</strong> Hispanic origin are relatively equally represented in both the <strong>City</strong> and County.<br />
The <strong>City</strong> <strong>of</strong> <strong>Inglewood</strong>’s population is 46.0 percent Hispanic while Los Angeles County<br />
is 44.6 percent Hispanic.<br />
Table 2-7<br />
Population by Race and Ethnicity: 2000<br />
Race <strong>Inglewood</strong> % <strong>of</strong> Total<br />
Los Angeles<br />
County % <strong>of</strong> Total<br />
Non-Hispanic White 4,628 4.1% 2,959,614 31.1%<br />
Hispanic or Latino (<strong>of</strong> any race) 51,829 46.0% 4,242,213 44.6%<br />
African American 52,260 46.4% 901,472 9.5%<br />
Asian 1,217 1.1% 1,124,569 11.8%<br />
Other 1 802 0.7% 68,809 0.7%<br />
Two or More Races 2 1,844 1.6% 222,661 2.3%<br />
Total 112,580 100.0% 9,519,338 100.0%<br />
1. "Other" category includes American Indian, Alaska Native alone, Native Hawaiian<br />
and Other Pacific Islander alone, and some other race alon as classified in the<br />
2000 census.<br />
2. The new Classification system in the 2000 Census includes an additional category<br />
for origin <strong>of</strong> two or more race.<br />
Sources: Stanley R. H<strong>of</strong>fman Associates, Inc.<br />
U.S. Census Bureau, 2000, P8 Hispanic or Latino by Race<br />
2-7 Population by Race and Ethnicity: 2000<br />
Stanley R. H<strong>of</strong>fman Associates, Inc. 14 Economic Conditions and Trends<br />
April 20, 2006<br />
<strong>City</strong> <strong>of</strong> <strong>Inglewood</strong> <strong>General</strong> <strong>Plan</strong> <strong>Update</strong>
Figure 2-4<br />
Race and Ethnicity: 2000<br />
<strong>City</strong> <strong>of</strong> <strong>Inglewood</strong><br />
Other, 0.7%<br />
Two or More<br />
Races, 1.6%<br />
Non-Hispanic<br />
Asian, 1.1%<br />
White, 4.1%<br />
African American,<br />
46.4%<br />
Hispanic or Latino<br />
(<strong>of</strong> any race),<br />
46.0%<br />
Los Angeles County<br />
Other, 0.7%<br />
Two or More<br />
Races, 2.3%<br />
African American,<br />
9.5%<br />
Asian, 11.8%<br />
Non-Hispanic<br />
White, 31.1%<br />
Hispanic or Latino<br />
(<strong>of</strong> any race),<br />
44.6%<br />
Source: Stanley R. H<strong>of</strong>fman Associates, Inc.<br />
U.S. Bureau <strong>of</strong> the Census 1990 and 2000.<br />
2-4 Race and Ethnicity: 2000<br />
Stanley R. H<strong>of</strong>fman Associates, Inc. 15 Economic Conditions and Trends<br />
April 20, 2006<br />
<strong>City</strong> <strong>of</strong> <strong>Inglewood</strong> <strong>General</strong> <strong>Plan</strong> <strong>Update</strong>
2.7 Age Distribution <strong>of</strong> Population<br />
• As shown in Table 2-8 and Figure 2-5, in both <strong>Inglewood</strong> and Los Angeles County, the<br />
age group 35 to 64 is the largest portion <strong>of</strong> the population. This broad age group is<br />
considered to be the most experienced segment <strong>of</strong> the labor force.<br />
• As shown, in both <strong>Inglewood</strong> and Los Angeles County, those under age 18 are continuing<br />
to become an even larger segment <strong>of</strong> the population. This group consists primarily <strong>of</strong><br />
minors who are not <strong>of</strong> working age. With increased childhood populations, growing<br />
needs for more children and youth services will continue.<br />
• In both <strong>Inglewood</strong> and Los Angeles County, those in the entry level labor force age<br />
group, 18 to 34 years <strong>of</strong> age, have declined significantly from their 1990 levels.<br />
• With respect to those 65 years and over, the proportion <strong>of</strong> the population in this age<br />
group has remained relatively constant in both the <strong>City</strong> <strong>of</strong> <strong>Inglewood</strong> and Los Angeles<br />
County as a whole.<br />
Table 2-8<br />
Age Distribution: 1990 and 2000<br />
1990<br />
Percent<br />
Distribution 2000<br />
Percent<br />
Distribution<br />
<strong>City</strong> <strong>of</strong> <strong>Inglewood</strong><br />
Under 18 Years 32,998 30.1% 36,437 32.4%<br />
18 to 34 Years 36,513 33.3% 29,929 26.6%<br />
35 to 64 Years 32,597 29.7% 38,236 34.0%<br />
65 Years & Over 7,494 6.8% 7,978 7.1%<br />
Total 109,602 100.0% 112,580 100.0%<br />
Median Age 29.1 29.6<br />
Los Angeles County<br />
Under 18 2,326,110 26.2% 2,667,976 28.0%<br />
18 to 34 2,846,835 32.1% 2,562,379 26.9%<br />
35 to 64 2,829,632 31.9% 3,362,310 35.3%<br />
65 and over 860,587 9.7% 926,673 9.7%<br />
Total 8,863,164 100.0% 9,519,338 100.0%<br />
Median Age 30.6 32.0<br />
Sources: Stanley R. H<strong>of</strong>fman Associates, Inc.<br />
U.S. Bureau <strong>of</strong> the Census, 1990 and 2000.<br />
2-8 Age Distribution: 1990 and 2000<br />
Stanley R. H<strong>of</strong>fman Associates, Inc. 16 Economic Conditions and Trends<br />
April 20, 2006<br />
<strong>City</strong> <strong>of</strong> <strong>Inglewood</strong> <strong>General</strong> <strong>Plan</strong> <strong>Update</strong>
Figure 2-5<br />
Age Distributions in <strong>Inglewood</strong> and Los Angeles County<br />
<strong>City</strong> <strong>of</strong> <strong>Inglewood</strong><br />
40.0%<br />
35.0%<br />
30.0%<br />
32.4%<br />
30.1%<br />
33.3%<br />
26.6%<br />
29.7%<br />
34.0%<br />
25.0%<br />
20.0%<br />
1990<br />
2000<br />
15.0%<br />
10.0%<br />
5.0%<br />
6.8%<br />
7.1%<br />
0.0%<br />
Under 18 Years 18 to 34 Years 35 to 64 Years 65 Years &<br />
Over<br />
Los Angeles County<br />
40.0%<br />
35.0%<br />
30.0%<br />
25.0%<br />
28.0%<br />
26.2%<br />
32.1%<br />
26.9%<br />
31.9%<br />
35.3%<br />
20.0%<br />
1990<br />
2000<br />
15.0%<br />
10.0%<br />
9.7%<br />
9.7%<br />
5.0%<br />
0.0%<br />
Under 18 Years 18 to 34 Years 35 to 64 Years 65 Years &<br />
Over<br />
2-5 Age Distribution in <strong>Inglewood</strong> and Los Angeles County<br />
Stanley R. H<strong>of</strong>fman Associates, Inc. 17 Economic Conditions and Trends<br />
April 20, 2006<br />
<strong>City</strong> <strong>of</strong> <strong>Inglewood</strong> <strong>General</strong> <strong>Plan</strong> <strong>Update</strong>
2.8 Educational Attainment<br />
• As shown in Table 2-9 and Figure 2-6, the <strong>City</strong>’s population age 25 years and older has<br />
achieved markedly lower levels <strong>of</strong> higher education than those for the South Bay Cities<br />
and Los Angeles County.<br />
• In 2000, about 20.4 percent <strong>of</strong> the population age 25 years and older in <strong>Inglewood</strong> had<br />
received an Associate Arts or higher college degree, compared to 31.9 percent in the<br />
South Bay and 31.1 percent in the County.<br />
• About 26.3 percent <strong>of</strong> the adult population in <strong>Inglewood</strong> had not achieved a high school<br />
diploma, compared to 31.2 percent in the South Bay and 30.0 percent in the County.<br />
• This suggests that while a larger proportion <strong>of</strong> the <strong>Inglewood</strong> population aged 25 and<br />
older has graduated high school than in the South Bay Cities and Los Angeles County,<br />
that fewer members <strong>of</strong> the population have achieved degrees beyond that <strong>of</strong> a high school<br />
diploma or equivalency. This has strong implications for the future skills and training<br />
requirements <strong>of</strong> the labor force <strong>of</strong> <strong>Inglewood</strong>.<br />
Table 2-9<br />
Educational Attainment <strong>of</strong> Population 25 years and older: 2000<br />
South<br />
Bay<br />
Cities<br />
Los<br />
Angeles<br />
County<br />
Highest level <strong>of</strong> Education Attained <strong>Inglewood</strong> % <strong>of</strong> Total<br />
% <strong>of</strong> Total<br />
% <strong>of</strong> Total<br />
Less than 9th grade 12,073 18.7% 45,803 7.8% 955,932 16.2%<br />
Less than 12th grade, no diploma 11,346 17.6% 138,181 23.4% 814,592 13.8%<br />
High school graduate (includes equivalency) 12,979 20.1% 120,950 20.5% 1,108,314 18.8%<br />
Some college, no degree 15,021 23.3% 96,826 16.4% 1,174,477 20.0%<br />
Associate degree 4,562 7.1% 23,040 3.9% 367,244 6.2%<br />
Bachelor's degree 5,536 8.6% 147,777 25.0% 945,634 16.1%<br />
Post-graduate degree 3,072 4.8% 17,547 3.0% 516,755 8.8%<br />
Total 64,589 100.0% 590,124 100.0% 5,882,948 100.0%<br />
Associate degree or higher 13,170 20.4% 188,364 31.9% 1,829,633 31.1%<br />
Sources: Stanley R. H<strong>of</strong>fman Associates, Inc.<br />
U.S. Census Bureau, 2000, P37.<br />
2-9 Educational Attainment <strong>of</strong> Population 25 years and older: 2000<br />
Stanley R. H<strong>of</strong>fman Associates, Inc. 18 Economic Conditions and Trends<br />
April 20, 2006<br />
<strong>City</strong> <strong>of</strong> <strong>Inglewood</strong> <strong>General</strong> <strong>Plan</strong> <strong>Update</strong>
Figure 2-6<br />
AA Degree and Above in <strong>City</strong> <strong>of</strong> <strong>Inglewood</strong>, South Bay Cities, and L.A County: 2000<br />
90.0%<br />
80.0%<br />
70.0%<br />
79.6%<br />
68.1%<br />
68.9%<br />
60.0%<br />
50.0%<br />
40.0%<br />
30.0%<br />
20.0%<br />
10.0%<br />
20.4%<br />
31.9% 31.1%<br />
0.0%<br />
Below AA<br />
AA or Higher<br />
<strong>Inglewood</strong> South Bay Cities Los Angeles County<br />
Source: Stanley R. H<strong>of</strong>fman Associates, Inc.<br />
U.S. Bureau <strong>of</strong> the Census, 2000.<br />
2-6 AA Degree and Above in <strong>City</strong> <strong>of</strong> <strong>Inglewood</strong>, South Bay Cities and L.A. County: 2000<br />
Stanley R. H<strong>of</strong>fman Associates, Inc. 19 Economic Conditions and Trends<br />
April 20, 2006<br />
<strong>City</strong> <strong>of</strong> <strong>Inglewood</strong> <strong>General</strong> <strong>Plan</strong> <strong>Update</strong>
2.9 Labor Force<br />
Distribution by Type <strong>of</strong> Job<br />
• As shown in Table 2-10, sales and <strong>of</strong>fice occupations are the largest category <strong>of</strong> the labor<br />
force in the <strong>City</strong> <strong>of</strong> <strong>Inglewood</strong> at 30.7 percent. This is slightly higher than Los Angeles<br />
County, which has 27.6 percent <strong>of</strong> the labor force employed in sales and <strong>of</strong>fice<br />
occupations.<br />
• The Management and Pr<strong>of</strong>essional occupations comprised 24.6 percent <strong>of</strong> <strong>Inglewood</strong>’s<br />
labor force while 34.3 percent <strong>of</strong> Los Angeles County’s labor force fell into this category.<br />
• Within <strong>Inglewood</strong>, 20.5 percent <strong>of</strong> the labor force is employed in service occupations<br />
compared with 14.7 percent for Los Angeles County.<br />
• Production and Construction related occupations employ nearly identical proportions <strong>of</strong><br />
<strong>Inglewood</strong>’s and Los Angeles County’s labor forces.<br />
Table 2-10<br />
Labor Force: 1990 to 2000<br />
<strong>City</strong> <strong>of</strong> <strong>Inglewood</strong><br />
2000 % <strong>of</strong> Total<br />
Management and Pr<strong>of</strong>essional 10,425 24.6%<br />
Service 8,707 20.5%<br />
Sales and Office 13,027 30.7%<br />
Farming, fishing, and Forestry 84 0.2%<br />
Construction, Extraction, and Maintenance 3,216 7.6%<br />
Production, Transportation, and Material mov 6,916 16.3%<br />
Total 42,375 100.0%<br />
Los Angeles County<br />
Management and Pr<strong>of</strong>essional 1,355,973 34.3%<br />
Service 580,809 14.7%<br />
Sales and Office 1,090,059 27.6%<br />
Farming, fishing, and Forestry 6,650 0.2%<br />
Construction, Extraction, and Maintenance 306,450 7.8%<br />
Production, Transportation, and Material mov 613,474 15.5%<br />
Total 3,953,415 100.0%<br />
2-10 Labor Force: 1990 to 2000<br />
Sources: Stanley R. H<strong>of</strong>fman Associates, Inc.<br />
U.S. Bureau <strong>of</strong> the Census, 2000.<br />
Stanley R. H<strong>of</strong>fman Associates, Inc. 20 Economic Conditions and Trends<br />
April 20, 2006<br />
<strong>City</strong> <strong>of</strong> <strong>Inglewood</strong> <strong>General</strong> <strong>Plan</strong> <strong>Update</strong>
Comparative Unemployment Rates<br />
• Table 2-11 and Figure 2-7 shows the unemployment rates for the <strong>City</strong> <strong>of</strong> <strong>Inglewood</strong> in<br />
comparison to cities in the South Bay with populations over 25,000, and Los Angeles<br />
County. These cities include Carson, Gardena, Hawthorne, Lawndale, Manhattan Beach,<br />
Rancho Palos Verdes, Redondo Beach, and Torrance.<br />
• As shown, in 2004, the unemployment rate in <strong>Inglewood</strong> was the second highest among<br />
the South Bay Cities at 8.3 percent, compared to 6.6 percent for Los Angeles County.<br />
• Amongst the South Bay Cities with populations over 25,000, Hawthorne had the highest<br />
rate <strong>of</strong> unemployment at 8.7. In contrast, Manhattan Beach and Rancho Palos Verdes<br />
had the lowest rates <strong>of</strong> unemployment with 2.2 percent each.<br />
• Between 1994 and 2004, all <strong>of</strong> the South Bay Cities shown had substantial decreases in<br />
unemployment rates with the exception <strong>of</strong> Hawthorne, which remained constant.<br />
• Between 1994 and 2004, <strong>Inglewood</strong>’s unemployment rate dropped by 50.6 percent from<br />
12.5 percent in 1994 to 8.3 percent in 2004.<br />
Table 2-11<br />
Comparative Unemployment Rates: 1994 and 2004<br />
Jurisdictions 1994 2004<br />
1994-2004<br />
Percent<br />
Change<br />
South Bay Cities<br />
<strong>Inglewood</strong> 12.5% 8.3% -50.6%<br />
Carson 9.1% 6.6% -37.9%<br />
Gardena 7.5% 6.1% -23.0%<br />
Hawthorne 8.7% 8.7% 0.0%<br />
Lawndale 9.5% 6.5% -46.2%<br />
Manhattan Beach 3.0% 2.2% -36.4%<br />
Rancho Palos Verdes 3.0% 2.2% -36.4%<br />
Redondo Beach 4.3% 3.4% -26.5%<br />
Torrance 5.0% 3.2% -56.3%<br />
Los Angeles County 9.3% 6.6% -40.9%<br />
Source: Stanley R. H<strong>of</strong>fman Associates, Inc.<br />
Bureau <strong>of</strong> Labor Statistics.<br />
2-11 Comparative Unemployment Rates: 1994 and 2004<br />
Stanley R. H<strong>of</strong>fman Associates, Inc. 21 Economic Conditions and Trends<br />
April 20, 2006<br />
<strong>City</strong> <strong>of</strong> <strong>Inglewood</strong> <strong>General</strong> <strong>Plan</strong> <strong>Update</strong>
Figure 2-7<br />
Comparative Unemployment Rates: 2004<br />
10.0%<br />
9.0%<br />
8.0%<br />
7.0%<br />
6.0%<br />
5.0%<br />
8.7%<br />
8.3%<br />
6.6%<br />
6.5%<br />
6.1%<br />
6.6%<br />
4.0%<br />
3.0%<br />
2.0%<br />
3.4%<br />
3.2%<br />
2.2%<br />
2.2%<br />
1.0%<br />
0.0%<br />
Hawthorne<br />
<strong>Inglewood</strong><br />
Carson<br />
Lawndale<br />
Gardena<br />
Redondo Beach<br />
Torrance<br />
Manhattan Beach<br />
Rancho Palos Verdes<br />
Los Angeles County<br />
Source: Stanley R. H<strong>of</strong>fman Associates, Inc.<br />
Bureau <strong>of</strong> Labor Statistics.<br />
2-7 Comparative Unemployment Rates: 2004<br />
Stanley R. H<strong>of</strong>fman Associates, Inc. 22 Economic Conditions and Trends<br />
April 20, 2006<br />
<strong>City</strong> <strong>of</strong> <strong>Inglewood</strong> <strong>General</strong> <strong>Plan</strong> <strong>Update</strong>
2.10 Household Income<br />
• As shown in Table 2-11, in 2000 about 68.4 percent <strong>of</strong> <strong>Inglewood</strong> households earned<br />
below $50,000, compared with 47.7 percent in the South Bay. In Los Angeles County, an<br />
estimated 56.9 percent <strong>of</strong> households earned below $50,000.<br />
• As shown in Table 2-12 and Figure 2-8, the average household income in nominal dollars<br />
for the <strong>City</strong> was $44,656 in 2000, significantly lower than the South Bay and the County.<br />
• As shown, the average household income in constant 2006 dollars for the <strong>City</strong> was<br />
$54,732 in 2000, much lower than the average household incomes <strong>of</strong> the South Bay cities<br />
and the County.<br />
• As shown in constant 2006 dollars, the average household income in the <strong>City</strong> remained<br />
relatively flat, actually declining slightly, from 1990 to 2000, compared to the South Bay<br />
and Los Angeles County where average household incomes grew by about 4.3 and 3.2<br />
percent, respectively.<br />
Table 2-11<br />
Distribution <strong>of</strong> Income: 1990-2000<br />
(in nominal dollars)<br />
1990 % <strong>of</strong> Total 2000 % <strong>of</strong> Total<br />
1990-2000 %<br />
Change in<br />
Households<br />
<strong>Inglewood</strong><br />
Less than $10,000 5,282 14.5% 5,162 14.0% -2.3%<br />
$10,000-24,999 9,578 26.3% 8,048 21.8% -16.0%<br />
$25,000-$49,999 13,108 36.0% 11,992 32.6% -8.5%<br />
$50,000-$99,999 7,539 20.7% 9,127 24.8% 21.1%<br />
$100,000+ 892 2.5% 2,505 6.8% 180.8%<br />
Total 36,399 100.0% 36,834 100.0% 1.2%<br />
South Bay Cities<br />
Less than $10,000 21,524 8.4% 19,771 7.4% -8.1%<br />
$10,000-24,999 44,745 17.5% 39,309 14.8% -12.1%<br />
$25,000-$49,999 79,862 31.2% 67,618 25.4% -15.3%<br />
$50,000-$99,999 80,212 31.4% 83,204 31.3% 3.7%<br />
$100,000+ 29,218 11.4% 55,882 21.0% 91.3%<br />
Total 255,561 100.0% 265,784 100.0% 4.0%<br />
Los Angeles County<br />
Less than $10,000 383,060 12.8% 330,000 10.5% -13.9%<br />
$10,000-24,999 680,398 22.7% 602,111 19.2% -11.5%<br />
$25,000-$49,999 953,229 31.8% 853,372 27.2% -10.5%<br />
$50,000-$99,999 742,333 24.8% 877,071 28.0% 18.2%<br />
$100,000+ 235,323 7.9% 473,725 15.1% 101.3%<br />
Total 2,994,343 100.0% 3,136,279 100.0% 4.7%<br />
Source: Stanley R. H<strong>of</strong>fman Associates, Inc.<br />
U.S. Census Data, 1990 and 2000.<br />
2-11 Distribution <strong>of</strong> Income: 1990-2000<br />
Stanley R. H<strong>of</strong>fman Associates, Inc. 23 Economic Conditions and Trends<br />
April 20, 2006<br />
<strong>City</strong> <strong>of</strong> <strong>Inglewood</strong> <strong>General</strong> <strong>Plan</strong> <strong>Update</strong>
Table 2-12<br />
Average Household Income<br />
(in nominal dollars)<br />
Description 1990 2000 % Change<br />
<strong>Inglewood</strong> $35,433 $44,656 26.0%<br />
South Bay Cities $55,614 $73,477 32.1%<br />
Los Angeles County $47,252 $61,811 30.8%<br />
(in constant 2006 dollars)<br />
Description 1990 2000 % Change<br />
<strong>Inglewood</strong> $55,033 $54,732 -0.5%<br />
South Bay Cities $86,377 $90,056 4.3%<br />
Los Angeles County $73,390 $75,758 3.2%<br />
2-12 Average Household Income<br />
$100,000<br />
Source: Stanley R. H<strong>of</strong>fman Associates, Inc.<br />
U.S. Census Bureau, 1990 and 2000.<br />
Figure 2-8<br />
Average Annual Household Income: 1990-2000<br />
(In constant 2006 dollars)<br />
$90,000<br />
$86,377<br />
$90,056<br />
$80,000<br />
$70,000<br />
$73,390<br />
$75,758<br />
$60,000<br />
$50,000<br />
$55,033<br />
$54,732<br />
$40,000<br />
$30,000<br />
<strong>Inglewood</strong> South Bay Cities Los Angeles County<br />
Source: Stanley R. H<strong>of</strong>fman Associates, Inc.<br />
U.S. Bureau <strong>of</strong> the Census, 1990 and 2000<br />
2-8 Average Annual Household Income: 1990-2000<br />
1990 2000<br />
Stanley R. H<strong>of</strong>fman Associates, Inc. 24 Economic Conditions and Trends<br />
April 20, 2006<br />
<strong>City</strong> <strong>of</strong> <strong>Inglewood</strong> <strong>General</strong> <strong>Plan</strong> <strong>Update</strong>
2.11 Projected Population, Household and Employment Growth<br />
<strong>City</strong> <strong>of</strong> <strong>Inglewood</strong><br />
• As shown in Table 2-13 and Figure 2-9, projections provide by the Southern California<br />
Association <strong>of</strong> Governments; (SCAG) Regional Transportation <strong>Plan</strong> (RTP) 2004 suggest<br />
that the <strong>City</strong> <strong>of</strong> <strong>Inglewood</strong> will experience modest growth in population, households, and<br />
employment over the period 2000-2030.<br />
• As shown, population is projected to grow from 112,580 in 2000 (U.S. Census estimates)<br />
to 133,072 in 2030, representing an annual average growth rate <strong>of</strong> 0.56 percent.<br />
• Households are expected to grow slightly faster than population at an annual rate <strong>of</strong><br />
about 0.66 percent.<br />
• Employment in <strong>Inglewood</strong> is projected to increase by only nearly 4,100 jobs, according<br />
preliminary corrections being made to SCAG RTP 2004.<br />
• Employment is projected to increase from about 32,900 jobs in 2000 to an estimated<br />
37,000 by the year 2030. At an average annual rate <strong>of</strong> 0.39 percent.<br />
• As a result <strong>of</strong> the faster population growth relative to employment growth, the jobshousing<br />
ratio in <strong>Inglewood</strong> <strong>of</strong> 0.89 in 2000 is expected to decrease slightly to 0.83 in<br />
2030.<br />
South Bay Cities<br />
• As shown in Table 2-13, projections for the South Bay Cities are shown to provide a<br />
demographic picture <strong>of</strong> an area more relevant to <strong>Inglewood</strong> than Los Angeles County.<br />
• The South Bay Cities’ population and households are projected to increase at relatively<br />
similar average annual rates to the <strong>City</strong> <strong>of</strong> <strong>Inglewood</strong>, 0.65 percent and 0.54 percent,<br />
respectively.<br />
• Employment is projected to increase at an annual rate <strong>of</strong> about 0.78 percent and the<br />
number <strong>of</strong> jobs per household is expected to increase from 1.48 in 2000 to 1.59 in 2030.<br />
• It is important to note that the jobs per household ratio for the South Bay Cities is, in<br />
2000, appreciably higher than that <strong>of</strong> <strong>Inglewood</strong>. In addition, the ratio is projected to<br />
continue widening from 2000 to 2030, while <strong>Inglewood</strong> is expected to increase slightly<br />
to 1.38 in 2030.<br />
Los Angeles County<br />
• The County is projected to grow more rapidly than both <strong>Inglewood</strong> and the South Bay<br />
Cities as a whole over this time period, increasing in population at an average annual rate<br />
<strong>of</strong> 0.80 percent, and number <strong>of</strong> households increasing at an annual rate <strong>of</strong> 0.91 percent.<br />
• The County’s employment is project to increase at an average rate <strong>of</strong> 0.80 percent<br />
annually, about the same as population growth. However, since the number <strong>of</strong><br />
households is growing more rapidly than employment, the jobs to household ratio is<br />
excepted to decline marginally over this projection period.<br />
Stanley R. H<strong>of</strong>fman Associates, Inc. 25 Economic Conditions and Trends<br />
April 20, 2006<br />
<strong>City</strong> <strong>of</strong> <strong>Inglewood</strong> <strong>General</strong> <strong>Plan</strong> <strong>Update</strong>
Table 2-13<br />
Population, Households and Employment Projections: 2000 to 2030 1<br />
2000-2030<br />
Average<br />
Numerical Annual Percent<br />
Jurisdiction 2000 2030 Change Change Change<br />
<strong>City</strong> <strong>of</strong> <strong>Inglewood</strong><br />
Population 112,580 133,072 20,492 0.56% 18.2%<br />
Households 36,834 44,812 7,978 0.66% 21.7%<br />
Employment 2 32,900 37,000 4,100 0.39% 12.5%<br />
Jobs/Household Ratio 0.89 0.83 -0.07 -0.26% -7.6%<br />
South Bay Cities 2<br />
Population 729,615 886,020 156,405 0.65% 21.4%<br />
Households 265,784 311,966 46,182 0.54% 17.4%<br />
Employment 394,200 497,491 103,291 0.78% 26.2%<br />
Jobs/Household Ratio 1.48 1.59 0.11 0.24% 7.5%<br />
Los Angeles County<br />
Population 9,519,330 12,096,899 2,577,569 0.80% 27.1%<br />
Households 3,108,889 4,083,459 974,570 0.91% 31.3%<br />
Employment 4,431,307 5,633,695 1,202,388 0.80% 27.1%<br />
Jobs/Household Ratio 1.43 1.38 -0.05 -0.11% -3.2%<br />
Notes:<br />
1. All estimates for employment estimates and projections are based on SCAG RTP 2004 projections.<br />
Population and household estimates for the year 2000 are from the U.S. Census 2000.<br />
2. Preliminary estimates <strong>of</strong> revision to the SCAG RTP 2004 as provided by SCAG staff in April, 2006.<br />
3. The South Bay Cities includes the Cities <strong>of</strong> Carson, El Segundo, Gardena, Hawthorne,<br />
Hermosa Beach, <strong>Inglewood</strong>, Lawndale, Lomita, Manhattan Beach, Palos Verdes Estates, Rancho<br />
Palos Verdes, Redondo Beach, Rolling Hills, Rolling Hills Estates, and Torrance.<br />
Source: Stanley R. H<strong>of</strong>fman Associates, Inc.<br />
Southern California Association <strong>of</strong> Governments (SCAG), RTP 2004.<br />
U.S. Bureau <strong>of</strong> the Census, Census 2000.<br />
2-13 Population, Households and Employment: Projections 2000-2030<br />
Stanley R. H<strong>of</strong>fman Associates, Inc. 26 Economic Conditions and Trends<br />
April 20, 2006<br />
<strong>City</strong> <strong>of</strong> <strong>Inglewood</strong> <strong>General</strong> <strong>Plan</strong> <strong>Update</strong>
Figure 2-9<br />
Projected Population and Employment Growth: Percent Change 2000 to 2030 1<br />
40.0%<br />
Percent Change: 2000 to 2030<br />
35.0%<br />
30.0%<br />
25.0%<br />
20.0%<br />
15.0%<br />
10.0%<br />
5.0%<br />
0.0%<br />
26.2%<br />
27.1% 27.1%<br />
21.4%<br />
18.2%<br />
12.5%<br />
<strong>Inglewood</strong> South Bay Los Angeles County<br />
Population<br />
Employment<br />
Source: Stanley R. H<strong>of</strong>fman Associates, Inc.<br />
Southern California Association <strong>of</strong> Governments (SCAG), RTP 2004.<br />
U.S. Bureau <strong>of</strong> the Census, 1990 and 2000<br />
2-9 Projected Population and Employment Growth: Percent Change 2000 to 2030<br />
Stanley R. H<strong>of</strong>fman Associates, Inc. 27 Economic Conditions and Trends<br />
April 20, 2006<br />
<strong>City</strong> <strong>of</strong> <strong>Inglewood</strong> <strong>General</strong> <strong>Plan</strong> <strong>Update</strong>
Chapter 3 – BUSINESS OVERVIEW<br />
Employment data for the <strong>City</strong> <strong>of</strong> <strong>Inglewood</strong> and Los Angeles County from 1994 to 2004 was<br />
provided by the California Economic Development Department (EDD). This information<br />
categorizes employment and payroll data by industry sector. Employment data is grouped by the<br />
North American Industrial Classification System (NAICS) from 2001 to 2004, and the Standard<br />
Industrial Classification (SIC) for 1994. The North American Industry Classification System was<br />
developed by representatives from the United States, Canada, and Mexico, and replaces each<br />
country's separate classification system with one uniform system for classifying industries. In the<br />
United States, NAICS replaces the SIC, a system that federal, state, and local governments, the<br />
business community, and the general public have used since the 1930s.<br />
Almost 70.0 percent <strong>of</strong> the jobs in <strong>Inglewood</strong> were in three sectors; Retail & Entertainment;<br />
Health Care and Other Services; and Government and Local Services. In contrast, Manufacturing<br />
and Transportation only represent about 9.0 percent <strong>of</strong> the jobs.<br />
3.1 Overall 1994 to 2004 Employment Trends<br />
• As shown in Table 3-1, the <strong>City</strong>’s total employment (including self-employment) grew<br />
marginally from 30,886 in 1994 to 31,127 in 2004, at an annual average growth rate <strong>of</strong><br />
0.1 percent.<br />
• In 2004, services formed the largest employment sector in the <strong>City</strong> with nearly 32 percent<br />
<strong>of</strong> the total jobs, as shown in Figure 3-2.<br />
• Employment in services grew by a total <strong>of</strong> 1.0 percent from 9,814 in 1994 to 9,914 in<br />
2004, at annual average rate <strong>of</strong> 0.1 percent.<br />
• Manufacturing and Retail jobs declined by about 36 percent and 31 percent, respectively,<br />
over the1994 to 2004 time period.<br />
• Wholesale Trade, Finance, Insurance and Real Estate (FIRE), and Construction declined<br />
in the 8 percent to 13 percent range from 1994 to 2004, as shown in Table 3-1.<br />
3.2 NAICS Sectoral Employment and Salary Trends: 2001 to 2004<br />
The following section presents sectoral trends by NAICS categories from 2001 to 2004 based on<br />
data provided by the California Employment Development Department (EDD). The data<br />
provided included information on employment by sector, number <strong>of</strong> establishments per sector<br />
and payroll and wage trends by sector.<br />
Stanley R. H<strong>of</strong>fman Associates, Inc. 28 Economic Conditions and Trends<br />
April 20, 2006<br />
<strong>City</strong> <strong>of</strong> <strong>Inglewood</strong> <strong>General</strong> <strong>Plan</strong> <strong>Update</strong>
Table 3-1<br />
<strong>City</strong> <strong>of</strong> <strong>Inglewood</strong><br />
Employment by Sector: 1994 to 2004 1<br />
Sectors 2 1994 2004<br />
Percent<br />
Change<br />
Annual<br />
Average<br />
Growth Rate<br />
Construction 627 578 -7.8% -0.8%<br />
Farming, Fishing, Forestry, Mining 82 30 -63.4% -9.6%<br />
FIRE 1,326 1,201 -9.4% -1.0%<br />
Government 5,429 4,977 -8.3% -0.9%<br />
Manufacturing 2,867 1,829 -36.2% -4.4%<br />
Retail 4,300 2,957 -31.2% -3.7%<br />
Services 9,814 9,914 1.0% 0.1%<br />
Wholesale 1,619 1,410 -12.9% -1.4%<br />
Other 3 4,823 8,321 72.5% 5.6%<br />
TOTAL 30,886 31,217 1.1% 0.1%<br />
1. Based on SIC for 1994 and NAICS for 2004, as shown in Appendix Table 1.<br />
2. Includes estimates for self-employment by sectoral rates as shown in Appendix Table 2.<br />
3. Other includes Transportation, Utilities, Warehousing, Non-classified and suppressed data.<br />
Source: Stanley R.H<strong>of</strong>fman Associates, Inc.<br />
California Employment Development Department<br />
3-1 Total Employment: 1994-2004<br />
Figure 3-1<br />
<strong>City</strong> <strong>of</strong> <strong>Inglewood</strong><br />
Comparative Employment Distribution by Sector: 1994 to 2004<br />
35.0%<br />
31.8% 31.8%<br />
30.0%<br />
25.0%<br />
1994 2004<br />
20.0%<br />
17.6%<br />
15.0%<br />
15.9%<br />
13.9%<br />
10.0%<br />
9.5%<br />
9.3%<br />
5.0%<br />
0.0%<br />
5.9%<br />
Services Government Retail Manufacturing Wholesale FIRE Construction Farming,<br />
Fishing,<br />
Forestry,<br />
Mining<br />
5.2%<br />
4.5%<br />
4.3%<br />
3.8%<br />
2.0%<br />
1.9%<br />
0.3%<br />
0.1%<br />
3-1 Employment by Major Employment Categories: 2004<br />
Stanley R. H<strong>of</strong>fman Associates, Inc. 29 Economic Conditions and Trends<br />
April 20, 2006<br />
<strong>City</strong> <strong>of</strong> <strong>Inglewood</strong> <strong>General</strong> <strong>Plan</strong> <strong>Update</strong>
Employment by NAICS 2001 -2004<br />
• Employment data from EDD was adjusted to include estimated self-employment by<br />
NAICS sectors using factors shown in Appendix Table A-2.<br />
• The adjusted employment distribution including self-employment from 2001 to 2004 is<br />
shown in Table 3-2.<br />
• As shown in Table 3-2, total employment including declined by 6.2 percent from 33,298<br />
in 2001 to 31,217 in 2004, at an annual average rate <strong>of</strong> 2.1 percent.<br />
• Employment declined in all major non-Public Sector categories except Services, Retail,<br />
and Construction.<br />
• Service sector employment grew by 5.4 percent from 9,402 in 2001 to 9,914 in 2004,<br />
whereas employment in the Retail sector grew by 2.9 percent from 2,873 in 2001 to 2,957<br />
in 2004.<br />
Table 3-2<br />
<strong>City</strong> <strong>of</strong> <strong>Inglewood</strong><br />
Employment by Sector: 2001 to 2004 1<br />
Industrial Categories 2001 2002 2003 2004<br />
2001 to 2004<br />
Percent<br />
Change<br />
2001 to 2004<br />
Annual<br />
Average<br />
Growth Rate<br />
Pr<strong>of</strong>essional, Scientific and Technical 759 674 418 411 -45.8% -18.5%<br />
Finance and Real Estate 1,772 1,475 1,406 1,201 -32.2% -12.2%<br />
Information 295 282 237 259 -12.2% -4.3%<br />
Arts, Entertainment and Recreation 3,079 2,693 2,590 2,712 -11.9% -4.1%<br />
Services 9,402 10,347 9,734 9,914 5.4% 1.8%<br />
Manufacturing 2,685 2,487 2,244 1,829 -31.9% -12.0%<br />
Retail 2,873 2,762 2,884 2,957 2.9% 1.0%<br />
Wholesale 1,449 1,408 1,437 1,410 -2.7% -0.9%<br />
Government 4,651 5,181 5,079 4,977 7.0% 2.3%<br />
Construction 454 445 523 578 27.4% 8.4%<br />
Transportation Warehousing 4,099 3,445 3,227 3,344 -18.4% -6.6%<br />
Other 1,780 2,045 1,788 1,626 -8.6% -3.0%<br />
Total 33,298 33,246 31,565 31,217 -6.2% -2.1%<br />
SERVICES<br />
Accomodation and Food Services 1,963 2,007 2,134 2,209 12.5% 4.0%<br />
Admin Support, Waste Mgmt 1,203 924 737 998 -17.0% -6.0%<br />
Educational Services 345 374 374 373 8.0% 2.6%<br />
Health Care and Social Services 4,385 5,588 4,974 4,930 12.4% 4.0%<br />
Other Services 1,506 1,454 1,514 1,404 -6.7% -2.3%<br />
Sub-total 9,402 10,347 9,734 9,914 5.4% 1.8%<br />
1. Includes estimates for self-employment by sector not originally provided in the California Employment Development Department.<br />
Source: Stanley R.H<strong>of</strong>fman Associates, Inc.<br />
California Employment Development Department<br />
3-2 Employment by Sector: 2001-2004<br />
Stanley R. H<strong>of</strong>fman Associates, Inc. 30 Economic Conditions and Trends<br />
April 20, 2006<br />
<strong>City</strong> <strong>of</strong> <strong>Inglewood</strong> <strong>General</strong> <strong>Plan</strong> <strong>Update</strong>
Figure 3-2<br />
<strong>City</strong> <strong>of</strong> <strong>Inglewood</strong><br />
Service Sector Categories as Percent <strong>of</strong> Service Sector Employment: 2004<br />
60.0%<br />
50.0%<br />
49.7%<br />
40.0%<br />
30.0%<br />
22.3%<br />
20.0%<br />
14.2%<br />
10.0%<br />
10.1%<br />
3.8%<br />
0.0%<br />
Health Care and Social<br />
Services<br />
Accomodation and<br />
Food Services<br />
Other Services<br />
Admin Support, Waste<br />
Mgmt<br />
Educational Services<br />
Source: Stanley R.H<strong>of</strong>fman Associates, Inc.<br />
California Employment Development Department (EDD)<br />
3-2 Service Sector Categories as Percent <strong>of</strong> Total Service Sector Employment: 2004<br />
• Manufacturing declined by 31.9 percent from an estimated 2,685 jobs in 2001 to 1829<br />
jobs in 2004.<br />
• Finance, Insurance and Real Estate (FIRE) declined by 32.2 percent and Pr<strong>of</strong>essional and<br />
Technical Services declined by 45.8 percent.<br />
• Of the service sector categories, as shown in Table 3-2, Accommodation and Food<br />
Services, and Health Care and Social Services each grew by 12.5 percent each from 2001<br />
to 2004, at annual average growth rates <strong>of</strong> 4.0 percent.<br />
• As shown in Figure 3-2, in 2004 Health Care and Social Services comprised nearly 50<br />
percent <strong>of</strong> Services-related employment followed by Accommodation and Food Services<br />
at 22.3 percent.<br />
Wage and Salary Trends 2001 -2004<br />
• Table 3-3 shows payroll data, in Constant 2005 dollars, for the <strong>City</strong> <strong>of</strong> <strong>Inglewood</strong> from<br />
the EDD for the 2001 to 2004.<br />
Stanley R. H<strong>of</strong>fman Associates, Inc. 31 Economic Conditions and Trends<br />
April 20, 2006<br />
<strong>City</strong> <strong>of</strong> <strong>Inglewood</strong> <strong>General</strong> <strong>Plan</strong> <strong>Update</strong>
Table 3-3<br />
<strong>City</strong> <strong>of</strong> <strong>Inglewood</strong><br />
Number <strong>of</strong> Establishments, Employment and Wages: 2001-2004<br />
2001 2004<br />
Establishments Employment<br />
Annual Average Salary (Constant 2005)<br />
Percent<br />
Change<br />
Average<br />
Growth Rate 2001 2004<br />
Percent<br />
Change 2001 2004<br />
Percent<br />
Change<br />
Pr<strong>of</strong>essional, Scientific and Technical 65 67 3.08% 1.02% 602 326 -45.85% $38,180 $32,634 -14.5%<br />
Finance and Real Estate 122 120 -1.64% -0.55% 1,571 1,045 -33.48% $71,335 $41,209 -42.2%<br />
Information 15 19 26.67% 8.20% 278 244 -12.23% $77,008 $55,288 -28.2%<br />
Arts, Entertainment and Recreation 27 31 14.81% 4.71% 2,433 2,143 -11.92% $66,194 $81,424 23.0%<br />
Services 720 760 5.56% 1.82% 8,694 9,188 5.68% $29,159 $31,954 9.6%<br />
Manufacturing 90 76 -15.56% -5.48% 2,616 1,782 -31.88% $41,924 $44,153 5.3%<br />
Retail 267 265 -0.75% -0.25% 2,873 2,957 2.92% $27,935 $24,062 -13.9%<br />
Wholesale 87 97 11.49% 3.69% 1,363 1,326 -2.71% $42,295 $36,102 -14.6%<br />
Government 11 13 18.18% 5.73% 4,618 4,916 6.44% $46,999 $47,253 0.5%<br />
Construction 55 62 12.73% 4.07% 369 470 27.37% $36,049 $32,115 -10.9%<br />
Transportation Warehousing 304 328 7.89% 2.57% 3,913 3,192 -18.43% $39,277 $42,526 8.3%<br />
Other 12 15 32.61% 9.86% 1,138 975 -14.28% $85,990 $49,761 -42.1%<br />
Total 1,775 1,853 4.44% 1.46% 30,468 28,564 -6.25% $42,683 $40,773 -4.5%<br />
SERVICES<br />
Accomodation and Food Services 143 160 11.89% 3.82% 1,868 2,102 12.53% $15,281 $14,549 -4.8%<br />
Admin Support, Waste Mgmt 73 75 2.74% 0.91% 1,010 838 -17.03% $24,565 $24,873 1.3%<br />
Educational Services 17 24 41.18% 12.18% 339 366 7.96% $37,176 $38,873 4.6%<br />
Health Care and Social Services 299 316 5.69% 1.86% 4,039 4,541 12.43% $44,103 $42,627 -3.3%<br />
Other Services 188 185 -1.60% -0.53% 1,438 1,341 -6.75% $23,803 $25,630 7.7%<br />
Sub-total 720 760 5.56% 1.82% 8,694 9,188 9.15% $32,013 $31,954 -0.2%<br />
Source: Stanley R.H<strong>of</strong>fman Associates, Inc.<br />
California Employment Development Department (EDD).<br />
3-3 Number <strong>of</strong> Establishments, Employment and Wages: 2001-2004<br />
Stanley R. H<strong>of</strong>fman Associates, Inc. 32 Economic Conditions and Trends<br />
April 20, 2006<br />
<strong>City</strong> <strong>of</strong> <strong>Inglewood</strong> <strong>General</strong> <strong>Plan</strong> <strong>Update</strong>
Figure 3-3<br />
<strong>City</strong> <strong>of</strong> <strong>Inglewood</strong><br />
Average Annual Salary in 8 Largest Employment Sectors: 2004<br />
(Constant 2005 Dollars)<br />
$90,000<br />
$80,000<br />
$81,424<br />
$70,000<br />
$60,000<br />
$50,000<br />
$40,000<br />
$47,253<br />
$44,153<br />
$42,526<br />
$41,209 $40,773<br />
$36,102<br />
$31,954<br />
$30,000<br />
$24,062<br />
$20,000<br />
$10,000<br />
$0<br />
Arts,<br />
Ente r tainm e nt<br />
and Recreation<br />
Government Manufacturing Transportation<br />
Warehousing<br />
Finance and<br />
Real Estate<br />
Average <strong>City</strong><br />
Wage<br />
Wholesale Services Retail<br />
Source: Stanley R. H<strong>of</strong>fman Associates, Inc.<br />
California Employment Development Department.<br />
3-3 Average Annual Salary in 8 Largest Employment Sectors: 2004<br />
• According to the EDD, the <strong>City</strong> <strong>of</strong> <strong>Inglewood</strong> had 1,853 establishments with 28,564<br />
employees in 2004.<br />
• As shown in Table 3-3, the annual average salary in the <strong>City</strong> <strong>of</strong> <strong>Inglewood</strong> declined by<br />
4.5 percent in constant 2005 dollars from $42,683 to $40,773 from 2001 to 2004.<br />
• As shown in Figure 3-3, in 2004, Arts, Entertainment and Recreation jobs had the highest<br />
average salary <strong>of</strong> $81,424, followed by Government and Manufacturing jobs at $47,253<br />
and $44,159, respectively.<br />
• As shown in Figure 3-3, average salaries in the Wholesale, Services and Retail sectors are<br />
below the <strong>City</strong> average salaries <strong>of</strong> $40,733. These sectors comprised nearly 47 percent <strong>of</strong><br />
the total employment in the <strong>City</strong> in 2004.<br />
Stanley R. H<strong>of</strong>fman Associates, Inc. 33 Economic Conditions and Trends<br />
April 20, 2006<br />
<strong>City</strong> <strong>of</strong> <strong>Inglewood</strong> <strong>General</strong> <strong>Plan</strong> <strong>Update</strong>
Figure 3-4<br />
<strong>City</strong> <strong>of</strong> <strong>Inglewood</strong><br />
Average Annual Salary in Service Sector Industries: 2004<br />
(Constant 2005 Dollars)<br />
$45,000<br />
$40,000<br />
$42,627<br />
$38,873<br />
$35,000<br />
$30,000<br />
$25,000<br />
$25,630<br />
$24,873<br />
$20,000<br />
$15,000<br />
$14,549<br />
$10,000<br />
$5,000<br />
$0<br />
Health Care and<br />
Social Services<br />
Educational Services Other Services Admin Support,<br />
Waste Mgmt<br />
Accomodation and<br />
Food Services<br />
Source: Stanley R. H<strong>of</strong>fman Associates, Inc.<br />
California Employment Development Department.<br />
3-4 Average Annual Salary for Service Sector Industries: 2004<br />
• As shown in Figure 3-4, amongst the Services-related jobs, average salary in Health Care<br />
and Social Services was the highest at $42,627-- slightly higher than the <strong>City</strong> average.<br />
Average salary in the Accommodation and Food Services sector was the lowest at<br />
$14,549.<br />
3.3 Distribution <strong>of</strong> Establishments by Sector and Size: 2001 to 2004<br />
• As shown in Table 3-4, the number <strong>of</strong> establishments in the <strong>City</strong> grew marginally by 4.4<br />
percent between 2001 and 2004 from 1,775 in 2001 to 1,853 in 2004.<br />
• Services-related establishments grew by 5.56 percent from 720 in 2001 to 760 in 2004.<br />
• Manufacturing establishments declined by 15.5 percent from 90 in 2001 to 76 in 2004.<br />
Stanley R. H<strong>of</strong>fman Associates, Inc. 34 Economic Conditions and Trends<br />
April 20, 2006<br />
<strong>City</strong> <strong>of</strong> <strong>Inglewood</strong> <strong>General</strong> <strong>Plan</strong> <strong>Update</strong>
Table 3-4<br />
<strong>City</strong> <strong>of</strong> <strong>Inglewood</strong><br />
Distribution <strong>of</strong> Establishments by Sectors: 2001 to 2004 1<br />
Average Establishment Size<br />
(Employees)<br />
Establishments<br />
2001 2004<br />
Percent<br />
Change 2001 2004<br />
Percent<br />
Change<br />
Pr<strong>of</strong>essional, Scientific and Technical 65 67 3.08% 9 5 -47.5%<br />
Finance and Real Estate 122 120 -1.64% 13 9 -32.4%<br />
Information 15 19 26.67% 19 13 -30.7%<br />
Arts, Entertainment and Recreation 27 31 14.81% 90 69 -23.3%<br />
Services 720 760 5.56% 12 12 0.1%<br />
Manufacturing 90 76 -15.56% 29 23 -19.3%<br />
Retail 267 265 -0.75% 11 11 3.7%<br />
Wholesale 87 97 11.49% 16 14 -12.7%<br />
Government 11 13 18.18% 420 378 -9.9%<br />
Construction 55 62 12.73% 7 8 13.0%<br />
Transportation Warehousing 304 328 7.89% 13 10 -24.4%<br />
Other 12 15 32.61% 99 64 -35.4%<br />
Total 1,775 1,853 4.44% 17 15 -10.2%<br />
SERVICES<br />
Accomodation and Food Services 143 160 11.89% 13 13 0.6%<br />
Admin Support, Waste Mgmt 73 75 2.74% 14 11 -19.2%<br />
Educational Services 17 24 41.18% 20 15 -23.5%<br />
Health Care and Social Services 299 316 5.69% 14 14 6.4%<br />
Other Services 188 185 -1.60% 8 7 -5.2%<br />
Sub-total 720 760 5.56% 12 12 0.1%<br />
Source: Stanley R.H<strong>of</strong>fman Associates, Inc.<br />
California Employment Development Department (EDD).<br />
3-4 Distribution <strong>of</strong> Establishments by Sectors: 2001 to 2004<br />
Figure 3 -4<br />
<strong>City</strong> <strong>of</strong> <strong>Inglewood</strong><br />
Distribution <strong>of</strong> Establishments by Sectors: 2004<br />
20.0%<br />
18.0%<br />
17.7%<br />
17.1%<br />
16.0%<br />
14.0%<br />
14.3%<br />
12.0%<br />
10.0%<br />
8.6%<br />
8.0%<br />
6.5%<br />
6.0%<br />
4.0%<br />
5.2%<br />
4.1%<br />
2.0%<br />
0.0%<br />
Transportation<br />
Warehousing<br />
Health Care and<br />
Social Services<br />
Retail<br />
Accom odation<br />
and Food<br />
Services<br />
Finance and Real<br />
Es tate<br />
Wholesale<br />
Manufacturing<br />
Source: Stanley R. H<strong>of</strong>fman Associates, Inc.<br />
California Employment Development Department.<br />
3-5 Distribution <strong>of</strong> Establishments by Sector: 2004<br />
Stanley R. H<strong>of</strong>fman Associates, Inc. 35 Economic Conditions and Trends<br />
April 20, 2006<br />
<strong>City</strong> <strong>of</strong> <strong>Inglewood</strong> <strong>General</strong> <strong>Plan</strong> <strong>Update</strong>
• As shown in Figure 3-4, in 2004, Transportation and Warehousing comprised about 18<br />
percent <strong>of</strong> the <strong>City</strong>’s total establishments, followed closely by Health Care and Social<br />
Services establishments at about 17 percent.<br />
• The average number <strong>of</strong> employees per establishment in the <strong>City</strong> across all sectors<br />
declined from 17 in 2001 to 15 in 2004, as shown in Table 3-4.<br />
• Employee per establishment in the Pr<strong>of</strong>essional, Scientific and Technical sector declined<br />
by about 48 percent from 9 in 2001 to 5 in 2004.<br />
• Per establishment employment for the Services and Retail sectors remained constant<br />
between 2001 and 2004 at 12 and 11, respectively.<br />
3.4 Sectoral Clustering in the <strong>City</strong> <strong>of</strong> <strong>Inglewood</strong><br />
• Table 3-5 shows the distribution <strong>of</strong> firms by ZIP codes based on data from the U.S.<br />
Census 2003 County Business Patterns. The number <strong>of</strong> establishments in the County<br />
Business Patterns data is about 8 percent higher than the EDD estimates for 2004.<br />
• As shown Table 3-5, the <strong>City</strong> <strong>of</strong> <strong>Inglewood</strong>, as defined by the ZIP codes 90301, 90302,<br />
90303, 90304 and 90305, had a total <strong>of</strong> 1,996 firms in 2003. Establishments listed under<br />
ZIP code 90304 also include those in the <strong>City</strong> <strong>of</strong> Lennox.<br />
• As shown in Figure 3-5, nearly 50 percent <strong>of</strong> the firms in the <strong>City</strong> are located in ZIP code<br />
90301, followed by 16.8 percent in 90302.<br />
• Using the distribution <strong>of</strong> firms by sector within each ZIP code, and comparing this<br />
distribution to the <strong>City</strong>-wide distribution provides a rough estimate <strong>of</strong> concentration <strong>of</strong><br />
sectors by geography.<br />
• As shown in Table 3-6, indexing the distribution <strong>of</strong> firms by sector by ZIP codes to the<br />
<strong>City</strong>-wide sectoral distribution results in locational indices or relative concentration <strong>of</strong><br />
firms by sector by ZIP code.<br />
• Location <strong>of</strong> Health Care and Social Services firms is 1.8 and 1.3 times higher in ZIP<br />
codes 90305 and 90301, respectively, compared to the average sectoral distribution in the<br />
<strong>City</strong>.<br />
• Manufacturing related firms are around 2.3 times more concentrated in ZIP code 90302<br />
compared to the <strong>City</strong> average.<br />
• Transportation and Warehousing related firms are relatively more concentrated in ZIP<br />
codes 90301 and 90304.<br />
Stanley R. H<strong>of</strong>fman Associates, Inc. 36 Economic Conditions and Trends<br />
April 20, 2006<br />
<strong>City</strong> <strong>of</strong> <strong>Inglewood</strong> <strong>General</strong> <strong>Plan</strong> <strong>Update</strong>
Table 3-5<br />
<strong>City</strong> <strong>of</strong> <strong>Inglewood</strong><br />
Distribution <strong>of</strong> Firms by ZIP Codes: 2003<br />
NAICS Categories 90301 90302 90303 90304 90305 90311 Total<br />
Forestry, fishing, hunting, and agriculture 1 1 2<br />
Utilities 1 1<br />
Construction 19 26 5 9 4 63<br />
Manufacturing 37 33 5 8 2 85<br />
Wholesale trade 58 31 13 14 4 120<br />
Retail trade 112 38 63 51 21 285<br />
Transportation & warehousing 190 49 29 75 1 344<br />
Information 9 5 4 3 21<br />
Finance & insurance 32 9 13 2 3 1 60<br />
Real estate & rental & leasing 37 15 10 12 4 78<br />
Pr<strong>of</strong>essional, scientific & technical services 43 15 10 10 3 81<br />
Management <strong>of</strong> companies & enterprises 2 1 1 4<br />
Admin, support, waste mgt, remediation services 31 14 5 13 6 1 70<br />
Educational services 14 5 2 1 6 28<br />
Health care and social assistance 216 33 30 18 37 334<br />
Arts, entertainment & recreation 13 4 6 5 2 30<br />
Accommodation & food services 57 18 17 57 10 159<br />
Other services (except public administration 107 36 28 29 17 217<br />
Unclassified establishments 4 5 3 1 1 14<br />
Total 982 336 246 309 121 2 1,996<br />
Percent <strong>of</strong> <strong>City</strong> Total 49.2% 16.8% 12.3% 15.5% 6.1% 0.1% 100.0%<br />
NAICS Categories 90301 90302 90303 90304 90305 90311 Total<br />
Forestry, fishing, hunting, and agriculture 0.1% 0.0% 0.4% 0.0% 0.0% 0.0% 0.1%<br />
Utilities 0.0% 0.0% 0.4% 0.0% 0.0% 0.0% 0.1%<br />
Construction 1.9% 7.7% 2.0% 2.9% 3.3% 0.0% 3.2%<br />
Manufacturing 3.8% 9.8% 2.0% 2.6% 1.7% 0.0% 4.3%<br />
Wholesale trade 5.9% 9.2% 5.3% 4.5% 3.3% 0.0% 6.0%<br />
Retail trade 11.4% 11.3% 25.6% 16.5% 17.4% 0.0% 14.3%<br />
Transportation & warehousing 19.3% 14.6% 11.8% 24.3% 0.8% 0.0% 17.2%<br />
Information 0.9% 1.5% 1.6% 1.0% 0.0% 0.0% 1.1%<br />
Finance & insurance 3.3% 2.7% 5.3% 0.6% 2.5% 50.0% 3.0%<br />
Real estate & rental & leasing 3.8% 4.5% 4.1% 3.9% 3.3% 0.0% 3.9%<br />
Pr<strong>of</strong>essional, scientific & technical services 4.4% 4.5% 4.1% 3.2% 2.5% 0.0% 4.1%<br />
Management <strong>of</strong> companies & enterprises 0.2% 0.0% 0.4% 0.3% 0.0% 0.0% 0.2%<br />
Admin, support, waste mgt, remediation services 3.2% 4.2% 2.0% 4.2% 5.0% 50.0% 3.5%<br />
Educational services 1.4% 1.5% 0.8% 0.3% 5.0% 0.0% 1.4%<br />
Health care and social assistance 22.0% 9.8% 12.2% 5.8% 30.6% 0.0% 16.7%<br />
Arts, entertainment & recreation 1.3% 1.2% 2.4% 1.6% 1.7% 0.0% 1.5%<br />
Accommodation & food services 5.8% 5.4% 6.9% 18.4% 8.3% 0.0% 8.0%<br />
Other services (except public administration 10.9% 10.7% 11.4% 9.4% 14.0% 0.0% 10.9%<br />
Unclassified establishments 0.4% 1.5% 1.2% 0.3% 0.8% 0.0% 0.7%<br />
100.0% 100.0% 100.0% 100.0% 100.0% 100.0% 100.0%<br />
Source: U.S. Census Bureau, County Business Pattern, 2003.<br />
3-5 Distribution <strong>of</strong> Firms by ZIP Codes<br />
Stanley R. H<strong>of</strong>fman Associates, Inc. 37 Economic Conditions and Trends<br />
April 20, 2006<br />
<strong>City</strong> <strong>of</strong> <strong>Inglewood</strong> <strong>General</strong> <strong>Plan</strong> <strong>Update</strong>
Figure 3-5<br />
<strong>City</strong> <strong>of</strong> <strong>Inglewood</strong><br />
Sectoral Concentration <strong>of</strong> Establishments by ZIP Codes: 2003<br />
Source: Stanley R. H<strong>of</strong>fman Associates, Inc.<br />
U.S. Census Bureau, County Business Patterns, 2003.<br />
3-6 Distribution <strong>of</strong> Firms by ZIP Codes<br />
Table 3-6<br />
<strong>City</strong> <strong>of</strong> <strong>Inglewood</strong><br />
Locational Index <strong>of</strong> Sectors by ZIP Codes: 2003<br />
NAICS Categories 90301 90302 90303 90304 90305 90311 Total<br />
Forestry, fishing, hunting, and agriculture 1.0 0.0 4.1 0.0 0.0 0.0 1.0<br />
Utilities 0.0 0.0 8.1 0.0 0.0 0.0 1.0<br />
Construction 0.6 2.5 0.6 0.9 1.0 0.0 1.0<br />
Manufacturing 0.9 2.3 0.5 0.6 0.4 0.0 1.0<br />
Wholesale trade 1.0 1.5 0.9 0.8 0.5 0.0 1.0<br />
Retail trade 0.8 0.8 1.8 1.2 1.2 0.0 1.0<br />
Transportation & warehousing 1.1 0.8 0.7 1.4 0.0 0.0 1.0<br />
Information 0.9 1.4 1.5 0.9 0.0 0.0 1.0<br />
Finance & insurance 1.1 0.9 1.8 0.2 0.8 16.6 1.0<br />
Real estate & rental & leasing 1.0 1.1 1.0 1.0 0.8 0.0 1.0<br />
Pr<strong>of</strong>essional, scientific & technical services 1.1 1.1 1.0 0.8 0.6 0.0 1.0<br />
Management <strong>of</strong> companies & enterprises 1.0 0.0 2.0 1.6 0.0 0.0 1.0<br />
Admin, support, waste mgt, remediation ser 0.9 1.2 0.6 1.2 1.4 14.3 1.0<br />
Educational services 1.0 1.1 0.6 0.2 3.5 0.0 1.0<br />
Health care and social assistance 1.3 0.6 0.7 0.3 1.8 0.0 1.0<br />
Arts, entertainment & recreation 0.9 0.8 1.6 1.1 1.1 0.0 1.0<br />
Accommodation & food services 0.7 0.7 0.9 2.3 1.0 0.0 1.0<br />
Other services (except public administration 1.0 1.0 1.0 0.9 1.3 0.0 1.0<br />
Unclassified establishments 0.6 2.1 1.7 0.5 1.2 0.0 1.0<br />
Source: U.S. Census Bureau, County Business Pattern, 2003.<br />
3-6 Locational Index <strong>of</strong> Sectors by ZIP Codes: 2003<br />
Stanley R. H<strong>of</strong>fman Associates, Inc. 38 Economic Conditions and Trends<br />
April 20, 2006<br />
<strong>City</strong> <strong>of</strong> <strong>Inglewood</strong> <strong>General</strong> <strong>Plan</strong> <strong>Update</strong>
3.5 <strong>City</strong> <strong>of</strong> <strong>Inglewood</strong> Compared with the Los Angeles County Economy<br />
• Table 3-7 shows the relative specialization <strong>of</strong> <strong>Inglewood</strong> compared to Los Angles<br />
County. This is shown by indexing the employment distribution <strong>of</strong> the <strong>City</strong> <strong>of</strong> <strong>Inglewood</strong><br />
to the County.<br />
• In 2004, <strong>Inglewood</strong> had a 4.4-times higher share <strong>of</strong> employment in the Arts,<br />
Entertainment and Recreation sector compared to the County. This can be explained by<br />
the relatively higher impact <strong>of</strong> the Hollywood Park Race Track and Casino on the <strong>City</strong>’s<br />
employment base.<br />
• The economy <strong>of</strong> <strong>Inglewood</strong> was also relatively more specialized in Transportation and<br />
Warehousing (3.2) and Health Care and Social Services (1.7).<br />
• Employment share in Retail, and Accommodation and Food Services sectors were<br />
comparable to the County-wide shares.<br />
• However, the below–average employment shares in Pr<strong>of</strong>essional, Scientific and<br />
Technical (0.2), Information (0.2), Manufacturing (0.5) and Finance, Insurance and Real<br />
Estate (0.6) indicate sectors for potential future growth in the <strong>City</strong>.<br />
Table 3-7<br />
<strong>City</strong> <strong>of</strong> <strong>Inglewood</strong> and Los Angeles County<br />
Comparative Sectoral Specialization by Employment Distribution: 2004<br />
<strong>Inglewood</strong><br />
Percent<br />
Employment Distribution<br />
Los Angeles County<br />
Percent<br />
Employment Distribution<br />
INDEX: LA=1<br />
<strong>Inglewood</strong><br />
Pr<strong>of</strong>essional, Scientific and Technical 326 1.1% 239,998 5.9% 0.2<br />
Finance and Real Estate 1,045 3.7% 236,790 5.8% 0.6<br />
Information 244 0.9% 216,122 5.3% 0.2<br />
Arts, Entertainment and Recreation 2,143 7.5% 68,511 1.7% 4.4<br />
Services 9,188 32.2% 1,234,624 30.5% 1.1<br />
Manufacturing 1,782 6.2% 481,790 11.9% 0.5<br />
Retail 2,957 10.4% 406,540 10.0% 1.0<br />
Wholesale 1,326 4.6% 215,636 5.3% 0.9<br />
Government 4,916 17.2% 516,058 12.7% 1.4<br />
Construction 470 1.6% 140,813 3.5% 0.5<br />
Transportation and Warehousing 3,192 11.2% 142,261 3.5% 3.2<br />
Other 975 3.4% 150,791 3.7% 0.9<br />
Total 28,564 100.0% 4,049,934 100.0%<br />
Services<br />
Accomodation and Food Services 2,102 7.4% 304,889 7.5% 1.0<br />
Admin Support, Waste Mgmt 838 2.9% 252,292 6.2% 0.5<br />
Educational Services 366 1.3% 85,117 2.1% 0.6<br />
Health Care and Social Services 4,541 15.9% 370,424 9.1% 1.7<br />
Other Services 1,341 4.7% 221,902 5.5% 0.9<br />
Sub-total 9,188 32.2% 1,234,624 30.5% 1.1<br />
Source: Stanley R.H<strong>of</strong>fman Associates, Inc.<br />
California Employment Development Department (EDD).<br />
3-7 Comparative Sectoral Specialization by Employment Distribution: 2004<br />
Stanley R. H<strong>of</strong>fman Associates, Inc. 39 Economic Conditions and Trends<br />
April 20, 2006<br />
<strong>City</strong> <strong>of</strong> <strong>Inglewood</strong> <strong>General</strong> <strong>Plan</strong> <strong>Update</strong>
Chapter 4 – MARKET CONDITIONS AND TRENDS<br />
4.1 <strong>City</strong> <strong>of</strong> <strong>Inglewood</strong> Taxable Sales: 1994 to 2004<br />
As a major municipal <strong>General</strong> Fund revenue source, sales tax is a significant contributor to the<br />
economic vitality <strong>of</strong> the <strong>City</strong>. Taxable sales data as obtained from the California State Board <strong>of</strong><br />
Equalization show the following trends:<br />
• As shown in Table 4-1 and Figure 4-1, total taxable sales transactions in the <strong>City</strong> <strong>of</strong><br />
<strong>Inglewood</strong> have grown from 1994 to 2004, increasing in constant 2005 dollars from<br />
about $675.0 million in 1993 to $833.2 million in 2004.<br />
• Taxable Retail sales in the <strong>City</strong> grew annually at an average annual rate <strong>of</strong> 2.6 percent<br />
over the period 1994-2004. Taxable non-retail sales grew at less than one-sixth that rate,<br />
or about 0.4 percent annually.<br />
• Trends from 1994 to 2004 show that the <strong>City</strong>’s taxable sales consist primarily <strong>of</strong> retail<br />
sales, and this share has grown. In 1994, taxable retail sales comprised 77.5 percent <strong>of</strong> the<br />
total taxable sales and in 2004 it comprised 81.1 percent <strong>of</strong> the total taxable sales. This<br />
consistent with the decline in manufacturing activity in the <strong>City</strong> from 1994 to 2004.<br />
Table 4-1<br />
<strong>City</strong> <strong>of</strong> <strong>Inglewood</strong> Taxable Sales Trends: 1994 to 2004<br />
(In ‘000s Constant 2005Dollars)<br />
Retail Non Retail Total<br />
Share <strong>of</strong><br />
Retail<br />
1994 $522,915 $152,058 $674,973 77.5%<br />
1995 479,344 193,972 673,316 71.2%<br />
1996 480,565 199,206 679,771 70.7%<br />
1997 465,249 186,598 651,847 71.4%<br />
1998 438,059 192,426 630,484 69.5%<br />
1999 441,728 201,335 643,062 68.7%<br />
2000 586,583 245,260 831,843 70.5%<br />
2001 610,516 197,260 807,776 75.6%<br />
2002 605,810 170,708 776,518 78.0%<br />
2003 591,870 151,922 743,792 79.6%<br />
2004 $675,549 $157,614 $833,163 81.1%<br />
1994 to 2004<br />
Annual Average 2.6% 0.4% 2.1%<br />
Growth Rate<br />
Source: Stanley R.H<strong>of</strong>fman Associates, Inc.<br />
California State Board <strong>of</strong> Equalization.<br />
4-1 <strong>City</strong> <strong>of</strong> <strong>Inglewood</strong> Taxable Sales Trends: 1994-2004<br />
Stanley R. H<strong>of</strong>fman Associates, Inc. 40 Economic Conditions and Trends<br />
April 20, 2006<br />
<strong>City</strong> <strong>of</strong> <strong>Inglewood</strong> <strong>General</strong> <strong>Plan</strong> <strong>Update</strong>
Figure 4-1<br />
<strong>City</strong> <strong>of</strong> <strong>Inglewood</strong> Taxable Sales Trends: 1994 to 2004<br />
(In ‘000s Constant 2005 Dollars)<br />
$900,000<br />
$800,000<br />
$831,843<br />
$776,518<br />
$833,163<br />
$700,000<br />
$600,000<br />
$674,973 $679,771<br />
$630,484<br />
$586,583<br />
$605,810<br />
$675,549<br />
$522,915<br />
$500,000<br />
$400,000<br />
$300,000<br />
$480,565<br />
$438,059<br />
Retail<br />
Non-retail<br />
Total<br />
$200,000<br />
$100,000<br />
$0<br />
1994 1995 1996 1997 1998 1999 2000 2001 2002 2003 2004<br />
Source: Stanley R. H<strong>of</strong>fman Associates, Inc.<br />
California State Board <strong>of</strong> Equalization.<br />
4-1 <strong>City</strong> <strong>of</strong> <strong>Inglewood</strong> Taxable Sales Trends: 1994-2004<br />
4.2 <strong>City</strong> <strong>of</strong> <strong>Inglewood</strong> Taxable Retail Sales Trends: 1994 to 2004<br />
• Taxable Retail sales in the <strong>City</strong> <strong>of</strong> <strong>Inglewood</strong> followed a pattern <strong>of</strong> initial decline from<br />
1994 to1999 and then rose appreciably from 2000 to 2004. These trends can be explained<br />
by stronger sales performance in key retail categories including <strong>General</strong> Merchandise,<br />
Building Materials and Apparel.<br />
• As shown in Table 4-2, <strong>General</strong> Merchandise, which is the single largest retail category<br />
in the <strong>City</strong>, initially declined from $135.6 million in 1994 to $109.9 million in 2000 and<br />
then increasing to $159.3 million by 2004 in constant 2005 dollars<br />
• Building Materials and Apparel retail sales followed patterns similar to <strong>General</strong><br />
Merchandise, reaching a high <strong>of</strong> $65.1 million and $25.2 million, respectively.<br />
• The spurt in <strong>General</strong> Merchandise and Apparel retail sales can be attributed to new big<br />
box retail development in the <strong>City</strong>, including the Hollywood Park Marketplace. Similarly,<br />
the growth in Building Materials sales can be attributed to the Home Depot store opened<br />
recently at the same center.<br />
Stanley R. H<strong>of</strong>fman Associates, Inc. 41 Economic Conditions and Trends<br />
April 20, 2006<br />
<strong>City</strong> <strong>of</strong> <strong>Inglewood</strong> <strong>General</strong> <strong>Plan</strong> <strong>Update</strong>
Table 4-2<br />
<strong>City</strong> <strong>of</strong> <strong>Inglewood</strong> Taxable Sales by Retail Category: 1994 and 2004<br />
PANEL A<br />
Taxable Transactions ('000s)<br />
(constant 2005)<br />
1994 2000 2004<br />
1994-2000<br />
Percent<br />
Change<br />
2000-2004<br />
Percent<br />
Change<br />
Apparel Stores $10,864 $10,654 $25,216 -1.9% 136.7%<br />
<strong>General</strong> Merchandise Stores 135,576 109,892 159,289 -18.9% 45.0%<br />
Food Stores 49,697 50,479 44,582 1.6% -11.7%<br />
Eating and Drinking Places 78,016 82,736 86,720 6.1% 4.8%<br />
Home Furnishings 8,460 9,407 8,875 11.2% -5.7%<br />
Building Materials 49,454 38,159 65,102 -22.8% 70.6%<br />
Auto Dealers and parts 74,153 68,379 83,234 -7.8% 21.7%<br />
Service Stations 59,037 68,939 74,239 16.8% 7.7%<br />
Other Retail 57,658 147,938 158,363 156.6% 7.0%<br />
Total Retail $522,915 $586,583 $705,620 12.2% 20.3%<br />
Non-Retail $201,479 $245,260 $164,630 21.7% -32.9%<br />
Total $724,394 $831,843 $870,250 14.8% 4.6%<br />
DOF Population 1 114,179 112,580 117,640<br />
PANEL B<br />
Per Capita Taxable Transactions<br />
(constant 2005)<br />
1994 2000 2004<br />
1994-2000<br />
Percent<br />
Change<br />
2000-2004<br />
Percent<br />
Change<br />
Apparel Stores $95 $95 $214 -0.5% 126.5%<br />
<strong>General</strong> Merchandise Stores 1,187 976 1,354 -17.8% 38.7%<br />
Food Stores 435 448 379 3.0% -15.5%<br />
Eating and Drinking Places 683 735 737 7.6% 0.3%<br />
Home Furnishings 74 84 75 12.8% -9.7%<br />
Building Materials 433 339 553 -21.7% 63.3%<br />
Auto Dealers and parts 649 607 708 -6.5% 16.5%<br />
Service Stations 517 612 631 18.4% 3.1%<br />
Other Retail 505 1,314 1,346 160.2% 2.4%<br />
Total Retail $4,580 $5,210 $5,998 13.8% 15.1%<br />
Non-Retail 1,765 2,179 1,399 23.5% -35.8%<br />
Total $6,344 $7,389 $7,398 16.5% 0.1%<br />
1.Other Retail includes liquor stores and other ancilllary stores.<br />
2. Population as reported by the California Department <strong>of</strong> Finance.<br />
Source: Stanley R.H<strong>of</strong>fman Associates, Inc.<br />
California State Board <strong>of</strong> Equalization.<br />
California Department <strong>of</strong> Finance, ES-5 Population Projections.<br />
4-2 <strong>City</strong> <strong>of</strong> <strong>Inglewood</strong> Taxable Sales by Retail Category: 1994-2004<br />
Stanley R. H<strong>of</strong>fman Associates, Inc. 42 Economic Conditions and Trends<br />
April 20, 2006<br />
<strong>City</strong> <strong>of</strong> <strong>Inglewood</strong> <strong>General</strong> <strong>Plan</strong> <strong>Update</strong>
4.4 Comparative Taxable Retail Sales<br />
• Figure 4-2 and Table 4-3 show per capita taxable retail sales in constant 2005 dollars for<br />
<strong>Inglewood</strong>, nearby South Bay cities and Los Angeles County in year 2004.<br />
• Per capita taxable retail sales in <strong>Inglewood</strong> were lowest at $5,998 amongst the largest six<br />
cites in the South Bay.<br />
• In comparison, the South Bay cities and Los Angeles County had average per capita<br />
taxable retail sales <strong>of</strong> $8,980 and $8,939, respectively, as shown in Figure 4-2.<br />
$25,000<br />
Figure 4-2<br />
<strong>City</strong> <strong>of</strong> <strong>Inglewood</strong> and South Bay Cities<br />
Per Capita Taxable Retail Sales: 2004<br />
(in Constant 2005 Dollars)<br />
$20,000<br />
$20,916<br />
$15,000<br />
$12,725<br />
$10,000<br />
$11,027<br />
$9,599<br />
$9,256<br />
$8,980<br />
$8,939<br />
$5,998<br />
$5,000<br />
$0<br />
Torrance Carson Redondo<br />
Beach<br />
Hawthorne Gardena <strong>Inglewood</strong> South Bay<br />
Cities<br />
Los<br />
Ange le s<br />
County<br />
Source: Stanley R. H<strong>of</strong>fman Associates, Inc.<br />
California State Board <strong>of</strong> Equalization.<br />
4-2 Per Capita Taxable Retail Sales: 2004<br />
Stanley R. H<strong>of</strong>fman Associates, Inc. 43 Economic Conditions and Trends<br />
April 20, 2006<br />
<strong>City</strong> <strong>of</strong> <strong>Inglewood</strong> <strong>General</strong> <strong>Plan</strong> <strong>Update</strong>
PANEL A<br />
Table 4-3<br />
South Bay Cities<br />
Taxable Retail Sales Trends: 1994 to 2004<br />
(Constant 2005 Dollars)<br />
Taxable Transactions ('000s)<br />
(constant 2005)<br />
1994 2000 2004<br />
Annual<br />
Average<br />
Growth Rate<br />
1994-2000<br />
Annual Average<br />
Growth Rate<br />
2000-2004<br />
South Bay Cities<br />
<strong>Inglewood</strong> $522,918 $586,583 $705,620 1.9% 4.7%<br />
Carson 848,882 1,147,070 1,225,912 5.1% 1.7%<br />
El Segundo 211,125 426,402 413,342 12.4% -0.8%<br />
Gardena 470,047 535,719 561,617 2.2% 1.2%<br />
Hawthorne 586,809 595,158 846,813 0.2% 9.2%<br />
Hermosa Beach 147,429 233,235 232,282 7.9% -0.1%<br />
Lawndale 169,288 188,209 201,640 1.8% 1.7%<br />
Lomita 91,292 109,699 111,920 3.1% 0.5%<br />
Manhattan Beach 437,638 538,321 546,324 3.5% 0.4%<br />
Palos Verdes Estate 10,501 13,069 11,630 3.7% -2.9%<br />
Rancho Palos Verdes 60,818 69,599 69,826 2.3% 0.1%<br />
Redondo Beach 730,851 738,454 738,267 0.2% 0.0%<br />
Rolling Hills 974 91 933 -32.7% 79.2%<br />
Rolling Hills Estates 142,164 128,649 127,191 -1.7% -0.3%<br />
Torrance $2,624,838 $3,164,677 $3,059,289 3.2% -0.8%<br />
South Bay Total $7,055,575 $6,741,282 $6,921,075 -0.8% 0.7%<br />
Share <strong>of</strong> <strong>Inglewood</strong> 7.41% 8.70% 10.20% 2.7% 4.0%<br />
Los Angeles County $65,967,009 $82,697,286 $90,346,952 3.8% 2.2%<br />
PANEL B<br />
Per Capita Retail Sales ('000s)<br />
(constant 2005)<br />
1994 2000 2004<br />
Annual<br />
Average<br />
Growth Rate<br />
1994-2000<br />
Annual Average<br />
Growth Rate<br />
2000-2004<br />
<strong>Inglewood</strong> $4,580 $5,210 $5,998 2.2% 3.6%<br />
Carson 9,787 12,784 12,725 4.6% -0.1%<br />
El Segundo 13,408 26,595 24,505 12.1% -2.0%<br />
Gardena 8,676 9,277 9,256 1.1% -0.1%<br />
Hawthorne 7,845 7,076 9,599 -1.7% 7.9%<br />
Hermosa Beach 7,839 12,563 11,878 8.2% -1.4%<br />
Lawndale 5,862 5,935 6,069 0.2% 0.6%<br />
Lomita 4,628 5,472 5,331 2.8% -0.7%<br />
Manhattan Beach 13,166 15,902 14,930 3.2% -1.6%<br />
Palos Verdes Estate 765 980 825 4.2% -4.2%<br />
Rancho Palos Verdes 1,434 1,692 1,617 2.8% -1.1%<br />
Redondo Beach 11,594 11,673 11,027 0.1% -1.4%<br />
Rolling Hills 507 48 476 -32.4% 77.1%<br />
Rolling Hills Estates 17,651 16,760 15,652 -0.9% -1.7%<br />
Torrance 19,101 22,941 20,916 3.1% -2.3%<br />
South Bay Cities $9,897 $9,240 $8,980 -1.1% -0.7%<br />
Los Angeles County $7,108 $8,687 $8,939 3.4% 0.7%<br />
Source: Stanley R.H<strong>of</strong>fman Associates, Inc.<br />
California State Board <strong>of</strong> Equalization.<br />
California Department <strong>of</strong> Finance, ES-5 Population Projections.<br />
4-3 South Bay Cities: Taxable Retail Sales Trends: 1994 to 2004<br />
Stanley R. H<strong>of</strong>fman Associates, Inc. 44 Economic Conditions and Trends<br />
April 20, 2006<br />
<strong>City</strong> <strong>of</strong> <strong>Inglewood</strong> <strong>General</strong> <strong>Plan</strong> <strong>Update</strong>
4.5 <strong>City</strong> <strong>of</strong> <strong>Inglewood</strong> Retail Leakage Analysis<br />
• Table 4-4 presents per capita sales in the <strong>City</strong> <strong>of</strong> <strong>Inglewood</strong> as a ratio <strong>of</strong> those in Los<br />
Angeles County in 2004. This is provided as a measure <strong>of</strong> retail leakage from the <strong>City</strong>’s<br />
market area.<br />
• As shown in Table 4-3, total Per Capita retail sales in the <strong>City</strong> <strong>of</strong> <strong>Inglewood</strong> were<br />
approximately 30 percent lower than those in the County <strong>of</strong> Los Angeles.<br />
• Retail categories that performed better than or near par with the County <strong>of</strong> Los Angeles<br />
included <strong>General</strong> Merchandise (1.04) and Other Retail (0.95).<br />
• Retail categories that indicated high levels <strong>of</strong> leakage included Home Furnishings (0.18),<br />
Auto Dealers and Parts (0.37), and Apparel Stores (0.43).<br />
Table 4-4<br />
<strong>City</strong> <strong>of</strong> <strong>Inglewood</strong> and County <strong>of</strong> Los Angeles<br />
Comparative Per Capita Taxable Sales: 2004<br />
(Constant 2005 Dollars)<br />
<strong>City</strong> <strong>of</strong><br />
<strong>Inglewood</strong><br />
County <strong>of</strong><br />
Los Angeles<br />
Leakage<br />
Factor<br />
Apparel Stores $214 $497 0.43<br />
<strong>General</strong> Merchandise Stores 1,354 1,301 1.04<br />
Food Stores 379 436 0.87<br />
Eating and Drinking Places 737 1,244 0.59<br />
Home Furnishings 75 417 0.18<br />
Building Materials 553 817 0.68<br />
Auto Dealers and parts 708 1,899 0.37<br />
Service Stations 631 911 0.69<br />
Other Retail 1 1,346 1,417 0.95<br />
Total Retail $5,998 $8,939 0.67<br />
1. Includes Liquor Stores and other ancillary stores.<br />
Source: Stanley R.H<strong>of</strong>fman Associates, Inc.<br />
California State Board <strong>of</strong> Equalization.<br />
California Department <strong>of</strong> Finance, ES-5 Population Projections.<br />
4-4 Comparative Per Capita Taxable Retail Sales: 2004<br />
Stanley R. H<strong>of</strong>fman Associates, Inc. 45 Economic Conditions and Trends<br />
April 20, 2006<br />
<strong>City</strong> <strong>of</strong> <strong>Inglewood</strong> <strong>General</strong> <strong>Plan</strong> <strong>Update</strong>
4.6 Retail Market Inventory in the <strong>City</strong> <strong>of</strong> <strong>Inglewood</strong><br />
• Table 4-5 presents the retail market inventory for the <strong>City</strong> <strong>of</strong> <strong>Inglewood</strong> compiled from<br />
the 2003 Shopping Center Directory and field surveys conducted by Stanley R. H<strong>of</strong>fman<br />
Associates, Inc in April, 2006.<br />
• There are a total <strong>of</strong> 16 shopping centers identified in the <strong>City</strong> <strong>of</strong> <strong>Inglewood</strong>, not counting<br />
strip commercial and downtown commercial along major arterials.<br />
• Retail centers in <strong>Inglewood</strong> have an estimated 1,572,788 square feet <strong>of</strong> retail space.<br />
• The newest retail development within the city is located to the east and south <strong>of</strong><br />
Hollywood Park. The Hollywood Park Marketplace, The Village at Century and the<br />
Costco/Silvercreek Properties (Century Plaza) centers have a total <strong>of</strong> over 800,000 square<br />
feet <strong>of</strong> retail space—50 percent <strong>of</strong> the estimated total square footage.<br />
4.7 Retail Market Lease and Vacancy Rates: 2006<br />
• As shown in Table 4-6, retail lease rates in the <strong>City</strong> <strong>of</strong> <strong>Inglewood</strong> currently range from<br />
$0.92 - $3.00 per square foot (NNN) depending on location and size <strong>of</strong> retail space.<br />
• In 2006, the <strong>City</strong> had an estimated total vacancy <strong>of</strong> about 67,363 sq.ft or 4.3 percent <strong>of</strong><br />
the total retail center inventory.<br />
• The largest vacant retail space <strong>of</strong> 40,608 sq.ft was found in the Crenshaw Imperial<br />
Shopping Center.<br />
Stanley R. H<strong>of</strong>fman Associates, Inc. 46 Economic Conditions and Trends<br />
April 20, 2006<br />
<strong>City</strong> <strong>of</strong> <strong>Inglewood</strong> <strong>General</strong> <strong>Plan</strong> <strong>Update</strong>
Table 4-5<br />
<strong>City</strong> <strong>of</strong> <strong>Inglewood</strong><br />
Retail Market Inventory: 2006<br />
Shopping Center Name Intersection Type 1 /Year Built<br />
Total Sq.<br />
Ft.<br />
Anchors<br />
Anchor<br />
Square<br />
Feet<br />
1 Airport Plaza Northwest corner ISIS and N 23,523<br />
Manchester - 1117 Manchester<br />
2 Century Hawthorne Southeast corner <strong>of</strong> Century and N 12,407<br />
Hawthorne Boulevards 1985<br />
3 Century Plaza Southeast corner Yukon Ave and C 210,000 Costco 150,000<br />
Century Blvd 2005<br />
4 Century Square Southeast corner Century and N 16,309<br />
Hawthorne Boulevards 1986<br />
5 Crenshaw Imperial Shopping Center Northeast corner Imperial Hwy C 152,360 Superior Market 40,000<br />
and Crenshaw 1958 Rite Aid Pharmacy 17,000<br />
6 Crenshaw Imperial Plaza Southeast corner <strong>of</strong> Imperial Hwy C 215,034 Sav-on Drugs 22,500<br />
and Crenshaw 1960 RAC Rent-a-Center 5,110<br />
U.S. Post Office 4,800<br />
7 Food 4 Less Southwest corner <strong>of</strong> Century and C 109,014 Food 4 Less 79,101<br />
Crenshaw<br />
8 Hollywood Park Plaza Southwest corner <strong>of</strong> Prairie Ave. N 30,212<br />
and E. Hardy St.<br />
9 Hollywood Park Marketplace Northeast corner <strong>of</strong> Century and Yukon R 435,000 Target 111,000<br />
2005 Home Depot 130,000<br />
Gigante 90,000<br />
Staples 20,300<br />
10 <strong>Inglewood</strong> Center Southeast corner <strong>of</strong> S. Market and Florence C 102,276 Sav-on Drugs 25,000<br />
and East Florence 1966 Kragen Auto Parts 15,000<br />
11 La Brea Plaza Southeast corner <strong>of</strong> La Brea and N 45,100<br />
Centinela<br />
12 Manchester Business Park North side <strong>of</strong> W. Manchester N 8,352<br />
between Isis and Hindry<br />
13 Manchester Plaza Southwest corner <strong>of</strong> Manchester N 4,516<br />
and Eucalyptus<br />
14 Unnamed Shopping Center North side <strong>of</strong> W. Manchester N 8,519<br />
between Ash and Oak<br />
15 The Village at Century South side <strong>of</strong> Century Blvd. C 193,000 Bed, Bath and Beyond 38,000<br />
east <strong>of</strong> Yukon 2006 Ross 33,650<br />
Marshalls 33,600<br />
16 Village Manchester Southwest corner Manchester N 7,166<br />
and <strong>Inglewood</strong> Aves.<br />
Total 1,572,788<br />
1. C = Community (100,000 to 300,000 sq. ft.) , N = Neighborhood (30,000 to 100,000 sq. ft.),<br />
R = Regional (300,000 to > 1,000,000 sq. ft.), SR = Super Regional (> 1,000,000 sq. ft.)<br />
Source: Stanley R. H<strong>of</strong>fman Associates, Inc.<br />
Shopping Center Directory-West 2003, National Research Bureau.<br />
4-5 Retail Market Inventory: 2006<br />
Stanley R. H<strong>of</strong>fman Associates, Inc. 47 Economic Conditions and Trends<br />
April 20, 2006<br />
<strong>City</strong> <strong>of</strong> <strong>Inglewood</strong> <strong>General</strong> <strong>Plan</strong> <strong>Update</strong>
Table 4-6<br />
<strong>City</strong> <strong>of</strong> <strong>Inglewood</strong><br />
Retail Market Lease and Vacancy Rates: 2006<br />
Shopping Center Rate/SF/Month Vacant Total Vacancy<br />
Name/Location NNN SF SF Rate<br />
1 Airport Plaza Not Available 6,422 23,523 27.3%<br />
2 Century Hawthorne Not Available 0 12,407 0.0%<br />
3 Century Plaza Not Available 0 210,000 0.0%<br />
4 Century Square $2.05 0 16,309 0.0%<br />
5 Crenshaw Imperial Shopping Center $1.50-$2.25 8,709 152,360 5.7%<br />
6 Crenshaw Imperial Plaza $1.25-$2.25 40,608 215,034 18.9%<br />
7 Food 4 Less Not Available 0 109,014 0.0%<br />
8 Holly Park Plaza Not Available 2,702 30,212 8.9%<br />
9 Hollywood Park Marketplace Not Available 0 435,000 0.0%<br />
10 <strong>Inglewood</strong> Center Not Available 6,083 102,276 5.9%<br />
11 La Brea Plaza $1.25-$2.37 2,839 45,100 6.3%<br />
12 Manchester Business Park Not Available 0 8,352 0.0%<br />
13 Manchester Plaza Not Available 0 4,516 0.0%<br />
14 Unnamed Shopping Center Not Available 0 8,519 0.0%<br />
15 The Village at Century (2) $0.92-$3.00 0 193,000 0.0%<br />
16 Village Manchester Not Available 0 7,166 0.0%<br />
Total 67,363 1,572,788 4.3%<br />
1.Triple net ("NNN") rental rate assumes that tenant pays their share <strong>of</strong> operating expenses, such as<br />
property taxes, utilities and maintenance and insurance.<br />
2. The Village at Century project has just been completed and businesses are starting to open.<br />
Businesses that have not opened are not included under vacancies.<br />
Source: Stanley R. H<strong>of</strong>fman Associates<br />
4-6 Retail Market Lease and Vacancy Rates: 2006<br />
Stanley R. H<strong>of</strong>fman Associates, Inc. 48 Economic Conditions and Trends<br />
April 20, 2006<br />
<strong>City</strong> <strong>of</strong> <strong>Inglewood</strong> <strong>General</strong> <strong>Plan</strong> <strong>Update</strong>
Chapter 5 – Real Estate Trends<br />
5.1 Building Activity<br />
Non-residential Building Activity<br />
• Table 5-1 and Figure 5-1 show non-residential building activity trends in the <strong>City</strong> <strong>of</strong><br />
<strong>Inglewood</strong> from 1994 to 2004 based on the data provided by the Construction Industry<br />
Research Board.<br />
• As shown in constant 2006 dollars, nearly all <strong>of</strong> the building activity permitted in terms<br />
<strong>of</strong> valuation over this time period was commercial, which averaged 99.8 percent <strong>of</strong> the<br />
total valuation annually compared to just 0.2 percent for industrial valuation.<br />
• As shown in Figure 5-1, industrial building activity only occurred in 1999 and the<br />
valuation for this industrial building was quite small, only $189,000.<br />
• The valuation for new commercial buildings displayed significant fluctuation over the 10<br />
year time period. The valuation (in constant 2006 dollars) for new commercial buildings<br />
ranged from just $612,000 in 1995 to about 28.3 million in 2003.<br />
Table 5-1<br />
<strong>City</strong> <strong>of</strong> <strong>Inglewood</strong><br />
Non-Residential Building Permit Valuations: 1994-2004<br />
(In thousands <strong>of</strong> constant 2006 dollars)<br />
Year Commercial % <strong>of</strong> Total Industrial % <strong>of</strong> Total Total Units<br />
1994 $1,963 100.0% $0 0.0% $1,963<br />
1995 612 100.0% 0 0.0% 612<br />
1996 1,674 100.0% 0 0.0% 1,674<br />
1997 704 100.0% 0 0.0% 704<br />
1998 1,994 100.0% 0 0.0% 1,994<br />
1999 11,572 98.4% 189 1.6% 11,761<br />
2000 17,855 100.0% 0 0.0% 17,855<br />
2001 1,370 100.0% 0 0.0% 1,370<br />
2002 3,659 100.0% 0 0.0% 3,659<br />
2003 28,331 100.0% 0 0.0% 28,331<br />
2004 $8,898 100.0% $0 0.0% $8,898<br />
Annual Average $7,148 99.8% $17 0.2% $7,166<br />
Source: Stanley R. H<strong>of</strong>fman Associates, Inc.<br />
Construction Industry Research Board.<br />
5-1 Non-Residential Building Permit Valuations: 1994-2004<br />
Stanley R. H<strong>of</strong>fman Associates, Inc. 49 Economic Conditions and Trends<br />
April 20, 2006<br />
<strong>City</strong> <strong>of</strong> <strong>Inglewood</strong> <strong>General</strong> <strong>Plan</strong> <strong>Update</strong>
Figure 5-1<br />
<strong>City</strong> <strong>of</strong> <strong>Inglewood</strong><br />
Non-Residential Building Activity: 1994-2004<br />
(in thousands <strong>of</strong> constant 2006 dollars)<br />
$30,000<br />
$25,000<br />
$20,000<br />
$15,000<br />
$10,000<br />
$5,000<br />
$0<br />
1994 1995 1996 1997 1998 1999 2000 2001 2002 2003 2004<br />
Commercial<br />
Industrial<br />
Source: Stanley R. H<strong>of</strong>fman Associates, Inc.<br />
Construction Industry Research Board, 2005.<br />
5-1 Non Residential Building Activity: 1992-2004<br />
Residential Building Activity<br />
• Table 5-2 and Figure 5-2 show residential building activity from 1994 to 2004 in the <strong>City</strong><br />
<strong>of</strong> <strong>Inglewood</strong> based on the data provided by the Construction Industry Research Board.<br />
Over this time period, a total <strong>of</strong> 346 housing units were permitted. Only 37.9 percent <strong>of</strong><br />
total units permitted were single-family residences while 62.1 percent were multi-family<br />
units.<br />
• The data indicates that on an average, 31 new residential units were permitted every year,<br />
<strong>of</strong> which 12 were single-family units and 20 were multi-family units. However, at least<br />
200 more units have been added to the housing stock since 2004.<br />
• As shown in Table 5-2, on average from 1994 to 2004, there were more multi-family<br />
units than multi-family units permitted. As shown in Figure 5-2, the permitting <strong>of</strong> new<br />
units fluctuated over this period.<br />
Stanley R. H<strong>of</strong>fman Associates, Inc. 50 Economic Conditions and Trends<br />
April 20, 2006<br />
<strong>City</strong> <strong>of</strong> <strong>Inglewood</strong> <strong>General</strong> <strong>Plan</strong> <strong>Update</strong>
Year<br />
Table 5-2<br />
<strong>City</strong> <strong>of</strong> <strong>Inglewood</strong><br />
Residential Building Activity: 1994 to 2004<br />
(in thousands <strong>of</strong> constant 2006 dollars)<br />
Single-<br />
Family<br />
% <strong>of</strong><br />
Total<br />
Multi-<br />
Family<br />
% <strong>of</strong><br />
Total<br />
Total<br />
Units<br />
1994 6 100.0% 0 0.0% 6<br />
1995 9 36.0% 16 64.0% 25<br />
1996 9 60.0% 6 40.0% 15<br />
1997 2 5.6% 34 94.4% 36<br />
1998 6 16.2% 31 83.8% 37<br />
1999 23 92.0% 2 8.0% 25<br />
2000 13 59.1% 9 40.9% 22<br />
2001 3 3.0% 97 97.0% 100<br />
2002 22 84.6% 4 15.4% 26<br />
2003 9 42.9% 12 57.1% 21<br />
2004 29 87.9% 4 12.1% 33<br />
Total 131 215 346<br />
Annual Average 12 37.9% 20 62.1% 31<br />
Source: Stanley R. H<strong>of</strong>fman Associates, Inc.<br />
Construction Industry Research Board.<br />
5-2 Residential Building Activity: 1994-2004<br />
120<br />
Figure 5-2<br />
<strong>City</strong> <strong>of</strong> <strong>Inglewood</strong><br />
Residential Building Activity: 1995 to 2005<br />
100<br />
80<br />
60<br />
40<br />
20<br />
0<br />
1994 1995 1996 1997 1998 1999 2000 2001 2002 2003 2004<br />
Single- Family<br />
Multi- Family<br />
Source: Stanley R. H<strong>of</strong>fman Associates, Inc.<br />
Construction Industry Research Board, 2005.<br />
5-2 Residential Building Activity<br />
Stanley R. H<strong>of</strong>fman Associates, Inc. 51 Economic Conditions and Trends<br />
April 20, 2006<br />
<strong>City</strong> <strong>of</strong> <strong>Inglewood</strong> <strong>General</strong> <strong>Plan</strong> <strong>Update</strong>
5.2 Housing Value<br />
Single Family Residential<br />
• As shown in Table 5-3, according to DataQuick the median price <strong>of</strong> a single-family<br />
residence sold in the <strong>City</strong> <strong>of</strong> <strong>Inglewood</strong> in February, 2006 was $475,000.<br />
• In comparison, the median price <strong>of</strong> a single-family residence sold in the South Bay Cities<br />
was significantly higher at $795,000, and $525,000 in the County.<br />
• Within the South Bay, the <strong>City</strong> <strong>of</strong> Manhattan Beach had the highest single-family<br />
residence median sales price at $1.95 million.<br />
Table 5-3<br />
<strong>City</strong> <strong>of</strong> <strong>Inglewood</strong>, South Bay Cities, and Los Angeles County<br />
Single Family Median Sales Price: February 2006<br />
Single Family Residences<br />
ZIP CODE No. Sold Price ('000s) % change 1<br />
<strong>Inglewood</strong> 90301 3 $470 17.4%<br />
<strong>Inglewood</strong> 90302 8 458 26.2%<br />
<strong>Inglewood</strong> 90303 3 450 20.6%<br />
<strong>Inglewood</strong> 90304 4 450 47.5%<br />
<strong>Inglewood</strong> 90305 3 585 37.6%<br />
<strong>Inglewood</strong> Total 21 $475 n/a<br />
Carson 90745 21 $500 17.1%<br />
Carson 90746 10 540 22.6%<br />
El Segundo 90245 4 920 26.5%<br />
Gardena 90247 10 449 16.8%<br />
Gardena 90248 2 464 14.1%<br />
Gardena 90249 12 510 18.3%<br />
Hawthorne 90250 22 538 13.8%<br />
Hermosa Beach 90254 4 970 -2.1%<br />
Lawndale 90260 8 580 27.8%<br />
Lomita 90717 6 549 -1.5%<br />
Manhattan Beach 90266 22 1,950 23.8%<br />
Palos Verdes Estates 2 90274 15 1,375 11.7%<br />
Rancho Palos Verdes 90275 11 1,100 14.3%<br />
Redondo Beach 90277 10 1,000 23.5%<br />
Redondo Beach 90278 17 731 2.0%<br />
Torrance 90501 15 555 13.3%<br />
Torrance 90502 7 540 25.0%<br />
Torrance 90503 13 758 15.8%<br />
Torrance 90504 9 615 8.1%<br />
Torrance 90505 12 775 3.5%<br />
South Bay Cities Total 251 $795 n/a<br />
(including <strong>Inglewood</strong>)<br />
Los Angeles County 4,299 $525 19.3%<br />
1. Indicates percent change from February, 2005.<br />
2. Rolling Hills and Rolling Hills Estates fall within the zip code 90274.<br />
Source: Stanley R. H<strong>of</strong>fman Associates, Inc.<br />
DataQuick Datanews. February, 06<br />
5-3 Single Family Median Sales Price: February 2006<br />
Stanley R. H<strong>of</strong>fman Associates, Inc. 52 Economic Conditions and Trends<br />
April 20, 2006<br />
<strong>City</strong> <strong>of</strong> <strong>Inglewood</strong> <strong>General</strong> <strong>Plan</strong> <strong>Update</strong>
Condominiums<br />
• As shown in Table 5-4, the median price <strong>of</strong> a condominium sold in the <strong>City</strong> <strong>of</strong> <strong>Inglewood</strong><br />
in February, 2006 was around $330,000.<br />
• In comparison, the median condominium sales price in the South Bay Cities was<br />
estimated significantly higher at about $500,000, and in the County at $407,000.<br />
• Within the South Bay, the <strong>City</strong> <strong>of</strong> Hermosa Beach had the highest median sales price for<br />
condominiums at $1.12 million.<br />
Table 5-4<br />
<strong>City</strong> <strong>of</strong> <strong>Inglewood</strong>, South Bay Cities, and Los Angeles County<br />
Condominium Median Sales Price: February 2006<br />
Condominiums<br />
ZIP CODE No. Sold Price ('000s) % change 1<br />
<strong>Inglewood</strong> 90301 4 308 21.2%<br />
<strong>Inglewood</strong> 90302 10 312 14.5%<br />
<strong>Inglewood</strong> 90303 n/a n/a n/a<br />
<strong>Inglewood</strong> 90304 n/a n/a n/a<br />
<strong>Inglewood</strong> 90305 5 385 24.7%<br />
<strong>Inglewood</strong> Total 19 $330 n/a<br />
Carson 90745 10 340 55.4%<br />
Carson 90746 n/a n/a n/a<br />
El Segundo 90245 6 465 10.3%<br />
Gardena 90247 6 390 42.3%<br />
Gardena 90248 n/a n/a n/a<br />
Gardena 90249 1 365 52.4%<br />
Hawthorne 90250 5 373 49.2%<br />
Hermosa Beach 90254 4 1120 39.1%<br />
Lawndale 90260 5 370 -17.5%<br />
Lomita 90717 3 337 -34.8%<br />
Manhattan Beach 90266 3 850 -35.7%<br />
Palos Verdes Estates 2 90274 n/a n/a n/a<br />
Rancho Palos Verdes 90275 3 583 33.1%<br />
Redondo Beach 90277 9 600 -6.1%<br />
Redondo Beach 90278 16 655 6.4%<br />
Torrance 90501 6 538 26.5%<br />
Torrance 90502 6 331 6.9%<br />
Torrance 90503 6 675 32.6%<br />
Torrance 90504 2 477 9.2%<br />
Torrance 90505 6 534 22.1%<br />
South Bay Cities Total 116 $500 n/a<br />
(including <strong>Inglewood</strong>)<br />
Los Angeles County 1,107 407 15.6%<br />
1. Indicates percent change from February, 2005.<br />
2. Rolling Hills and Rolling Hills Estates fall within the zip code 90274.<br />
Source: Stanley R. H<strong>of</strong>fman Associates, Inc.<br />
DataQuick Datanews. February, 06<br />
5-4 Condominium Median Sales Price: May 2005<br />
Stanley R. H<strong>of</strong>fman Associates, Inc. 53 Economic Conditions and Trends<br />
April 20, 2006<br />
<strong>City</strong> <strong>of</strong> <strong>Inglewood</strong> <strong>General</strong> <strong>Plan</strong> <strong>Update</strong>
5.3 Multi-Family Rental Market<br />
• As shown in Figure 5-3, according to the 2000 Census, the median monthly contract rent<br />
(in nominal dollars) for the <strong>City</strong> <strong>of</strong> <strong>Inglewood</strong> was $613. This was slightly lower than the<br />
median contract rent for Los Angeles County at $643.<br />
• The median contract rent in 2006 dollars is estimated to be $751 for <strong>Inglewood</strong>, and $788<br />
for the County.<br />
$900<br />
Figure 5-3<br />
Comparative Median Contract Rent: 2000 and 2006 1<br />
$800<br />
$751<br />
$788<br />
$700<br />
$600<br />
$613<br />
$643<br />
$500<br />
$400<br />
$300<br />
<strong>Inglewood</strong><br />
Los Angeles<br />
2000 2006<br />
1. The 2006 Median Contract Rent was estimated by inflating the Census 2000 median contract rent using<br />
the Consumer Price Index (CPI) from the Bureau <strong>of</strong> Labor Statistics, or a factor <strong>of</strong> 1.25<br />
Source: Stanley R. H<strong>of</strong>fman Associates, Inc.<br />
U.S. Bureau <strong>of</strong> the Census, 2000.<br />
5-3 Comparative Median Contract Rent: 2000 and 2006<br />
Stanley R. H<strong>of</strong>fman Associates, Inc. 54 Economic Conditions and Trends<br />
April 20, 2006<br />
<strong>City</strong> <strong>of</strong> <strong>Inglewood</strong> <strong>General</strong> <strong>Plan</strong> <strong>Update</strong>
Chapter 6– LOCATIONAL AND ECONOMIC OPPORTUNITIES<br />
The following chapter presents the key locational and economic opportunities in the <strong>City</strong> <strong>of</strong><br />
<strong>Inglewood</strong> that could provide impetus to the economy <strong>of</strong> <strong>Inglewood</strong>. These include opportunities<br />
arising from proximity to LAX, tourism and lodging industry, and the redevelopment <strong>of</strong> the<br />
Hollywood Park, the Forum and the Downtown area.<br />
6.1 Los Angeles International Airport<br />
• The passenger volume at LAX is projected to increase from just over 60 million air<br />
passengers (MAPs) in 2004 to 78.0 MAP in 2030. Most <strong>of</strong> the additional passenger<br />
volume is projected to be handled by other airports in the region such as Ontario and<br />
Palmdale.<br />
• The air cargo volume at LAX is projected to increase from 2.0 million tons in 2003 to 2.3<br />
million tons in 2030. Most <strong>of</strong> the growth in air cargo is expected to be handled by other<br />
regional airports.<br />
• The environmental analysis <strong>of</strong> the LAX Master <strong>Plan</strong> 2000 Draft EIS/EIR resulted in the<br />
formulation <strong>of</strong> Alternative D that was presented and evaluated in the 2003 LAX Master<br />
<strong>Plan</strong> Addendum and 2003 Supplement to the Draft EIS/EIR.<br />
• Alternative D was a new alternative in response to public comment on Master <strong>Plan</strong><br />
Alternatives A,B,C and the No Action/No Project Alternative.<br />
• Alternative D was developed to <strong>of</strong>fer a regional airport development alternative for LAX.<br />
It would be designed to serve approximately 78 million annual passengers which is<br />
similar to the activity level identified in the scenario adopted by SCAG for LAX. It<br />
would encourage other airports in the region to develop facilities to accommodate<br />
regional demand beyond the level served at LAX.<br />
• Alternative D is intended to respond to increased security threats with the objective <strong>of</strong><br />
providing a facility that can continue to operate under the highest security levels with<br />
minimal impacts to the passenger processing experience.<br />
• The ground access network would be redeveloped to limit vehicle access to the central<br />
terminal area (CTA) and to remove vehicle parking from the area. The CTA would be<br />
accessed via the Landside Automated People Mover (APM) system.<br />
• Some <strong>of</strong> the other components <strong>of</strong> Alternative D include: four new passenger terminals,<br />
new aircraft rescue and firefighting facilities, parallel taxiways between the runways on<br />
the north and south airfields to reduce the potential for runway incursions and airfield<br />
reconfigurations to provide unrestricted movement for New Large Aircraft (NLA).<br />
Alternative D also includes a new Ground Transportation Center (GTC) to improve the<br />
landside level <strong>of</strong> service at LAX, a Consolidated Rental Car Facility and an Intermodal<br />
Transportation Center.<br />
• The LAX Master <strong>Plan</strong> Stipulated Settlement was approved by Mayor Villaraigosa and the<br />
Los Angeles <strong>City</strong> Council in early 2006 resulting in an historic settlement <strong>of</strong> lawsuits<br />
Stanley R. H<strong>of</strong>fman Associates, Inc. 55 Economic Conditions and Trends<br />
April 20, 2006<br />
<strong>City</strong> <strong>of</strong> <strong>Inglewood</strong> <strong>General</strong> <strong>Plan</strong> <strong>Update</strong>
filed against the LAX Master <strong>Plan</strong>. It was also approved by other cities including the<br />
<strong>City</strong> <strong>of</strong> <strong>Inglewood</strong>.<br />
• The settlement allows LAWA to begin construction on the LAX South Airfield<br />
Improvement Project and to develop new plans for LAX consistent with the Mayor’s<br />
vision for the regional redistribution <strong>of</strong> aviation demand.<br />
• The settlement will create a community-based planning process to revisit and potentially<br />
replace controversial “yellow light” projects such as the Manchester Square Ground<br />
Transportation Center.<br />
6.2 Tourism and Lodging<br />
• The majority <strong>of</strong> the hotels and motels in <strong>Inglewood</strong> serve tourists and business travelers<br />
from Los Angeles International Airport.<br />
• The hotels and motels are primarily located along Century Boulevard, as well as<br />
Manchester Avenue and the Imperial Highway.<br />
• As shown in Table 6-1, the <strong>City</strong> <strong>of</strong> <strong>Inglewood</strong> generated about $1.84 million in transient<br />
occupancy tax revenue for 2002-2003. Of the South Bay Cities, Torrance generated the<br />
most amount <strong>of</strong> transient occupancy tax revenue with about $5.52 million.<br />
Table 6-1<br />
<strong>City</strong> <strong>of</strong> <strong>Inglewood</strong> and South Bay Cities<br />
Transient Occupancy Tax Revenues in 2002-2003<br />
Revenue<br />
% <strong>of</strong> South Bay<br />
Cities<br />
<strong>Inglewood</strong> $1,835,682 10.1%<br />
Carson 804,397 4.4%<br />
El Segundo 2,866,811 15.8%<br />
Gardena 475,298 2.6%<br />
Hawthorne 929,673 5.1%<br />
Hermosa Beach 1,054,272 5.8%<br />
Lawndale 297,339 1.6%<br />
Lomita 100,792 0.6%<br />
Manhattan Beach 2,040,428 11.2%<br />
Palos Verdes Estates 0 0.0%<br />
Rancho Palos Verdes 15,508 0.1%<br />
Redondo Beach 2,257,526 12.4%<br />
Rolling Hills 0 0.0%<br />
Rolling Hills Estates 0 0.0%<br />
Torrance $5,523,329 30.3%<br />
Total South Bay Cities $18,201,055 100.0%<br />
1. The transient occupancy tax for the <strong>City</strong> <strong>of</strong> Los Angeles is excluded<br />
because it is reported as an aggregate for the <strong>City</strong> and not by sub-area,<br />
such as along Century Blvd. leading into LAX.<br />
Sources: Stanley R. H<strong>of</strong>fman Associates, Inc.<br />
California State Controller<br />
6-1 Transient Occupancy Tax Revenues in 2002-2003<br />
Stanley R. H<strong>of</strong>fman Associates, Inc. 56 Economic Conditions and Trends<br />
April 20, 2006<br />
<strong>City</strong> <strong>of</strong> <strong>Inglewood</strong> <strong>General</strong> <strong>Plan</strong> <strong>Update</strong>
6.3 Hollywood Park<br />
• The Hollywood Park Race Track is situated on 240 acres <strong>of</strong> land just 3 miles east <strong>of</strong> the<br />
Los Angeles International Airport.<br />
• In July 2005, Churchill Downs sold the Hollywood Park Race Track to the Bay Meadows<br />
Land Company for $260 million.<br />
• Under the terms <strong>of</strong> the deal, the Bay Meadows Land Company will continue<br />
thoroughbred racing at the track for at least three more years.<br />
• After this three year guarantee, the continuation <strong>of</strong> Hollywood Park as a racing venue<br />
depends on California allowing the addition <strong>of</strong> alternative forms <strong>of</strong> gambling, such as slot<br />
machines, to the track.<br />
• In July 2005, Hollywood Park Inc. sold 42 acres <strong>of</strong> underutilized land for the construction<br />
<strong>of</strong> a retail center that includes Target, Home Depot and Gigante Market.<br />
• The <strong>City</strong> <strong>of</strong> <strong>Inglewood</strong>’s Office <strong>of</strong> Economic and Business Development is expected to<br />
work closely with the Bay Meadows Land Company to secure community and<br />
stakeholder input and ideas on various elements <strong>of</strong> the master planning process for the<br />
redevelopment <strong>of</strong> the Hollywood Park property.<br />
6.4 The Forum<br />
• The Forum is located at the southeast corner <strong>of</strong> Manchester Boulevard and Praire<br />
Avenue. It can hold approximately 18,000 people for concerts and services.<br />
• Since pr<strong>of</strong>essional sports teams such as the Los Angeles Kings, the Los Angeles Lakers,<br />
and the Sparks have moved out <strong>of</strong> the Forum, the site has continued to be used for large<br />
concerts and weekly church services, but has lost its position within Los Angeles as the<br />
premiere entertainment venue.<br />
• The Forum, which is currently under the ownership <strong>of</strong> the Faithful Central Bible Church,<br />
is exploring the idea <strong>of</strong> using its underutilized parking area for housing and retail<br />
development.<br />
6.5 Downtown<br />
• Within the downtown area, there is an increased focus on economic development and<br />
mixed use development. It is the <strong>City</strong>’s hope to have a vibrant downtown, centering on<br />
Market Street, that has commercial, residential, business, governmental and<br />
entertainment uses.<br />
• For the future, a Business Improvement District (BID) is being considered to revitalize<br />
the downtown business environment.<br />
Stanley R. H<strong>of</strong>fman Associates, Inc. 57 Economic Conditions and Trends<br />
April 20, 2006<br />
<strong>City</strong> <strong>of</strong> <strong>Inglewood</strong> <strong>General</strong> <strong>Plan</strong> <strong>Update</strong>
Appendix A<br />
Appendix Table A-1<br />
SIC to NAICS CROSSWALK<br />
SIC NAICS BRIDGE CATEGORIES<br />
AGRICULTURE,FORESTRY,FISHING AGRICULTURE,FORESTRY,FISHING & HUNTING Farming, Fishing, Forestry, Mining<br />
CONSTRUCTION CONSTRUCTION Construction<br />
FEDERAL GOVT FEDERAL GOVT Government<br />
FINANCE,INSURANCE,REAL ESTATE FINANCE & INSURANCE FIRE<br />
REAL ESTATE & RENTAL & LEASING<br />
LOCAL GOVT LOCAL GOVT Government<br />
MANUFACTURING-DURABLE MANUFACTURING Manufacturing<br />
MANUFACTURING-NONDURABLE<br />
MINING MINING Farming, Fishing, Forestry, Mining<br />
RETAIL TRADE RETAIL TRADE Retail<br />
STATE GOVT STATE GOVT Government<br />
TRANS,COMM,ELEC,GAS,SANITARY SERVICES TRANSPORTATION & WAREHOUSING Transporation, Comm, Utlities<br />
UTILITIES<br />
WHOLESALE TRADE WHOLESALE TRADE Wholesale<br />
NON-CLASSIFIED<br />
NON-CLASSIFIED<br />
SERVICES ACCOMMODATION & FOOD SERVICES Services<br />
ADMIN & SUPPORT & WASTE MGMT & REMEDIATION<br />
ARTS, ENTERTAINMENT, & RECRETION<br />
EDUCATIONAL SERVICES<br />
HEALTH CARE & SOCIAL ASSISTANCE<br />
INFORMATION<br />
MANAGEMENT OF COMPANIES AND ENTERPRISES<br />
OTHER SERVICES<br />
PROFESSIONAL, SCIENTIFIC, & TECHNICAL SKILLS<br />
Source: Stanley R.H<strong>of</strong>fman Associates, Inc.<br />
A-1 SIC to NAICS Crosswalk<br />
Stanley R. H<strong>of</strong>fman Associates, Inc. 58 Economic Conditions and Trends<br />
April 20, 2006<br />
<strong>City</strong> <strong>of</strong> <strong>Inglewood</strong> <strong>General</strong> <strong>Plan</strong> <strong>Update</strong>
Appendix Table A-2<br />
Self Employment Rates by NAICS Categories<br />
ID Industry\County 37 SCAG U.S.<br />
72 Accommodation and Food Service 4.8% 4.2% 3.0%<br />
56 Administrative and Support and Waste Services 16.0% 16.3% 9.3%<br />
71 Arts, Entertainment, and Recreation 21.0% 17.5% 16.8%<br />
23 Construction 18.7% 16.6% 20.5%<br />
61 Educational Services 1.8% 1.9% 1.3%<br />
52 Finance and Insurance 6.1% 6.3% 5.3%<br />
62 Health Care and Social Assistance 7.9% 8.2% 6.5%<br />
51 Information 5.8% 5.3% 3.7%<br />
55 Management <strong>of</strong> Companies and Enterprises 3.3% 2.8% 0.0%<br />
31 Manufacturing 2.6% 2.6% 1.9%<br />
21 Natural Resources and Mining 4.5% 3.2% 2.2%<br />
81 Other Services 20.7% 21.1% 14.6%<br />
54 Pr<strong>of</strong>essional, Scientific and Technical Services 17.9% 18.0% 14.2%<br />
92 Public Administration 0.0% 0.0% 0.0%<br />
53 Real Estate and Rental and Leasing 15.7% 16.5% 17.3%<br />
44 Retail Trade 8.5% 7.6% 6.2%<br />
11 Total Farm 15.2% 9.9% 43.5%<br />
10 Total, All Industries 8.5% 8.4% 7.2%<br />
48 Transportation and Warehousing 4.5% 5.1% 6.0%<br />
22 Utilities 0.0% 0.0% 0.0%<br />
42 Wholesale Trade 6.0% 5.9% 3.8%<br />
LA<br />
Source: 2000 Census 5 percent Public Use Microdata Sample, as provided by SCAG.<br />
A-2 Self Employment Rates by NAICS Categories<br />
Stanley R. H<strong>of</strong>fman Associates, Inc. 59 Economic Conditions and Trends<br />
April 20, 2006<br />
<strong>City</strong> <strong>of</strong> <strong>Inglewood</strong> <strong>General</strong> <strong>Plan</strong> <strong>Update</strong>
Appendix B<br />
Project Contacts<br />
<strong>City</strong> <strong>of</strong> <strong>Inglewood</strong><br />
Richard McNish, Economic Development Manager<br />
(310) 412-8800<br />
Wanda Williams, <strong>City</strong> Redevelopment Agency<br />
(310) 412-5290<br />
Baron McCoy, <strong>City</strong> Redevelopment Agency<br />
(310) 412-5290<br />
EIP Associates<br />
Shannon Kimball, Associate <strong>Plan</strong>ner<br />
(310) 268-8132<br />
Stanley R. H<strong>of</strong>fman Associates, Inc. 60 Economic Conditions and Trends<br />
April 20, 2006<br />
<strong>City</strong> <strong>of</strong> <strong>Inglewood</strong> <strong>General</strong> <strong>Plan</strong> <strong>Update</strong>
Chapter 7 Synthesis <strong>of</strong> <strong>Plan</strong>ning Issues<br />
Appendix B<br />
Sensitive Species Potentially<br />
Occurring within the <strong>City</strong> <strong>of</strong><br />
<strong>Inglewood</strong>
Appendix B<br />
Common Name<br />
Sensitive Species Potentially Occurring within the <strong>City</strong> <strong>of</strong> <strong>Inglewood</strong><br />
Scientific Name<br />
Status 2<br />
Fed/CA/CNPS<br />
Habitat and Seasonal Distribution in California<br />
Potential to<br />
Occur Onsite<br />
WILDLIFE<br />
Fish<br />
Mohave tui chub<br />
Invertebrates<br />
Tiger beetle<br />
Sandy beach<br />
tiger beetle<br />
Gila bicolor<br />
mohavensis<br />
Cicindela latesignata<br />
latesignata<br />
Cicindela hirticollis<br />
gravida<br />
FED: FE<br />
CA: SE<br />
FED: None<br />
CA: SC<br />
FED: None<br />
CA: SC<br />
Busck's gall moth Carolella busckana FED: None<br />
CA: SC<br />
Belkin's dune<br />
tabanid fly<br />
Globose dune<br />
beetle<br />
Brennania belkini<br />
Coelus globosus<br />
FED: None<br />
CA: SC<br />
FED: None<br />
CA: SC<br />
Monarch butterfly Danaus plexippus FED: None<br />
CA: SC<br />
Henne's eucosman<br />
moth<br />
El Segundo blue<br />
butterfly<br />
Palos Verdes blue<br />
butterfly<br />
Eucosma hennei<br />
Euphilotes battoides<br />
allyni<br />
Glaucopsyche<br />
lygdamus<br />
palosverdesensis<br />
FED: None<br />
CA: SC<br />
FED: FE<br />
CA: None<br />
FED: FE<br />
CA: None<br />
Mimic tryonia Tryonia imitator FED: None<br />
CA: SC<br />
Lange's El<br />
Segundo dune<br />
weevil<br />
Wandering<br />
skipper<br />
Gertsch’s<br />
socalchemmis<br />
spider<br />
Dorothy's El<br />
Segundo Dune<br />
weevil<br />
Reptiles<br />
Coast (San Diego)<br />
horned lizard<br />
Onychobaris langei<br />
Panoquina errans<br />
Socalchemmis gertschi<br />
Trigonoscuta dorothea<br />
dorothea<br />
Phrynosoma<br />
coronatum<br />
FED: None<br />
CA: SC<br />
FED: None<br />
CA: SC<br />
FED: None<br />
CA: SC<br />
FED: None<br />
CA: SC<br />
FED: None<br />
CA: SC<br />
Endemic to the Mohave River basin,<br />
adapted to alkaline, mineralized<br />
waters.<br />
Mudflats and beaches in coastal<br />
Southern California.<br />
Inhabits areas adjacent to nonbrackish<br />
water along the coast <strong>of</strong><br />
California from San Francisco bay<br />
to Northern Mexico.<br />
Inhabits coastal sand dunes <strong>of</strong><br />
Southern California.<br />
Inhabitant <strong>of</strong> coastal sand dune<br />
habitat, from bodega head in<br />
Sonoma County south to Ensenada,<br />
Mexico.<br />
Winter roost sites extend along the<br />
coast from Northern Mendocino to<br />
Baja California, Mexico.<br />
Endemic to the El Segundo dunes<br />
(type locality), Los Angeles County.<br />
Restricted to remnant coastal dune<br />
habitat in Southern California.<br />
Restricted to the cool, fog-shrouded,<br />
seaward side <strong>of</strong> Palos Verdes Hills,<br />
Los Angeles County.<br />
Inhabits coastal lagoons, estuaries<br />
and salt marshes, from Sonoma<br />
County south to San Diego County.<br />
Known from El Segundo dunes.<br />
Southern California coastal salt<br />
marshes.<br />
Known from only two localities in Los<br />
Angeles county, Brentwood (type<br />
locality) and Topanga Canyon.<br />
Coastal sand dunes in Los Angeles<br />
County.<br />
Inhabits coastal sage scrub and<br />
chaparral in arid and semi-arid<br />
climate conditions.<br />
Absent<br />
Absent<br />
Absent<br />
Absent<br />
Absent<br />
Absent<br />
Low<br />
Low<br />
Absent<br />
Absent<br />
Absent<br />
Absent<br />
Low<br />
Low<br />
Absent<br />
Low<br />
<strong>General</strong> <strong>Plan</strong> Technical Background Report B-1
Appendix B<br />
Common Name<br />
Southwestern<br />
pond turtle<br />
Birds<br />
Tricolored<br />
blackbird<br />
Sensitive Species Potentially Occurring within the <strong>City</strong> <strong>of</strong> <strong>Inglewood</strong><br />
Scientific Name<br />
Emys marmorata<br />
pallida<br />
Agelaius tricolor<br />
Status 2<br />
Fed/CA/CNPS<br />
FED: None<br />
CA: SC<br />
FED: None<br />
CA: SC<br />
Burrowing owl Athene cunicularia FED: None<br />
CA: SC<br />
Western snowy<br />
plover<br />
Southwestern<br />
willow flycatcher<br />
California black<br />
rail<br />
Belding's<br />
savannah<br />
sparrow<br />
Coastal<br />
California<br />
gnatcatcher<br />
California least<br />
tern<br />
Mammals<br />
South coast marsh<br />
vole<br />
Charadrius<br />
alexandrinus nivosus<br />
Empidonax traillii<br />
extimus<br />
Laterallus jamaicensis<br />
coturniculus<br />
Passerculus<br />
sandwichensis beldingi<br />
Polioptila californica<br />
californica<br />
Sterna antillarum<br />
browni<br />
Microtus californicus<br />
stephensi<br />
FED: FT<br />
CA: SC<br />
FED: FE<br />
CA: FE<br />
FED: None<br />
CA: ST<br />
FED: None<br />
CA: SE<br />
FED: FT<br />
CA: SC<br />
FED: FE<br />
CA: SE<br />
FED: None<br />
CA: SC<br />
American badger Taxidea taxus FED: None<br />
CA: SC<br />
Southern<br />
California<br />
saltmarsh shrew<br />
Big free -tailed<br />
bat<br />
Pacific pocket<br />
mouse<br />
Sorex ornatus<br />
salicornicus<br />
Nyctinomops macrotis<br />
Perognathus<br />
longimembris pacificus<br />
FED: None<br />
CA: SC<br />
FED: None<br />
CA: SC<br />
FED: FE<br />
CA: SC<br />
Habitat and Seasonal Distribution in California<br />
Inhabits permanent or nearly<br />
permanent bodies <strong>of</strong> water in many<br />
habitat types; below 6000 ft<br />
elevation.<br />
(Nesting colony) Highly colonial<br />
species, most numerous in Central<br />
Valley & vicinity. Largely endemic<br />
to California.<br />
(Burrow sites) Open, dry annual or<br />
perennial grasslands, deserts &<br />
scrublands characterized by lowgrowing<br />
vegetation.<br />
(Nesting) Federal listing applies<br />
only to the pacific coastal<br />
population.<br />
(Nesting) Riparian woodlands in<br />
Southern California. State listing<br />
includes all subspecies.<br />
Mainly inhabits salt-marshes<br />
bordering larger bays.<br />
Inhabits coastal salt marshes, from<br />
Santa Barbara south through San<br />
Diego County.<br />
Obligate, permanent resident <strong>of</strong><br />
coastal sage scrub below 2500 ft in<br />
Southern California.<br />
(Nesting colony) Nests along the<br />
coast from San Francisco Bay south<br />
to Northern Baja California.<br />
Tidal marshes in Los Angeles,<br />
Orange and Southern Ventura<br />
Counties.<br />
Most abundant in drier open stages<br />
<strong>of</strong> most shrub, forest, and<br />
herbaceous habitats, with friable<br />
soils.<br />
Coastal marshes in Los Angeles,<br />
Orange and Ventura Counties.<br />
Low-lying arid areas in Southern<br />
California.<br />
Inhabits the narrow coastal plains<br />
from the Mexican border north to El<br />
Segundo, Los Angeles County.<br />
Potential to<br />
Occur Onsite<br />
Low<br />
Low<br />
Absent<br />
Absent<br />
Low<br />
Absent<br />
Absent<br />
Moderate<br />
Absent<br />
Moderate<br />
Absent<br />
Absent<br />
Low<br />
Low<br />
B-2<br />
<strong>City</strong> <strong>of</strong> <strong>Inglewood</strong>
Appendix B<br />
Common Name<br />
Sensitive Species Potentially Occurring within the <strong>City</strong> <strong>of</strong> <strong>Inglewood</strong><br />
Scientific Name<br />
Status 2<br />
Fed/CA/CNPS<br />
PLANTS<br />
Aphanisma Aphanisma blitoides FED: None<br />
CA: None<br />
CNPS: 1B<br />
Greata's aster Aster greatae FED: None<br />
CA: None<br />
CNPS: 1B<br />
Braunton's milkvetch<br />
Ventura Marsh<br />
milk-vetch<br />
Coastal dunes<br />
milk-vetch<br />
South Coast<br />
saltscale<br />
Parish's<br />
brittlescale<br />
Davidson's<br />
saltscale<br />
Plummer's<br />
mariposa lily<br />
Santa Barbara<br />
morning-glory<br />
Southern tarplant<br />
Orcutt's pincushion<br />
San Fernando<br />
Valley<br />
spineflower<br />
Salt marsh bird'sbeak<br />
Astragalus brauntonii<br />
Astragalus<br />
pycnostachyus var.<br />
lanosissimus<br />
Astragalus tener var.<br />
titi<br />
Atriplex pacifica<br />
Atriplex parishii<br />
Atriplex serenana var.<br />
davidsonii<br />
Calochortus<br />
plummerae<br />
Calystegia sepium ssp.<br />
binghamiae<br />
Centromadia parryi<br />
ssp. australis<br />
Chaenactis<br />
glabriuscula var.<br />
orcuttiana<br />
Chorizanthe parryi<br />
var. fernandina<br />
Cordylanthus<br />
maritimus ssp.<br />
maritimus<br />
FED: FE<br />
CA: None<br />
CNPS: 1B<br />
FED: FE<br />
CA: SE<br />
CNPS: 1B<br />
FED: FE<br />
CA: SE<br />
CNPS: 1B<br />
FED: None<br />
CA: None<br />
CNPS: 1B<br />
FED: None<br />
CA: None<br />
CNPS: 1B<br />
FED: None<br />
CA: None<br />
CNPS: 1B<br />
FED: None<br />
CA: None<br />
CNPS: 1B<br />
FED: None<br />
CA: None<br />
CNPS: 1A<br />
FED: None<br />
CA: None<br />
CNPS: 1B<br />
FED: None<br />
CA: None<br />
CNPS: 1B<br />
FED: FC<br />
CA: SE<br />
CNPS: 1B<br />
FED: FE<br />
CA: SE<br />
CNPS: 1B<br />
Habitat and Seasonal Distribution in California<br />
Coastal bluff scrub, coastal dunes,<br />
coastal scrub.<br />
Chaparral, cismontane woodland.<br />
Closed-cone coniferous forest,<br />
chaparral, coastal scrub, valley and<br />
foothill grassland.<br />
Coastal salt marsh.<br />
Coastal bluff scrub, coastal dunes.<br />
Coastal scrub, coastal bluff scrub,<br />
playas, chenopod scrub.<br />
Alkali meadows, vernal pools,<br />
chenopod scrub, playas.<br />
Coastal bluff scrub, coastal scrub.<br />
Coastal scrub, chaparral, valley and<br />
foothill grassland, cismontane<br />
woodland, lower montane<br />
coniferous forest.<br />
Coastal marshes.<br />
Marshes and swamps (margins),<br />
valley and foothill grassland, vernal<br />
pools.<br />
Coastal bluff scrub, coastal dunes.<br />
Coastal scrub.<br />
Coastal salt marsh, coastal dunes.<br />
Potential to<br />
Occur Onsite<br />
Low<br />
Absent<br />
Absent<br />
Absent<br />
Moderate<br />
Low<br />
Low<br />
Low<br />
Low<br />
Absent<br />
Moderate<br />
Absent<br />
Low<br />
Absent<br />
<strong>General</strong> <strong>Plan</strong> Technical Background Report B-3
Appendix B<br />
Common Name<br />
Beach<br />
spectaclepod<br />
Many-stemmed<br />
dudleya<br />
Island green<br />
dudleya<br />
Mexican<br />
flannelbush<br />
Los Angeles<br />
sunflower<br />
Mesa horkelia<br />
Coulter's<br />
goldfields<br />
Sensitive Species Potentially Occurring within the <strong>City</strong> <strong>of</strong> <strong>Inglewood</strong><br />
Scientific Name<br />
Dithyrea maritima<br />
Dudleya multicaulis<br />
Dudleya virens ssp.<br />
insularis<br />
Fremontodendron<br />
mexicanum<br />
Helianthus nuttallii ssp.<br />
parishii<br />
Horkelia cuneata ssp.<br />
puberula<br />
Lasthenia glabrata<br />
ssp. coulteri<br />
Status 2<br />
Fed/CA/CNPS<br />
FED: None<br />
CA: ST<br />
CNPS: 1B<br />
FED: None<br />
CA: None<br />
CNPS: 1B<br />
FED: None<br />
CA: None<br />
CNPS: 1B<br />
FED: FE<br />
CA: Rare<br />
CNPS: 1B<br />
FED: None<br />
CA: None<br />
CNPS: 1A<br />
FED: None<br />
CA: None<br />
CNPS: 1B<br />
FED: None<br />
CA: None<br />
CNPS: 1B<br />
Orcutt's linanthus Linanthus orcuttii FED: None<br />
CA: None<br />
CNPS: 1B<br />
Mud nama Nama stenocarpum FED: None<br />
CA: None<br />
CNPS: 2<br />
Spreading<br />
navarretia<br />
Prostrate<br />
navarretia<br />
Coast woollyheads<br />
California Orcutt<br />
grass<br />
Lyon's<br />
pentachaeta<br />
Navarretia fossalis<br />
Navarretia prostrata<br />
Nemacaulis denudata<br />
var. denudata<br />
Orcuttia californica<br />
Pentachaeta lyonii<br />
FED: FT<br />
CA: None<br />
CNPS: 1B<br />
FED: None<br />
CA: None<br />
CNPS: 1B<br />
FED: None<br />
CA: None<br />
CNPS: 1B<br />
FED: FE<br />
CA: SE<br />
CNPS: 1B<br />
FED: FE<br />
CA: SE<br />
CNPS: 1B<br />
Brand's phacelia Phacelia stellaris FED: None<br />
CA: None<br />
CNPS: 1B<br />
Habitat and Seasonal Distribution in California<br />
Coastal dunes, coastal scrub.<br />
Formerly more widespread in<br />
coastal habitats in Southern<br />
California.<br />
Chaparral, coastal scrub, valley and<br />
foothill grassland.<br />
Coastal bluff scrub, coastal scrub.<br />
Closed-cone coniferous forest,<br />
chaparral, cismontane woodland.<br />
Marshes and swamps (coastal salt<br />
and freshwater). Historical from<br />
Southern California.<br />
Chaparral, cismontane woodland,<br />
coastal scrub.<br />
Coastal salt marshes, playas, valley<br />
and foothill grassland, vernal pools.<br />
Chaparral, lower montane<br />
coniferous forest.<br />
Marshes and swamps.<br />
Vernal pools, chenopod scrub,<br />
marshes and swamps, playas.<br />
Coastal scrub, valley and foothill<br />
grassland, vernal pools.<br />
Coastal dunes.<br />
Vernal pools.<br />
Chaparral, valley and foothill<br />
grassland.<br />
Coastal scrub, coastal dunes.<br />
Potential to<br />
Occur Onsite<br />
Low<br />
Low<br />
Low<br />
Absent<br />
Low<br />
Low<br />
Moderate<br />
Low<br />
Absent<br />
Moderate<br />
Low<br />
Absent<br />
Absent<br />
Low<br />
Low<br />
B-4<br />
<strong>City</strong> <strong>of</strong> <strong>Inglewood</strong>
Appendix B<br />
Sensitive Species Potentially Occurring within the <strong>City</strong> <strong>of</strong> <strong>Inglewood</strong><br />
Common Name<br />
Scientific Name<br />
Status 2<br />
Fed/CA/CNPS<br />
Ballona cinquefoil Potentilla multijuga FED: None<br />
CA: None<br />
CNPS: 1A<br />
Parish's<br />
gooseberry<br />
Salt spring<br />
checkerbloom<br />
Ribes divaricatum var.<br />
parishii<br />
Sidalcea neomexicana<br />
FED: None<br />
CA: None<br />
CNPS: 1B<br />
FED: None<br />
CA: None<br />
CNPS: 2<br />
Estuary seablite Suaeda esteroa FED: None<br />
CA: None<br />
CNPS: 1B<br />
San Bernardino<br />
aster<br />
Symphyotrichum<br />
defoliatum<br />
FED: None<br />
CA: None<br />
CNPS: 1B<br />
Habitat and Seasonal Distribution in California<br />
Meadows and seeps.<br />
Riparian woodland.<br />
Alkali playas, brackish marshes,<br />
chaparral, coastal scrub, lower<br />
montane coniferous forest,<br />
Mojavean desert scrub.<br />
Marshes and swamps.<br />
Meadows and seeps, marshes and<br />
swamps, coastal scrub, cismontane<br />
woodland, lower montane<br />
coniferous forest, grassland.<br />
Potential to<br />
Occur Onsite<br />
Low<br />
Absent<br />
Low<br />
Absent<br />
Absent<br />
CDFG SENSITIVE HABITATS<br />
California Walnut Woodland N/A N/A Absent<br />
Southern Coast Live Oak Riparian Forest N/A N/A Absent<br />
Southern Coastal Bluff Scrub N/A N/A Absent<br />
Southern Coastal Salt Marsh N/A N/A Absent<br />
Southern Dune Scrub N/A N/A Absent<br />
Southern Sycamore Alder Riparian N/A N/A Absent<br />
Woodland<br />
Walnut Forest N/A N/A Absent<br />
Federal (FED)<br />
FE = Federally listed; Endangered<br />
FT = Federally listed, Threatened<br />
SC = Federal Species <strong>of</strong> Concern; not an active term, and is provided for informational purposes only.<br />
FPE = Federally Proposed for Listing as Endangered<br />
FPT = Federally Proposed for Listing as Threatened<br />
FC = Federal candidate species (former Category 1 candidates)<br />
State<br />
ST = State listed; Threatened<br />
SE = State listed; Endangered<br />
FP = Fully protected under the California Endangered Species Act<br />
SA = State Special Animal<br />
SC = California Species <strong>of</strong> Special Concern<br />
California Native <strong>Plan</strong>t Society (CNPS) designations analyzed<br />
List 1A: <strong>Plan</strong>ts presumed extinct in California<br />
List 1B: <strong>Plan</strong>ts rare and endangered in California and throughout their range<br />
List 2: <strong>Plan</strong>ts rare, threatened or endangered in California but more common elsewhere in their range.<br />
* • Taxa that are biologically rare, very restricted in distribution, declining throughout their range, or at a critical stage in<br />
their life cycle when residing in California.<br />
• Population(s) in California that may be peripheral to the major portion <strong>of</strong> a taxon’s range, but which are threatened with<br />
extirpation within California.<br />
• Taxa closely associated with a habitat that is declining in California (e.g., wetland, riparian, old growth forest).<br />
<strong>General</strong> <strong>Plan</strong> Technical Background Report B-5
Chapter 7 Synthesis <strong>of</strong> <strong>Plan</strong>ning Issues<br />
Appendix C<br />
Facilities on LUFT List for the <strong>City</strong><br />
<strong>of</strong> <strong>Inglewood</strong>
Appendix C<br />
Facilities on LUFT List for the <strong>City</strong> <strong>of</strong> <strong>Inglewood</strong><br />
Site Name Address Substance Status<br />
1 7-11 #24142 345 Manchester Blvd Gasoline/Automotive Closed<br />
2 76 Products Station #2156 400 Arbor Vitae St W Gasoline/Automotive Closed<br />
3 76 Products Station #3349 1430 La Brea Blvd N Waste Oil/Used Oil Open<br />
4 Abacus Ro<strong>of</strong> Corp 715 Centinela Ave Gasoline/Automotive Closed<br />
5 Airline Coach Service<br />
636 South La Brea<br />
Avenue<br />
Waste Oil/Used Oil<br />
Open<br />
6 Airport Business Center 315 Glasgow Ave S Waste Oil/Used Oil Closed<br />
7 Allright Self Storage 808 La Brea Ave<br />
Aviation Gasoline And<br />
Additives<br />
Closed<br />
8 Arco #1360 1761 Centinela Ave Gasoline/Automotive Closed<br />
9 Arco #1360 1761 Centinela Ave. Gasoline/Automotive Open<br />
10<br />
Arco #9645/Former Thrifty<br />
Oil #251<br />
4130 Century Blvd W Gasoline/Automotive Open<br />
11 Arco Products #09644 6500 S La Cienega Gasoline/Automotive Open<br />
12 Buffington Motors 440 Market St N Gasoline/Automotive Closed<br />
13 Cal National Guard Armory 111 Grosvenor St Gasoline/Automotive Closed<br />
14 Carmax<br />
355 South Glasgow<br />
Avenue<br />
Diesel Fuel Oil And Additives Open<br />
15 Centinela Hospital Med. Ctr. 622 La Brea Ave N<br />
Aviation Gasoline And<br />
Additives<br />
Open<br />
16 Century Mobil 1244 <strong>Inglewood</strong> Ave S Gasoline/Automotive Open<br />
17 Century Park Cleaners 3201 Century Blvd W<br />
Aviation Gasoline And<br />
Additives<br />
Closed<br />
18 Chevron 1358 Centinela Ave Gasoline/Automotive Closed<br />
19 Chevron # 9-0017 1300 Centinela Ave Gasoline/Automotive Closed<br />
20 Chevron #9-0017 1300 Centinela Ave Gasoline/Automotive Closed<br />
21 Chevron #9-1244 8409 8th Ave Gasoline/Automotive Closed<br />
22 Chevron #9-3829 303 Manchester Blvd W Waste Oil/Used Oil Closed<br />
23 Chevron #9-6594 2600 Manchester Blvd E Waste Oil/Used Oil Open<br />
24 Chevron #9-8503 11400 Crenshaw Blvd Gasoline/Automotive Closed<br />
25<br />
Chevron Service Station # 9-<br />
3829<br />
303 Manchester Blvd. W. 8006619,71432,Mtbe Open<br />
26<br />
<strong>City</strong> Of <strong>Inglewood</strong> Maint.<br />
Yard<br />
222 Beach Ave W Gasoline/Automotive Closed<br />
27 Colling Trust Property 9117 Aviation Blvd Hydrocarbons Open<br />
28 Collins Trust 9121 Aviation Blvd Hydrocarbons Closed<br />
29 Cypress Fee Pit 12001 Forum Rd Waste Oil/Used Oil Open<br />
30 Daniel Freeman Hospital 333 Prairie Ave N Diesel fuel oil and additives Closed<br />
31 Delorme Chevrolet 1175 La Brea Ave S Waste Oil/Used Oil Closed<br />
32 Dombrowski's Flowers 4940 Century Blvd W Gasoline/Automotive Closed<br />
33 El Amin's Automotive Site 1001 Hyde Park Blvd E Gasoline/Automotive Closed<br />
34 Emery World Wide 3600 Century Blvd W Hydrocarbons Open<br />
35 Emery Worldwide 3600 Century Blvd W Diesel Fuel Oil And Additives Closed<br />
36 Exxon #7-2571 (Former) 3102 Century Blvd W Gasoline/Automotive Closed<br />
37 Exxon #7-4181 633 Manchester Blvd W Gasoline/Automotive Closed<br />
<strong>General</strong> <strong>Plan</strong> Technical Background Report C-1
Appendix C<br />
Facilities on LUFT List for the <strong>City</strong> <strong>of</strong> <strong>Inglewood</strong><br />
Site Name Address Substance Status<br />
38 Family Of Faith Church 400 Florence Ave W Gasoline/Automotive Closed<br />
39<br />
Fast Fuel #77 / Texaco-<br />
Former<br />
3754 Imperial Hwy W Gasoline/Automotive Open<br />
40 Freight Forwarders (Formerly) 9107 Aviation Bl S Gasoline/Automotive Closed<br />
41 Fritz Foreign Service<br />
4501 West Century<br />
Boulevard<br />
Waste Oil/Used Oil<br />
Open<br />
42 Fujita Corporation 230 La Brea Ave. N. Gasoline/Automotive Open<br />
43 Global Gasoline 10800 S Prairie Ave Gasoline/Automotive Open<br />
44 Great Western Forum 3900 Manchester Blvd W Gasoline/Automotive Closed<br />
45 Harry's Airport Garage 9131 Aviation Blvd S Gasoline/Automotive Open<br />
46 Holly Park Car Wash 3350 Century Blvd W Gasoline/Automotive Open<br />
47 <strong>Inglewood</strong> Car Wash 320 La Brea Ave N Gasoline/Automotive Closed<br />
48 <strong>Inglewood</strong> Park Cemetery 720 Florence Ave E<br />
Aviation Gasoline And<br />
Additives<br />
Closed<br />
49<br />
<strong>Inglewood</strong> Redevelopment<br />
Agency<br />
3250 Century Blvd W Gasoline/Automotive Closed<br />
50 <strong>Inglewood</strong> Transmission, Inc 4919 West Century Blvd Gasoline/Automotive Open<br />
51 Jim Lynch Cadillac 1213 Centinela Ave Waste Oil/Used Oil Closed<br />
52 Lax Equipment<br />
830 West Florence<br />
Avenue<br />
Diesel Fuel Oil And Additives Open<br />
53 Levine Family Trust 815 Hyde Park Ave W<br />
Aviation Gasoline and<br />
Additives<br />
Closed<br />
54 Lincoln Discount Tire 868 La Brea Ave S Waste Oil/Used Oil Closed<br />
55 Mobil #11-Apj 3016 Century Blvd W Gasoline/Automotive Open<br />
56 Mobil #11-Kkx 8600 Crenshaw Blvd S Waste Oil/Used Oil Closed<br />
57 Mobil #18-Kkx 8600 Crenshaw Blvd S Hydrocarbons Closed<br />
58 Mobil #18-Len 8307 La Cienega Blvd S Gasoline/Automotive Open<br />
59 Mobil 18-Gj4 1007 La Brea Ave N Gasoline/Automotive Open<br />
60 P & M #0021 1100 Manchester Blvd W Hydrocarbons Open<br />
61 Park's Auto 4760 Imperial Hwy W Gasoline/Automotive Open<br />
62 Prince Chrysler Plymouth 1030 Manchester W Waste Oil/Used Oil Closed<br />
63 Ramar Industries 426 East 99th Street Gasoline/Automotive Open<br />
64 Rent A Car Cheap 4858 Century Blvd W Gasoline/Automotive Closed<br />
65 Rho-Chem Corporation 425 Isis Ave Solvents Open<br />
66 Sears Auto Center (Former) 500 Manchester Blvd E Gasoline/Automotive Closed<br />
67 Shell 1135 Manchester Blvd W Waste Oil/Used Oil Open<br />
68 Shell Service Station 6800 Prairie Ave S Hydrocarbons Open<br />
69 Shell Service Station 804 Manchester Blvd W. 8006619, 76 MTBE Closed<br />
70 Simons Mini Market 501 Manchester Ave E Gasoline/Automotive Open<br />
71 Southern California Edison 8611 La Cienega Blvd Gasoline/Automotive Closed<br />
72 Sparling Buick 737 La Brea Ave N Gasoline/Automotive Closed<br />
73 Ss #23552 435 La Brea Ave N<br />
Aviation Gasoline And<br />
Additives<br />
Closed<br />
74 Texaco Gas Food Mart 1235 Centinela Ave Gasoline/Automotive Open<br />
C-2<br />
<strong>City</strong> <strong>of</strong> <strong>Inglewood</strong>
Appendix C<br />
Facilities on LUFT List for the <strong>City</strong> <strong>of</strong> <strong>Inglewood</strong><br />
Site Name Address Substance Status<br />
75 Tire World (Former Arco) 920 Manchester Blvd W Gasoline/Automotive Open<br />
76 Tosco - 76 Station #2365 8600 Aviation Blvd Gasoline/Automotive Open<br />
77 Tosco S.S. #2900 9830 Crenshaw Blvd S Gasoline/Automotive Open<br />
78 Toyota Of <strong>Inglewood</strong> 700 La Brea Ave S Gasoline/Automotive Closed<br />
79<br />
Transit Mixed Concrete<br />
Company<br />
505 Railroad Pl Diesel Fuel Oil And Additives Closed<br />
80<br />
Trustees Of The Highland<br />
Street Connection<br />
11950 Aviation Blvd. 8006619,13 Mtbe Closed<br />
81 United Oil #57 4520 Century Blvd W Gasoline/Automotive Open<br />
82 Unocal #1923 145 Manchester Blvd E Waste Oil/Used Oil Closed<br />
83 Unocal #3145 3101 Imperial Hwy W Gasoline/Automotive Closed<br />
84 Unocal #3836 1740 Centinela Ave Waste Oil/Used Oil Closed<br />
85 Unocal #5050 (Former) 4000 Century Blvd W Gasoline/Automotive Closed<br />
86 Unocal #5771 843 La Brea Ave S Gasoline/Automotive Closed<br />
87 Unocal #6370 4760 Century Blvd W Gasoline/Automotive Open<br />
88 Van's Shell #2 3107 Manchester Blvd W Hydrocarbons Open<br />
89 World Oil #15 740 Centinela Ave Gasoline/Automotive Open<br />
90 Your Man Tour 8831 Aviation Blvd Diesel Fuel Oil And Additives Closed<br />
SOURCE: LARWQCB LUFT List (http://geotracker.swrcb.ca.gov/search/)<br />
“Open” status indicates that the site is still under investigation and/or cleanup.<br />
“Closed” status indicates that no additional investigation or cleanup is required at the site at this time, but does not mean that<br />
the contamination has been remediated.<br />
<strong>General</strong> <strong>Plan</strong> Technical Background Report C-3