- Page 1 and 2: City of August 2006 General Plan Up
- Page 3 and 4: Contents CHAPTER 1 Introduction ...
- Page 5 and 6: Contents Figure 2.3-12 City of Ingl
- Page 7 and 8: Contents Table 2.3-26 City of Ingle
- Page 9 and 10: Chapter 1 Introduction Table 1-1 El
- Page 11 and 12: CITY of INGLEWOOD General Plan REGI
- Page 13 and 14: CHAPTER 2 Community Development Thi
- Page 15 and 16: CITY of INGLEWOOD General Plan EXIS
- Page 17 and 18: Chapter 2 Community Development Nor
- Page 19 and 20: Chapter 2 Community Development not
- Page 21 and 22: Chapter 2 Community Development Mos
- Page 23 and 24: Chapter 2 Community Development Man
- Page 25 and 26: Chapter 2 Community Development por
- Page 27 and 28: Chapter 2 Community Development Ind
- Page 29 and 30: Chapter 2 Community Development The
- Page 31 and 32: Chapter 2 Community Development res
- Page 33 and 34: 2.1 Land Use Commercial Existing lo
- Page 35 and 36: W 64TH ST S LA CIENEGA BLVD S ASH A
- Page 37 and 38: 2.1 Land Use Chili’s. An estimate
- Page 39 and 40: CITY of INGLEWOOD General Plan EXIS
- Page 41 and 42: Chapter 2 Community Development Flo
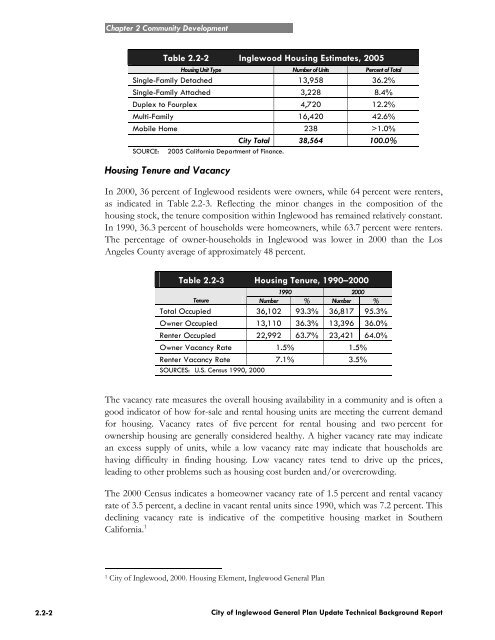
- Page 43: 2.2 Housing 2.2 HOUSING This sectio
- Page 47 and 48: 2.2 Housing Table 2.2-6 Apartment R
- Page 49 and 50: 2.2 Housing Table 2.2-8 Housing Pro
- Page 51 and 52: 2.2 Housing Table 2.2-30 RHNA Const
- Page 53 and 54: 2.2 Housing The zoning classificati
- Page 55 and 56: 2.2 Housing to an eligible househol
- Page 57 and 58: 2.3 Economic Trends and Conditions
- Page 59 and 60: 2.3 Economic Trends and Conditions
- Page 61 and 62: 2.3 Economic Trends and Conditions
- Page 63 and 64: 2.3 Economic Trends and Conditions
- Page 65 and 66: 2.3 Economic Trends and Conditions
- Page 67 and 68: 2.3 Economic Trends and Conditions
- Page 69 and 70: 2.3 Economic Trends and Conditions
- Page 71 and 72: 2.3 Economic Trends and Conditions
- Page 73 and 74: 2.3 Economic Trends and Conditions
- Page 75 and 76: 2.3 Economic Trends and Conditions
- Page 77 and 78: 2.3 Economic Trends and Conditions
- Page 79 and 80: 2.3 Economic Trends and Conditions
- Page 81 and 82: 2.3 Economic Trends and Conditions
- Page 83 and 84: 2.3 Economic Trends and Conditions
- Page 85 and 86: 2.3 Economic Trends and Conditions
- Page 87 and 88: 2.3 Economic Trends and Conditions
- Page 89 and 90: 2.3 Economic Trends and Conditions
- Page 91 and 92: 2.3 Economic Trends and Conditions
- Page 93 and 94: 2.3 Economic Trends and Conditions
- Page 95 and 96:
2.3 Economic Trends and Conditions
- Page 97 and 98:
2.3 Economic Trends and Conditions
- Page 99 and 100:
2.3 Economic Trends and Conditions
- Page 101 and 102:
2.3 Economic Trends and Conditions
- Page 103 and 104:
CHAPTER 3 Infrastructure This chapt
- Page 105 and 106:
CITY of INGLEWOOD General Plan WATE
- Page 107 and 108:
Chapter 3 Infrastructure Groundwate
- Page 109 and 110:
Chapter 3 Infrastructure Table 3.1-
- Page 111 and 112:
Chapter 3 Infrastructure suppliers
- Page 113 and 114:
3.2 Sewer and Wastewater 3.2 SEWER
- Page 115 and 116:
CITY of INGLEWOOD General Plan SEWE
- Page 117 and 118:
Chapter 3 Infrastructure City of In
- Page 119 and 120:
Chapter 3 Infrastructure There are
- Page 121 and 122:
3.3 Storm Drains NPDES Permit Progr
- Page 123 and 124:
3.3 Storm Drains National Pollutant
- Page 125 and 126:
Chapter 3 Infrastructure Waste Mana
- Page 127 and 128:
Chapter 3 Infrastructure Table 3.4-
- Page 129 and 130:
Chapter 3 Infrastructure Table 3.4-
- Page 131 and 132:
3.5 Electricity 3.5 ELECTRICITY Thi
- Page 133 and 134:
3.6 Natural Gas 3.6 NATURAL GAS Thi
- Page 135 and 136:
3.7 Telecommunications 3.7 TELECOMM
- Page 137 and 138:
3.8 Circulation 3.8 CIRCULATION The
- Page 139 and 140:
3.8 Circulation The following stree
- Page 141 and 142:
K AREEM CT CITY of INGLEWOOD Genera
- Page 143 and 144:
Chapter 3 Infrastructure City-Owned
- Page 145 and 146:
Chapter 3 Infrastructure operating
- Page 147 and 148:
S R E DF E R N AV AL L E Y N OAK S
- Page 149 and 150:
Chapter 3 Infrastructure Hawthorne/
- Page 151 and 152:
3.8 Circulation • Arbor Vitae Str
- Page 153 and 154:
CITY of INGLEWOOD General Plan CITY
- Page 155 and 156:
CHAPTER 4 Community Services This c
- Page 157 and 158:
4.1 Schools Table 4.1-1 Public Scho
- Page 159 and 160:
N MARKET ST S MARKET ST CULLEN WY S
- Page 161 and 162:
Chapter 4 Community Services Langua
- Page 163 and 164:
Chapter 4 Community Services • Mo
- Page 165 and 166:
Chapter 4 Community Services Distri
- Page 167 and 168:
Chapter 4 Community Services upgrad
- Page 169 and 170:
4.2 Recreation and Parks 4.2 RECREA
- Page 171 and 172:
CITY of INGLEWOOD General Plan PARK
- Page 173 and 174:
Chapter 4 Community Services Table
- Page 175 and 176:
Chapter 4 Community Services The In
- Page 177 and 178:
Chapter 4 Community Services need f
- Page 179 and 180:
Chapter 4 Community Services and pr
- Page 181 and 182:
4.3 Library Services 4.3 LIBRARY SE
- Page 183 and 184:
CITY of INGLEWOOD General Plan LIBR
- Page 185 and 186:
Chapter 4 Community Services Librar
- Page 187 and 188:
Chapter 5 Environmental Resources t
- Page 189 and 190:
Chapter 5 Environmental Resources
- Page 191 and 192:
5.1 Biological Resources California
- Page 193 and 194:
5.2 Hydrology and Water Quality 5.2
- Page 195 and 196:
CITY of INGLEWOOD General Plan WATE
- Page 197 and 198:
Chapter 5 Environmental Resources s
- Page 199 and 200:
Chapter 5 Environmental Resources o
- Page 201 and 202:
Chapter 5 Environmental Resources T
- Page 203 and 204:
Chapter 5 Environmental Resources i
- Page 205 and 206:
Chapter 5 Environmental Resources
- Page 207 and 208:
P:\Projects - All Users\D21000.00+\
- Page 209 and 210:
5.4 Visual Resources such as parks,
- Page 211 and 212:
5.4 Visual Resources Saint John Chr
- Page 213 and 214:
5.4 Visual Resources • The S.H. K
- Page 215 and 216:
5.5 Historical and Cultural Resourc
- Page 217 and 218:
CITY of INGLEWOOD General Plan HIST
- Page 219 and 220:
Chapter 5 Environmental Resources m
- Page 221 and 222:
Chapter 5 Environmental Resources w
- Page 223 and 224:
Chapter 5 Environmental Resources
- Page 225 and 226:
Chapter 5 Environmental Resources I
- Page 227 and 228:
Chapter 5 Environmental Resources C
- Page 229 and 230:
Chapter 5 Environmental Resources
- Page 231 and 232:
Chapter 5 Environmental Resources L
- Page 233 and 234:
Chapter 5 Environmental Resources T
- Page 235 and 236:
5.6 Air Quality Area sources are wi
- Page 237 and 238:
5.6 Air Quality exposure to air pol
- Page 239 and 240:
5.6 Air Quality warm, stable period
- Page 241 and 242:
5.6 Air Quality The most congested
- Page 243 and 244:
5.6 Air Quality the City of Inglewo
- Page 245 and 246:
5.6 Air Quality level, CAA is admin
- Page 247 and 248:
5.6 Air Quality (2) replace long-te
- Page 249 and 250:
CHAPTER 6 Community Safety and Haza
- Page 251 and 252:
6.1 Geology, Soils, and Mineral Res
- Page 253 and 254:
Chapter 6 Community Safety and Haza
- Page 255 and 256:
6.2 Seismic Hazards Table 6.2-1 Rel
- Page 257 and 258:
6.2 Seismic Hazards usually a house
- Page 259 and 260:
6.2 Seismic Hazards The hillside ar
- Page 261 and 262:
6.2 Seismic Hazards Local Building
- Page 263 and 264:
6.2 Seismic Hazards • Inactive fa
- Page 265 and 266:
Chapter 6 Community Safety and Haza
- Page 267 and 268:
Chapter 6 Community Safety and Haza
- Page 269 and 270:
Chapter 6 Community Safety and Haza
- Page 271 and 272:
6.5 Hazardous Materials 6.5 HAZARDO
- Page 273 and 274:
6.5 Hazardous Materials Caprice Cle
- Page 275 and 276:
CITY of INGLEWOOD General Plan LOCA
- Page 277 and 278:
Chapter 6 Community Safety and Haza
- Page 279 and 280:
Chapter 6 Community Safety and Haza
- Page 281 and 282:
Chapter 6 Community Safety and Haza
- Page 283 and 284:
Chapter 6 Community Safety and Haza
- Page 285 and 286:
6.6 Police Services The Communicati
- Page 287 and 288:
6.6 Police Services 26 seconds; day
- Page 289 and 290:
6.6 Police Services Future Demands
- Page 291 and 292:
Chapter 6 Community Safety and Haza
- Page 293 and 294:
6.7 Fire Services Fire and Medical
- Page 295 and 296:
6.8 Emergency Preparedness 6.8 EMER
- Page 297 and 298:
6.8 Emergency Preparedness When loc
- Page 299 and 300:
6.8 Emergency Preparedness necessar
- Page 301 and 302:
6.8 Emergency Preparedness by the G
- Page 303 and 304:
6.8 Emergency Preparedness Local As
- Page 305 and 306:
Chapter 6 Community Safety and Haza
- Page 307 and 308:
Chapter 6 Community Safety and Haza
- Page 309 and 310:
6.9 Noise The noise levels were mea
- Page 311 and 312:
6.9 Noise Table 6.9-3 Roadway Segme
- Page 313 and 314:
CITY of INGLEWOOD General Plan EXIS
- Page 315 and 316:
Chapter 6 Community Safety and Haza
- Page 317 and 318:
6.9 Noise Table 6.9-4 Land Use Cate
- Page 319 and 320:
6.9 Noise Table 6.9-6 Exterior Nois
- Page 321 and 322:
CHAPTER 7 Synthesis of Planning Iss
- Page 323 and 324:
Chapter 7 Synthesis of Planning Iss
- Page 325 and 326:
Chapter 7 Synthesis of Planning Iss
- Page 327 and 328:
Chapter 7 Synthesis of Planning Iss
- Page 329 and 330:
CONTENTS TABLES ...................
- Page 331 and 332:
TABLES 2-1 Population Trends: 1990-
- Page 333 and 334:
FIGURES 1-1 City of Inglewood and S
- Page 335 and 336:
Beach Port, local and regional conn
- Page 337 and 338:
• Finance, Insurance and Real Est
- Page 339 and 340:
Chapter 1 - INTRODUCTION 1.1 Backgr
- Page 341 and 342:
Figure 1-1 City of Inglewood and Su
- Page 343 and 344:
Chapter 2 - COMMUNITY OVERVIEW This
- Page 345 and 346:
Population Growth from 2000 to 2005
- Page 347 and 348:
Table 2-3 Housing Tenure: 1990-2000
- Page 349 and 350:
Age of Housing Stock • As shown i
- Page 351 and 352:
2.5 Overcrowding • Overcrowding i
- Page 353 and 354:
Figure 2-4 Race and Ethnicity: 2000
- Page 355 and 356:
Figure 2-5 Age Distributions in Ing
- Page 357 and 358:
Figure 2-6 AA Degree and Above in C
- Page 359 and 360:
Comparative Unemployment Rates •
- Page 361 and 362:
2.10 Household Income • As shown
- Page 363 and 364:
2.11 Projected Population, Househol
- Page 365 and 366:
Figure 2-9 Projected Population and
- Page 367 and 368:
Table 3-1 City of Inglewood Employm
- Page 369 and 370:
Figure 3-2 City of Inglewood Servic
- Page 371 and 372:
Figure 3-3 City of Inglewood Averag
- Page 373 and 374:
Table 3-4 City of Inglewood Distrib
- Page 375 and 376:
Table 3-5 City of Inglewood Distrib
- Page 377 and 378:
3.5 City of Inglewood Compared with
- Page 379 and 380:
Figure 4-1 City of Inglewood Taxabl
- Page 381 and 382:
4.4 Comparative Taxable Retail Sale
- Page 383 and 384:
4.5 City of Inglewood Retail Leakag
- Page 385 and 386:
Table 4-5 City of Inglewood Retail
- Page 387 and 388:
Chapter 5 - Real Estate Trends 5.1
- Page 389 and 390:
Year Table 5-2 City of Inglewood Re
- Page 391 and 392:
Condominiums • As shown in Table
- Page 393 and 394:
Chapter 6- LOCATIONAL AND ECONOMIC
- Page 395 and 396:
6.3 Hollywood Park • The Hollywoo
- Page 397 and 398:
Appendix Table A-2 Self Employment
- Page 399 and 400:
Chapter 7 Synthesis of Planning Iss
- Page 401 and 402:
Appendix B Common Name Southwestern
- Page 403 and 404:
Appendix B Common Name Beach specta
- Page 405 and 406:
Chapter 7 Synthesis of Planning Iss
- Page 407 and 408:
Appendix C Facilities on LUFT List