General Plan Update - City of Inglewood
General Plan Update - City of Inglewood
General Plan Update - City of Inglewood

Create successful ePaper yourself
Turn your PDF publications into a flip-book with our unique Google optimized e-Paper software.
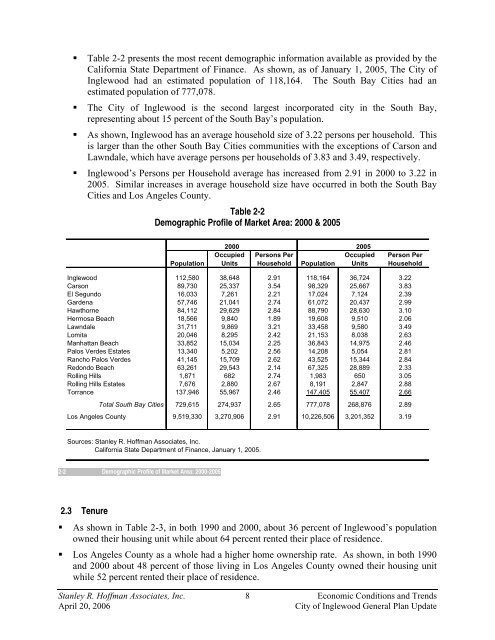
• Table 2-2 presents the most recent demographic information available as provided by the<br />
California State Department <strong>of</strong> Finance. As shown, as <strong>of</strong> January 1, 2005, The <strong>City</strong> <strong>of</strong><br />
<strong>Inglewood</strong> had an estimated population <strong>of</strong> 118,164. The South Bay Cities had an<br />
estimated population <strong>of</strong> 777,078.<br />
• The <strong>City</strong> <strong>of</strong> <strong>Inglewood</strong> is the second largest incorporated city in the South Bay,<br />
representing about 15 percent <strong>of</strong> the South Bay’s population.<br />
• As shown, <strong>Inglewood</strong> has an average household size <strong>of</strong> 3.22 persons per household. This<br />
is larger than the other South Bay Cities communities with the exceptions <strong>of</strong> Carson and<br />
Lawndale, which have average persons per households <strong>of</strong> 3.83 and 3.49, respectively.<br />
• <strong>Inglewood</strong>’s Persons per Household average has increased from 2.91 in 2000 to 3.22 in<br />
2005. Similar increases in average household size have occurred in both the South Bay<br />
Cities and Los Angeles County.<br />
Table 2-2<br />
Demographic Pr<strong>of</strong>ile <strong>of</strong> Market Area: 2000 & 2005<br />
Population<br />
2000<br />
Occupied<br />
Units<br />
Persons Per<br />
Household<br />
Population<br />
2005<br />
Occupied<br />
Units<br />
Person Per<br />
Household<br />
<strong>Inglewood</strong> 112,580 38,648 2.91 118,164 36,724 3.22<br />
Carson 89,730 25,337 3.54 98,329 25,667 3.83<br />
El Segundo 16,033 7,261 2.21 17,024 7,124 2.39<br />
Gardena 57,746 21,041 2.74 61,072 20,437 2.99<br />
Hawthorne 84,112 29,629 2.84 88,790 28,630 3.10<br />
Hermosa Beach 18,566 9,840 1.89 19,608 9,510 2.06<br />
Lawndale 31,711 9,869 3.21 33,458 9,580 3.49<br />
Lomita 20,046 8,295 2.42 21,153 8,038 2.63<br />
Manhattan Beach 33,852 15,034 2.25 36,843 14,975 2.46<br />
Palos Verdes Estates 13,340 5,202 2.56 14,208 5,054 2.81<br />
Rancho Palos Verdes 41,145 15,709 2.62 43,525 15,344 2.84<br />
Redondo Beach 63,261 29,543 2.14 67,325 28,889 2.33<br />
Rolling Hills 1,871 682 2.74 1,983 650 3.05<br />
Rolling Hills Estates 7,676 2,880 2.67 8,191 2,847 2.88<br />
Torrance 137,946 55,967 2.46 147,405 55,407 2.66<br />
Total South Bay Cities 729,615 274,937 2.65 777,078 268,876 2.89<br />
Los Angeles County 9,519,330 3,270,906 2.91 10,226,506 3,201,352 3.19<br />
Sources: Stanley R. H<strong>of</strong>fman Associates, Inc.<br />
California State Department <strong>of</strong> Finance, January 1, 2005.<br />
2-2 Demographic Pr<strong>of</strong>ile <strong>of</strong> Market Area: 2000-2005<br />
2.3 Tenure<br />
• As shown in Table 2-3, in both 1990 and 2000, about 36 percent <strong>of</strong> <strong>Inglewood</strong>’s population<br />
owned their housing unit while about 64 percent rented their place <strong>of</strong> residence.<br />
• Los Angeles County as a whole had a higher home ownership rate. As shown, in both 1990<br />
and 2000 about 48 percent <strong>of</strong> those living in Los Angeles County owned their housing unit<br />
while 52 percent rented their place <strong>of</strong> residence.<br />
Stanley R. H<strong>of</strong>fman Associates, Inc. 8 Economic Conditions and Trends<br />
April 20, 2006<br />
<strong>City</strong> <strong>of</strong> <strong>Inglewood</strong> <strong>General</strong> <strong>Plan</strong> <strong>Update</strong>